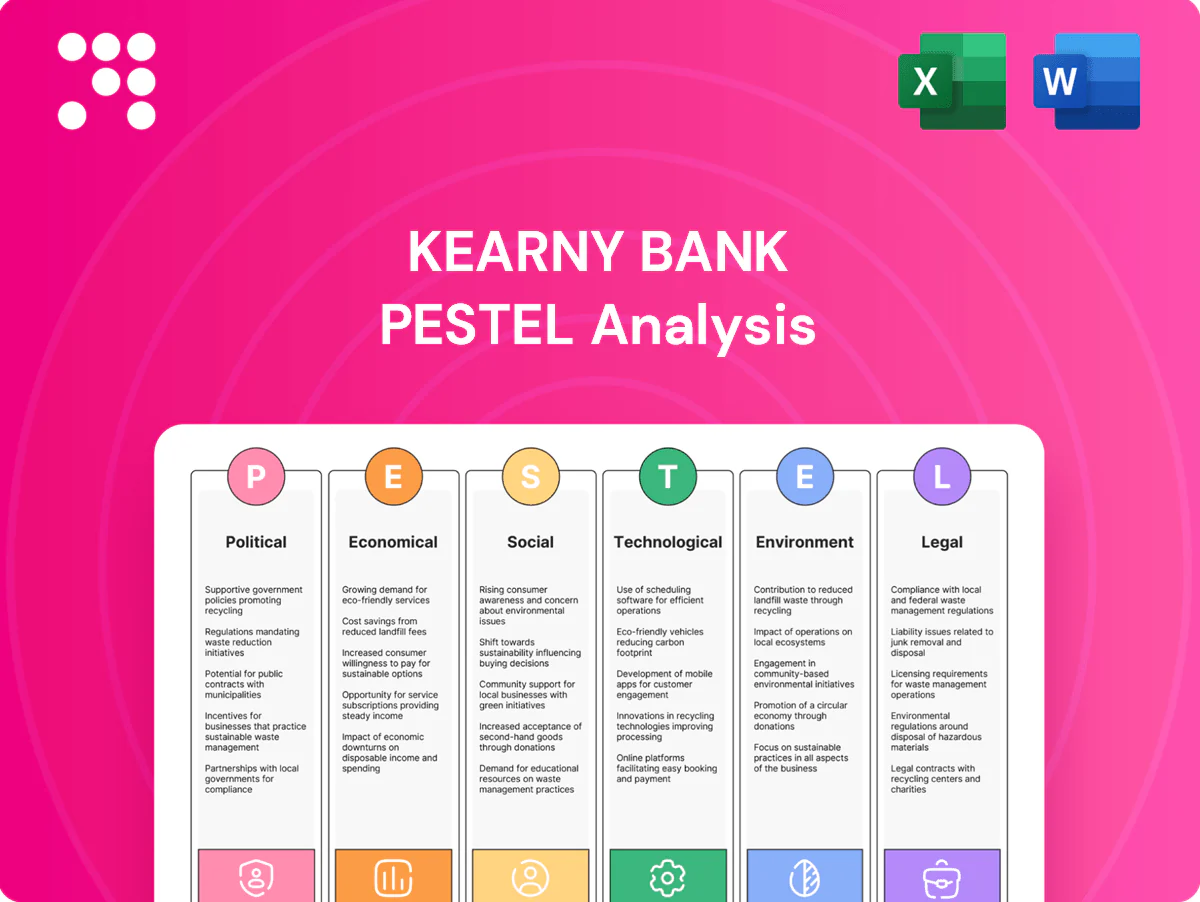
Kearny Bank PESTLE Analysis

Make Smarter Strategic Decisions with a Complete PESTEL View
Discover how political shifts, economic cycles, regulatory change, social trends, technological disruption, and environmental risks are reshaping Kearny Bank’s strategic outlook. Our concise PESTLE highlights the forces that matter to investors and executives. Purchase the full analysis to access actionable insights and an editable, board-ready report instantly.
Political factors

State-level banking posture
New Jersey and New York policymakers shape community bank priorities via regional development and housing agendas, influencing demand for affordable housing and small business lending. The two states hold a combined population of about 29.1 million, driving sizable local credit needs. New York’s fiscal year begins April 1 and New Jersey’s July 1, so Kearny Bank must track legislative calendars, budget cycles and public–private programs closely.
Municipal relationships
Local governments in New Jersey, which has 565 municipalities and ~9.3 million residents (2024 est.), control permitting, zoning and public deposit placement that shape Kearny Bank branch siting and loan pipelines. Participation in municipal lending or depository programs can deepen market access; shifts in procurement rules or collateral requirements can squeeze margins. Active stakeholder engagement sustains visibility and trust.

Federal policy direction
Executive priorities on consumer protection, housing finance, and financial stability shape supervisory tone and drive heightened examinations and guidance affecting Kearny Bank. Appointments at the FDIC, OCC, and CFPB shift rulemaking emphasis and timing, increasing compliance costs and planning uncertainty around election cycles. Changes in GSE policy — FHFA set the 2024 conforming loan limit at 766,550 — directly affect mortgage underwriting and pricing. Political cycles amplify timing risk for strategic decisions.

Infrastructure and transit funding
- Policy drivers: Bipartisan Infrastructure Law $1.2T
- Regional programs: MTA $51.5B; NJ TRANSIT $16B
- Risk: delayed drawdowns reduce utilization
- Opportunity: align pipelines with funded corridors
Community reinvestment expectations
Proactive outreach, community impact lending and deposit products reduce regulatory and reputational risk.
- May 2024 CRA rule: stronger data & geographies
- Transparency: branch deserts & fair access
- Ratings tied to qualitative + quantitative tests
- Mitigation: outreach & impact products
NY/NJ policy and budget timing plus CRA changes boost CRE and contractor lending demand
NY/NJ policy (pop 29.1M; NJ 9.3M) shapes demand for housing, small‑business and municipal lending; NY budget Apr 1, NJ Jul 1 affect program timing. May 2024 CRA revisions, FDIC/CFPB shifts and 2024 conforming limit $766,550 raise compliance costs. Infrastructure funding ($1.2T BIL; MTA $51.5B; NJT $16B) creates CRE and contractor lending opportunities.
| Metric | Value |
|---|---|
| Region pop | 29.1M |
| NJ pop | 9.3M |
| Conforming (2024) | $766,550 |
| Infrastructure | $1.2T; MTA $51.5B; NJT $16B |
What is included in the product
 Detailed Word Document
Explores how Political, Economic, Social, Technological, Environmental and Legal forces uniquely affect Kearny Bank, with data-backed trends, forward-looking scenario insights, and actionable implications to help executives, consultants and investors identify risks, opportunities and strategy-ready recommendations for reports and decks.

 Customizable Excel Spreadsheet
A concise, visually segmented PESTLE summary for Kearny Bank that distills regulatory, economic, social, technological, environmental, and legal risks into an editable, presentation-ready snapshot. Easily shared and annotated for quick alignment across teams and planning sessions.
Economic factors

Interest rate cycle
Net interest margin at Kearny Bank is driven by Fed policy (effective funds ~5.25–5.50% mid‑2025), deposit betas commonly 30–50% and asset repricing speed; a steepening Treasury curve supports term lending while inversion compresses spreads. Mortgage prepayment speeds have risen to ~20–30% CPR after rate cuts, shifting fee income and shortening duration. Robust balance sheet hedging (swaps, caps) is critical to stabilize earnings.
Regional CRE dynamics
NJ/NY office and retail fundamentals—Manhattan office vacancy ~18% in 2024—erode credit performance and valuations. Higher vacancies and roughly 150–250 bps cap‑rate expansion since 2021 pressure DSCR and refinancing outcomes. Industrial vacancy ~4–5% and multifamily ~3–4% remain relatively resilient but rate‑sensitive. Concentration limits and tighter covenants are key to risk control.

Labor market and SMB health
Employment trends drive consumer deposits and SMB credit demand; US unemployment stood at 3.7% in June 2025, supporting deposit flows while small business loan demand rose about 5–7% in 2024 as firms rebuilt working capital. Wage pressures—average hourly earnings up ~4% year‑over‑year in 2024—increase client operating costs and line usage. Recession risk would lift delinquencies across consumer and business books, so diversifying sectors and tightening underwriting bolster resilience.

Deposit competition
Money-market funds and large banks have bid aggressively for rate-sensitive deposits as policy rates sat near 5.25–5.50% in 2024–25, intensifying competition for short-term balances.
Community banks like Kearny face higher funding costs and runoff risk, pressuring NIMs and liquidity metrics amid elevated market yields.
Relationship-based treasury services can defend balances, while strict pricing discipline and targeted promotions help optimize deposit mix and cost.
- Market rates: fed funds 5.25–5.50% (2024–25)
- MMF competition: MMFs >5 trillion USD in 2024
- Defense: treasury services, pricing discipline, targeted promos
Housing affordability
In NY/NJ tight inventory (about 2.5–3 months supply in 2024) and elevated 30-year rates (~6.8% mid-2025) have weighed on originations and kept refis below 20% of originations, boosting demand for ARMs, first-time buyer and down-payment programs; construction/renovation loans track local permits and rising material/labor costs, while prudent LTV limits preserve collateral quality.
- Inventory: 2.5–3 months (2024)
- 30y rate: ~6.8% (mid-2025)
- Refi share: <20% (2024)
- Demand: ARMs & assistance programs ↑
- Risk control: conservative LTVs
NY/NJ policy and budget timing plus CRA changes boost CRE and contractor lending demand
Fed rates ~5.25–5.50% (mid‑2025) lift funding costs; deposit betas 30–50% and MMF competition (>5T USD in 2024) compress NIMs. CRE stress in NY/NJ (Manhattan office ~18% vacancy) raises credit risk; industrial/multifamily remain resilient. Housing originations suppressed by 30y ~6.8% (mid‑2025); mortgage prepay ~20–30% CPR post‑cuts.
| Metric | Value |
|---|---|
| Fed funds | 5.25–5.50% |
| Unemployment | 3.7% (Jun 2025) |
| 30y rate | ~6.8% (mid‑2025) |
| Manhattan office | ~18% vacancy (2024) |
What You See Is What You Get
Kearny Bank PESTLE Analysis
The Kearny Bank PESTLE Analysis preview shown here is the exact document you’ll receive after purchase—fully formatted and ready to use. The layout, content, and structure visible are exactly what you’ll download immediately after buying. No placeholders, no surprises.

Make Smarter Strategic Decisions with a Complete PESTEL View
Discover how political shifts, economic cycles, regulatory change, social trends, technological disruption, and environmental risks are reshaping Kearny Bank’s strategic outlook. Our concise PESTLE highlights the forces that matter to investors and executives. Purchase the full analysis to access actionable insights and an editable, board-ready report instantly.
Political factors
State-level banking posture
New Jersey and New York policymakers shape community bank priorities via regional development and housing agendas, influencing demand for affordable housing and small business lending. The two states hold a combined population of about 29.1 million, driving sizable local credit needs. New York’s fiscal year begins April 1 and New Jersey’s July 1, so Kearny Bank must track legislative calendars, budget cycles and public–private programs closely.
Municipal relationships
Local governments in New Jersey, which has 565 municipalities and ~9.3 million residents (2024 est.), control permitting, zoning and public deposit placement that shape Kearny Bank branch siting and loan pipelines. Participation in municipal lending or depository programs can deepen market access; shifts in procurement rules or collateral requirements can squeeze margins. Active stakeholder engagement sustains visibility and trust.
Federal policy direction
Executive priorities on consumer protection, housing finance, and financial stability shape supervisory tone and drive heightened examinations and guidance affecting Kearny Bank. Appointments at the FDIC, OCC, and CFPB shift rulemaking emphasis and timing, increasing compliance costs and planning uncertainty around election cycles. Changes in GSE policy — FHFA set the 2024 conforming loan limit at 766,550 — directly affect mortgage underwriting and pricing. Political cycles amplify timing risk for strategic decisions.
Infrastructure and transit funding
- Policy drivers: Bipartisan Infrastructure Law $1.2T
- Regional programs: MTA $51.5B; NJ TRANSIT $16B
- Risk: delayed drawdowns reduce utilization
- Opportunity: align pipelines with funded corridors
Community reinvestment expectations
Proactive outreach, community impact lending and deposit products reduce regulatory and reputational risk.
- May 2024 CRA rule: stronger data & geographies
- Transparency: branch deserts & fair access
- Ratings tied to qualitative + quantitative tests
- Mitigation: outreach & impact products
NY/NJ policy and budget timing plus CRA changes boost CRE and contractor lending demand
NY/NJ policy (pop 29.1M; NJ 9.3M) shapes demand for housing, small‑business and municipal lending; NY budget Apr 1, NJ Jul 1 affect program timing. May 2024 CRA revisions, FDIC/CFPB shifts and 2024 conforming limit $766,550 raise compliance costs. Infrastructure funding ($1.2T BIL; MTA $51.5B; NJT $16B) creates CRE and contractor lending opportunities.
| Metric | Value |
|---|---|
| Region pop | 29.1M |
| NJ pop | 9.3M |
| Conforming (2024) | $766,550 |
| Infrastructure | $1.2T; MTA $51.5B; NJT $16B |
What is included in the product
Detailed Word Document
Explores how Political, Economic, Social, Technological, Environmental and Legal forces uniquely affect Kearny Bank, with data-backed trends, forward-looking scenario insights, and actionable implications to help executives, consultants and investors identify risks, opportunities and strategy-ready recommendations for reports and decks.
Customizable Excel Spreadsheet
A concise, visually segmented PESTLE summary for Kearny Bank that distills regulatory, economic, social, technological, environmental, and legal risks into an editable, presentation-ready snapshot. Easily shared and annotated for quick alignment across teams and planning sessions.
Economic factors
Interest rate cycle
Net interest margin at Kearny Bank is driven by Fed policy (effective funds ~5.25–5.50% mid‑2025), deposit betas commonly 30–50% and asset repricing speed; a steepening Treasury curve supports term lending while inversion compresses spreads. Mortgage prepayment speeds have risen to ~20–30% CPR after rate cuts, shifting fee income and shortening duration. Robust balance sheet hedging (swaps, caps) is critical to stabilize earnings.
Regional CRE dynamics
NJ/NY office and retail fundamentals—Manhattan office vacancy ~18% in 2024—erode credit performance and valuations. Higher vacancies and roughly 150–250 bps cap‑rate expansion since 2021 pressure DSCR and refinancing outcomes. Industrial vacancy ~4–5% and multifamily ~3–4% remain relatively resilient but rate‑sensitive. Concentration limits and tighter covenants are key to risk control.
Labor market and SMB health
Employment trends drive consumer deposits and SMB credit demand; US unemployment stood at 3.7% in June 2025, supporting deposit flows while small business loan demand rose about 5–7% in 2024 as firms rebuilt working capital. Wage pressures—average hourly earnings up ~4% year‑over‑year in 2024—increase client operating costs and line usage. Recession risk would lift delinquencies across consumer and business books, so diversifying sectors and tightening underwriting bolster resilience.
Deposit competition
Money-market funds and large banks have bid aggressively for rate-sensitive deposits as policy rates sat near 5.25–5.50% in 2024–25, intensifying competition for short-term balances.
Community banks like Kearny face higher funding costs and runoff risk, pressuring NIMs and liquidity metrics amid elevated market yields.
Relationship-based treasury services can defend balances, while strict pricing discipline and targeted promotions help optimize deposit mix and cost.
- Market rates: fed funds 5.25–5.50% (2024–25)
- MMF competition: MMFs >5 trillion USD in 2024
- Defense: treasury services, pricing discipline, targeted promos
Housing affordability
In NY/NJ tight inventory (about 2.5–3 months supply in 2024) and elevated 30-year rates (~6.8% mid-2025) have weighed on originations and kept refis below 20% of originations, boosting demand for ARMs, first-time buyer and down-payment programs; construction/renovation loans track local permits and rising material/labor costs, while prudent LTV limits preserve collateral quality.
- Inventory: 2.5–3 months (2024)
- 30y rate: ~6.8% (mid-2025)
- Refi share: <20% (2024)
- Demand: ARMs & assistance programs ↑
- Risk control: conservative LTVs
NY/NJ policy and budget timing plus CRA changes boost CRE and contractor lending demand
Fed rates ~5.25–5.50% (mid‑2025) lift funding costs; deposit betas 30–50% and MMF competition (>5T USD in 2024) compress NIMs. CRE stress in NY/NJ (Manhattan office ~18% vacancy) raises credit risk; industrial/multifamily remain resilient. Housing originations suppressed by 30y ~6.8% (mid‑2025); mortgage prepay ~20–30% CPR post‑cuts.
| Metric | Value |
|---|---|
| Fed funds | 5.25–5.50% |
| Unemployment | 3.7% (Jun 2025) |
| 30y rate | ~6.8% (mid‑2025) |
| Manhattan office | ~18% vacancy (2024) |
What You See Is What You Get
Kearny Bank PESTLE Analysis
The Kearny Bank PESTLE Analysis preview shown here is the exact document you’ll receive after purchase—fully formatted and ready to use. The layout, content, and structure visible are exactly what you’ll download immediately after buying. No placeholders, no surprises.
Original: $10.00
-65%$10.00
$3.50Description
Make Smarter Strategic Decisions with a Complete PESTEL View
Discover how political shifts, economic cycles, regulatory change, social trends, technological disruption, and environmental risks are reshaping Kearny Bank’s strategic outlook. Our concise PESTLE highlights the forces that matter to investors and executives. Purchase the full analysis to access actionable insights and an editable, board-ready report instantly.
Political factors
State-level banking posture
New Jersey and New York policymakers shape community bank priorities via regional development and housing agendas, influencing demand for affordable housing and small business lending. The two states hold a combined population of about 29.1 million, driving sizable local credit needs. New York’s fiscal year begins April 1 and New Jersey’s July 1, so Kearny Bank must track legislative calendars, budget cycles and public–private programs closely.
Municipal relationships
Local governments in New Jersey, which has 565 municipalities and ~9.3 million residents (2024 est.), control permitting, zoning and public deposit placement that shape Kearny Bank branch siting and loan pipelines. Participation in municipal lending or depository programs can deepen market access; shifts in procurement rules or collateral requirements can squeeze margins. Active stakeholder engagement sustains visibility and trust.
Federal policy direction
Executive priorities on consumer protection, housing finance, and financial stability shape supervisory tone and drive heightened examinations and guidance affecting Kearny Bank. Appointments at the FDIC, OCC, and CFPB shift rulemaking emphasis and timing, increasing compliance costs and planning uncertainty around election cycles. Changes in GSE policy — FHFA set the 2024 conforming loan limit at 766,550 — directly affect mortgage underwriting and pricing. Political cycles amplify timing risk for strategic decisions.
Infrastructure and transit funding
- Policy drivers: Bipartisan Infrastructure Law $1.2T
- Regional programs: MTA $51.5B; NJ TRANSIT $16B
- Risk: delayed drawdowns reduce utilization
- Opportunity: align pipelines with funded corridors
Community reinvestment expectations
Proactive outreach, community impact lending and deposit products reduce regulatory and reputational risk.
- May 2024 CRA rule: stronger data & geographies
- Transparency: branch deserts & fair access
- Ratings tied to qualitative + quantitative tests
- Mitigation: outreach & impact products
NY/NJ policy and budget timing plus CRA changes boost CRE and contractor lending demand
NY/NJ policy (pop 29.1M; NJ 9.3M) shapes demand for housing, small‑business and municipal lending; NY budget Apr 1, NJ Jul 1 affect program timing. May 2024 CRA revisions, FDIC/CFPB shifts and 2024 conforming limit $766,550 raise compliance costs. Infrastructure funding ($1.2T BIL; MTA $51.5B; NJT $16B) creates CRE and contractor lending opportunities.
| Metric | Value |
|---|---|
| Region pop | 29.1M |
| NJ pop | 9.3M |
| Conforming (2024) | $766,550 |
| Infrastructure | $1.2T; MTA $51.5B; NJT $16B |
What is included in the product
Detailed Word Document
Explores how Political, Economic, Social, Technological, Environmental and Legal forces uniquely affect Kearny Bank, with data-backed trends, forward-looking scenario insights, and actionable implications to help executives, consultants and investors identify risks, opportunities and strategy-ready recommendations for reports and decks.
Customizable Excel Spreadsheet
A concise, visually segmented PESTLE summary for Kearny Bank that distills regulatory, economic, social, technological, environmental, and legal risks into an editable, presentation-ready snapshot. Easily shared and annotated for quick alignment across teams and planning sessions.
Economic factors
Interest rate cycle
Net interest margin at Kearny Bank is driven by Fed policy (effective funds ~5.25–5.50% mid‑2025), deposit betas commonly 30–50% and asset repricing speed; a steepening Treasury curve supports term lending while inversion compresses spreads. Mortgage prepayment speeds have risen to ~20–30% CPR after rate cuts, shifting fee income and shortening duration. Robust balance sheet hedging (swaps, caps) is critical to stabilize earnings.
Regional CRE dynamics
NJ/NY office and retail fundamentals—Manhattan office vacancy ~18% in 2024—erode credit performance and valuations. Higher vacancies and roughly 150–250 bps cap‑rate expansion since 2021 pressure DSCR and refinancing outcomes. Industrial vacancy ~4–5% and multifamily ~3–4% remain relatively resilient but rate‑sensitive. Concentration limits and tighter covenants are key to risk control.
Labor market and SMB health
Employment trends drive consumer deposits and SMB credit demand; US unemployment stood at 3.7% in June 2025, supporting deposit flows while small business loan demand rose about 5–7% in 2024 as firms rebuilt working capital. Wage pressures—average hourly earnings up ~4% year‑over‑year in 2024—increase client operating costs and line usage. Recession risk would lift delinquencies across consumer and business books, so diversifying sectors and tightening underwriting bolster resilience.
Deposit competition
Money-market funds and large banks have bid aggressively for rate-sensitive deposits as policy rates sat near 5.25–5.50% in 2024–25, intensifying competition for short-term balances.
Community banks like Kearny face higher funding costs and runoff risk, pressuring NIMs and liquidity metrics amid elevated market yields.
Relationship-based treasury services can defend balances, while strict pricing discipline and targeted promotions help optimize deposit mix and cost.
- Market rates: fed funds 5.25–5.50% (2024–25)
- MMF competition: MMFs >5 trillion USD in 2024
- Defense: treasury services, pricing discipline, targeted promos
Housing affordability
In NY/NJ tight inventory (about 2.5–3 months supply in 2024) and elevated 30-year rates (~6.8% mid-2025) have weighed on originations and kept refis below 20% of originations, boosting demand for ARMs, first-time buyer and down-payment programs; construction/renovation loans track local permits and rising material/labor costs, while prudent LTV limits preserve collateral quality.
- Inventory: 2.5–3 months (2024)
- 30y rate: ~6.8% (mid-2025)
- Refi share: <20% (2024)
- Demand: ARMs & assistance programs ↑
- Risk control: conservative LTVs
NY/NJ policy and budget timing plus CRA changes boost CRE and contractor lending demand
Fed rates ~5.25–5.50% (mid‑2025) lift funding costs; deposit betas 30–50% and MMF competition (>5T USD in 2024) compress NIMs. CRE stress in NY/NJ (Manhattan office ~18% vacancy) raises credit risk; industrial/multifamily remain resilient. Housing originations suppressed by 30y ~6.8% (mid‑2025); mortgage prepay ~20–30% CPR post‑cuts.
| Metric | Value |
|---|---|
| Fed funds | 5.25–5.50% |
| Unemployment | 3.7% (Jun 2025) |
| 30y rate | ~6.8% (mid‑2025) |
| Manhattan office | ~18% vacancy (2024) |
What You See Is What You Get
Kearny Bank PESTLE Analysis
The Kearny Bank PESTLE Analysis preview shown here is the exact document you’ll receive after purchase—fully formatted and ready to use. The layout, content, and structure visible are exactly what you’ll download immediately after buying. No placeholders, no surprises.











