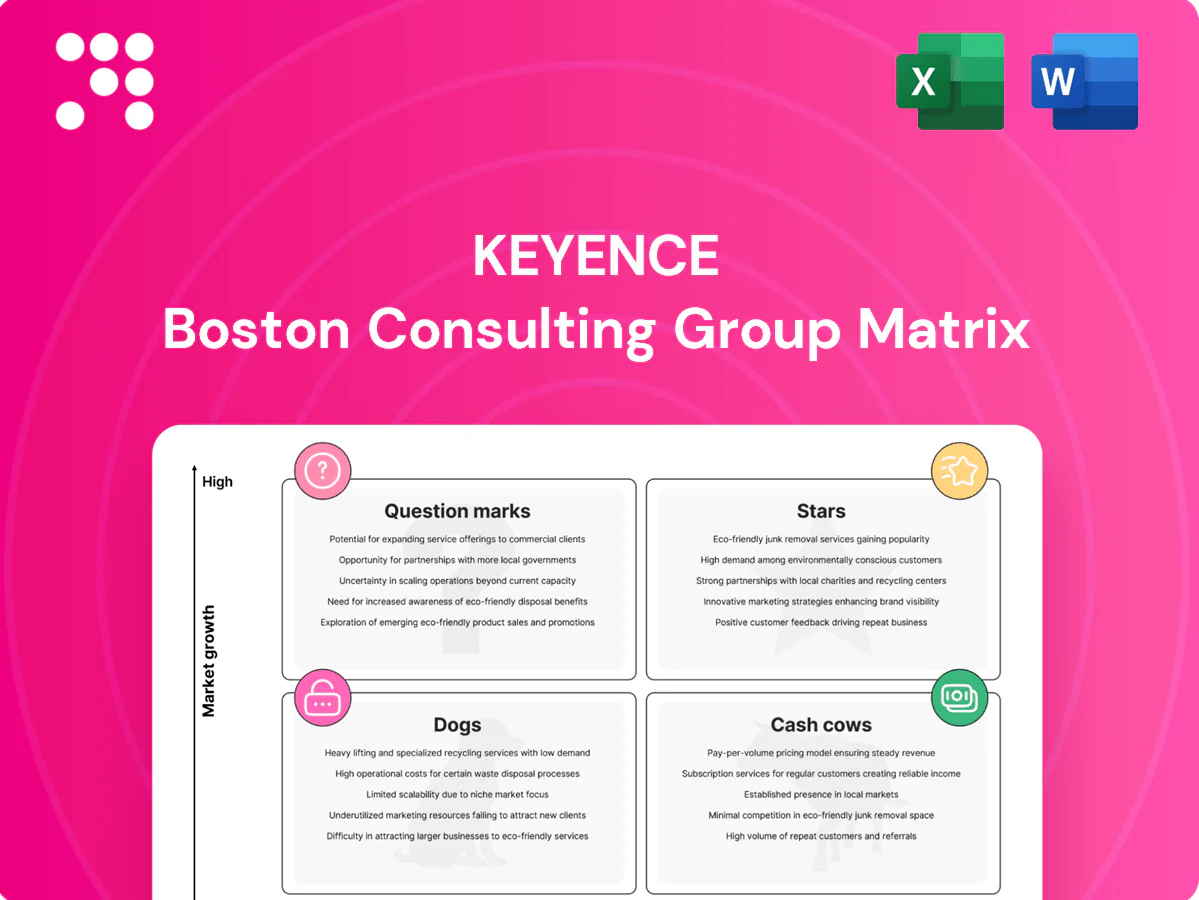
Keyence Boston Consulting Group Matrix

Visual. Strategic. Downloadable.
Want a fast, no-nonsense view of Keyence’s product portfolio—what’s a Star, Cash Cow, Dog, or Question Mark—and what to do next? This preview scratches the surface; buy the full BCG Matrix for quadrant-by-quadrant placements, actionable recommendations, and clear investment priorities. You’ll get a ready-to-use Word report plus an Excel summary so you can present and execute without extra work. Purchase now for the strategic clarity your next board meeting needs.
Stars

Machine vision systems (smart cameras & controllers)
Keyence’s machine vision systems sit in the BCG Stars quadrant with high share in a global machine vision market of about $12 billion in 2024, riding the surge in automated inspection. The vision stack wins on ease-of-use and rapid deployment, keeping conversion and attach rates elevated. Growth is driven by added checks in EV, electronics and pharma lines. Continued gains hinge on software, AI add-ons and vertical templates.
Code readers & end‑to‑end traceability
2D/1D readers plus verification tools are now mission‑critical on modern lines as 2024 regulatory and recall pressures (eg DSCSA, EU traceability rules) push full traceability. Keyence’s proven high read rates and rugged hardware lead in complex marks and tough environments. Invest to lock in Keyence ecosystems across plant networks, not single workcells, to maximize uptime and traceability value.

Laser markers for in‑line identification
By 2024, serialization mandates such as the US DSCSA and EU FMD have pushed marking demand sharply higher, making laser markers a strategic Star in Keyence's portfolio.
Fiber laser systems, with micron-level precision and robust uptime, match high-speed, high-mix lines—Keyence targets this sweet spot to capture premium margins.
Tight integration of marking with vision/verification loops raises switching costs by embedding traceability into MES/QA, while expanded application libraries and turnkey cells accelerate adoption on customer floors.

2D/3D profilers & high‑speed displacement for inline QA
2D/3D profilers and high-speed displacement sensors are Stars in Keyence’s BCG matrix as surface, gap/flush and profile inspection demand surges across EV, battery and semiconductor tooling; Keyence systems commission quickly and maintain stability at line speeds, winning large program shares as manufacturers scale globally. Prioritize 3D and materials that are black, glossy or have micro-features to sustain growth.
- High line-speed stability
- Fast commissioning
- Focus: 3D & challenging materials
- Strong program share in EV/semiconductor
Digital microscopes & imaging platforms
QA labs and production cells are standardizing on digital over optical, with the global digital microscope market estimated at about $1.1B in 2024 and adoption in high-tech QA exceeding 50% as failure analysis moves upstream; Keyence’s anyone-can-measure UX accelerates multi-site rollouts and brings measurement closer to the line, increasing per-site utilization and service stickiness.
- Standardization: digital > optical in QA
- UX: anyone-can-measure drives multi-site deployments
- Usage: failure analysis shifting to line increases frequency
- Strategy: bundle analytics/reporting to lock enterprise standards
AI-powered machine vision drives $12B market - serialization, EV, QA gains
Keyence Stars: machine vision sits in a ~$12B 2024 market, winning on ease-of-use, rapid deployment and AI-enabled inspection; 2D/1D readers and laser markers benefit from 2024 serialization mandates (US DSCSA, EU FMD). 3D profilers and displacement sensors capture EV/semiconductor program share; digital microscopes address a ~$1.1B 2024 QA market.
| Product | 2024 Market | Role |
|---|---|---|
| Machine vision | $12B | High share, rapid growth |
| Digital microscope | $1.1B | Line-side QA adoption |
What is included in the product
 Detailed Word Document
Concise BCG Matrix view of Keyence products: Stars, Cash Cows, Question Marks, Dogs with investment and divestment guidance.

 Customizable Excel Spreadsheet
One-page Keyence BCG matrix that pinpoints pain areas and prescribes focus—clean, export-ready for C-level decks.
Cash Cows

Photoelectric, proximity, and inductive sensors
Photoelectric, proximity, and inductive sensors are classic detection workhorses in a mature, repeat‑buy market where global industrial sensors were roughly $20 billion in 2024 with a ~6% CAGR. Volumes are high and engineering support is light, enabling Keyence to sustain healthy unit economics; sensor margins for leading suppliers typically run in the 30–40% range. Brand trust and reliability keep replacement cycles steady, so milking with incremental SKUs and logistics excellence drives outsized cash flow.
Safety light curtains and area scanners
Safety light curtains and area scanners are classic cash cows for Keyence: stable replacement cycles and sticky safety certifications sustain a strong installed base, supporting recurring service and parts revenue; Keyence reported an operating margin near 40% in FY2024. Integration is routine, not a heavy lift, enabling widespread OEM fitment. Cash‑rich balance sheet funds modest promotional spend (≈1.5% of sales) while priorities remain: maintain approvals, simplify wiring, and protect price.

Instant measurement systems and optical comparators
Instant measurement systems and optical comparators sit in a mature metrology category where Keyence owns the speed + simplicity niche, underpinning steady upgrade and expansion orders; Keyence reported annual sales exceeding 700 billion JPY in FY2023 supporting cash-rich operations. Service contracts and training add tidy recurring margin, while optimizing manufacturing cost, refreshing UI and sustaining share keep the franchise high-return and resilient.

Conventional 1D displacement and confocal sensors
Conventional 1D displacement and confocal sensors remain cash cows for Keyence, delivering precision checks amid ~4% market growth in 2024 and generating high-margin, repeat revenue from long-term standardized lines; installed-base repeat rates exceed 60%, keeping churn low despite competition and meaningful switching pain for customers.
- Hold price
- Streamline variants
- Improve lead times
Gauging heads, counters, and panel instruments
Gauging heads, counters and panel instruments are classic cash cows for Keyence: low-growth, widely deployed, and dependable, with buyers tending to replace rather than re‑spec, driving steady unit sales and predictable support revenue.
Support costs and spare‑parts margins remain stable, delivering solid cash flow that prioritizes availability and service over heavy R&D investment; typical replacement cycles run about 5–10 years.
- Low growth, high penetration
- Replacement-driven demand
- Predictable support costs
- Focus on service/availability
Sensors & instruments: ≈40% operating margin, >700B JPY sales, 4-6% market growth
Keyence cash cows—sensors, safety curtains, instant measurement and panel instruments—deliver high-margin, repeat revenue in low-growth (~4–6% market growth in 2024) segments; installed-base replacement cycles typically 5–10 years. FY2024 operating margin near 40% and group scale (sales >700 billion JPY FY2023) support strong cash generation and low promotional spend (~1.5% of sales).
| Metric | Value |
|---|---|
| Market size (2024) | $20B (industrial sensors) |
| Market CAGR | 4–6% |
| Keyence OM (FY2024) | ≈40% |
| Keyence sales | >700B JPY (FY2023) |
Preview = Final Product
Keyence BCG Matrix
The file you're previewing is the exact Keyence BCG Matrix report you'll receive after purchase—no watermarks, no demo content, just the final, fully formatted document. Built by strategy pros for quick decision-making, it's ready to edit, print, or include in presentations. Purchase unlocks an immediate download sent straight to your inbox. No surprises—just a plug-and-play strategic tool.

Visual. Strategic. Downloadable.
Want a fast, no-nonsense view of Keyence’s product portfolio—what’s a Star, Cash Cow, Dog, or Question Mark—and what to do next? This preview scratches the surface; buy the full BCG Matrix for quadrant-by-quadrant placements, actionable recommendations, and clear investment priorities. You’ll get a ready-to-use Word report plus an Excel summary so you can present and execute without extra work. Purchase now for the strategic clarity your next board meeting needs.
Stars
Machine vision systems (smart cameras & controllers)
Keyence’s machine vision systems sit in the BCG Stars quadrant with high share in a global machine vision market of about $12 billion in 2024, riding the surge in automated inspection. The vision stack wins on ease-of-use and rapid deployment, keeping conversion and attach rates elevated. Growth is driven by added checks in EV, electronics and pharma lines. Continued gains hinge on software, AI add-ons and vertical templates.
Code readers & end‑to‑end traceability
2D/1D readers plus verification tools are now mission‑critical on modern lines as 2024 regulatory and recall pressures (eg DSCSA, EU traceability rules) push full traceability. Keyence’s proven high read rates and rugged hardware lead in complex marks and tough environments. Invest to lock in Keyence ecosystems across plant networks, not single workcells, to maximize uptime and traceability value.
Laser markers for in‑line identification
By 2024, serialization mandates such as the US DSCSA and EU FMD have pushed marking demand sharply higher, making laser markers a strategic Star in Keyence's portfolio.
Fiber laser systems, with micron-level precision and robust uptime, match high-speed, high-mix lines—Keyence targets this sweet spot to capture premium margins.
Tight integration of marking with vision/verification loops raises switching costs by embedding traceability into MES/QA, while expanded application libraries and turnkey cells accelerate adoption on customer floors.
2D/3D profilers & high‑speed displacement for inline QA
2D/3D profilers and high-speed displacement sensors are Stars in Keyence’s BCG matrix as surface, gap/flush and profile inspection demand surges across EV, battery and semiconductor tooling; Keyence systems commission quickly and maintain stability at line speeds, winning large program shares as manufacturers scale globally. Prioritize 3D and materials that are black, glossy or have micro-features to sustain growth.
- High line-speed stability
- Fast commissioning
- Focus: 3D & challenging materials
- Strong program share in EV/semiconductor
Digital microscopes & imaging platforms
QA labs and production cells are standardizing on digital over optical, with the global digital microscope market estimated at about $1.1B in 2024 and adoption in high-tech QA exceeding 50% as failure analysis moves upstream; Keyence’s anyone-can-measure UX accelerates multi-site rollouts and brings measurement closer to the line, increasing per-site utilization and service stickiness.
- Standardization: digital > optical in QA
- UX: anyone-can-measure drives multi-site deployments
- Usage: failure analysis shifting to line increases frequency
- Strategy: bundle analytics/reporting to lock enterprise standards
AI-powered machine vision drives $12B market - serialization, EV, QA gains
Keyence Stars: machine vision sits in a ~$12B 2024 market, winning on ease-of-use, rapid deployment and AI-enabled inspection; 2D/1D readers and laser markers benefit from 2024 serialization mandates (US DSCSA, EU FMD). 3D profilers and displacement sensors capture EV/semiconductor program share; digital microscopes address a ~$1.1B 2024 QA market.
| Product | 2024 Market | Role |
|---|---|---|
| Machine vision | $12B | High share, rapid growth |
| Digital microscope | $1.1B | Line-side QA adoption |
What is included in the product
Detailed Word Document
Concise BCG Matrix view of Keyence products: Stars, Cash Cows, Question Marks, Dogs with investment and divestment guidance.
Customizable Excel Spreadsheet
One-page Keyence BCG matrix that pinpoints pain areas and prescribes focus—clean, export-ready for C-level decks.
Cash Cows
Photoelectric, proximity, and inductive sensors
Photoelectric, proximity, and inductive sensors are classic detection workhorses in a mature, repeat‑buy market where global industrial sensors were roughly $20 billion in 2024 with a ~6% CAGR. Volumes are high and engineering support is light, enabling Keyence to sustain healthy unit economics; sensor margins for leading suppliers typically run in the 30–40% range. Brand trust and reliability keep replacement cycles steady, so milking with incremental SKUs and logistics excellence drives outsized cash flow.
Safety light curtains and area scanners
Safety light curtains and area scanners are classic cash cows for Keyence: stable replacement cycles and sticky safety certifications sustain a strong installed base, supporting recurring service and parts revenue; Keyence reported an operating margin near 40% in FY2024. Integration is routine, not a heavy lift, enabling widespread OEM fitment. Cash‑rich balance sheet funds modest promotional spend (≈1.5% of sales) while priorities remain: maintain approvals, simplify wiring, and protect price.
Instant measurement systems and optical comparators
Instant measurement systems and optical comparators sit in a mature metrology category where Keyence owns the speed + simplicity niche, underpinning steady upgrade and expansion orders; Keyence reported annual sales exceeding 700 billion JPY in FY2023 supporting cash-rich operations. Service contracts and training add tidy recurring margin, while optimizing manufacturing cost, refreshing UI and sustaining share keep the franchise high-return and resilient.
Conventional 1D displacement and confocal sensors
Conventional 1D displacement and confocal sensors remain cash cows for Keyence, delivering precision checks amid ~4% market growth in 2024 and generating high-margin, repeat revenue from long-term standardized lines; installed-base repeat rates exceed 60%, keeping churn low despite competition and meaningful switching pain for customers.
- Hold price
- Streamline variants
- Improve lead times
Gauging heads, counters, and panel instruments
Gauging heads, counters and panel instruments are classic cash cows for Keyence: low-growth, widely deployed, and dependable, with buyers tending to replace rather than re‑spec, driving steady unit sales and predictable support revenue.
Support costs and spare‑parts margins remain stable, delivering solid cash flow that prioritizes availability and service over heavy R&D investment; typical replacement cycles run about 5–10 years.
- Low growth, high penetration
- Replacement-driven demand
- Predictable support costs
- Focus on service/availability
Sensors & instruments: ≈40% operating margin, >700B JPY sales, 4-6% market growth
Keyence cash cows—sensors, safety curtains, instant measurement and panel instruments—deliver high-margin, repeat revenue in low-growth (~4–6% market growth in 2024) segments; installed-base replacement cycles typically 5–10 years. FY2024 operating margin near 40% and group scale (sales >700 billion JPY FY2023) support strong cash generation and low promotional spend (~1.5% of sales).
| Metric | Value |
|---|---|
| Market size (2024) | $20B (industrial sensors) |
| Market CAGR | 4–6% |
| Keyence OM (FY2024) | ≈40% |
| Keyence sales | >700B JPY (FY2023) |
Preview = Final Product
Keyence BCG Matrix
The file you're previewing is the exact Keyence BCG Matrix report you'll receive after purchase—no watermarks, no demo content, just the final, fully formatted document. Built by strategy pros for quick decision-making, it's ready to edit, print, or include in presentations. Purchase unlocks an immediate download sent straight to your inbox. No surprises—just a plug-and-play strategic tool.
Description
Visual. Strategic. Downloadable.
Want a fast, no-nonsense view of Keyence’s product portfolio—what’s a Star, Cash Cow, Dog, or Question Mark—and what to do next? This preview scratches the surface; buy the full BCG Matrix for quadrant-by-quadrant placements, actionable recommendations, and clear investment priorities. You’ll get a ready-to-use Word report plus an Excel summary so you can present and execute without extra work. Purchase now for the strategic clarity your next board meeting needs.
Stars
Machine vision systems (smart cameras & controllers)
Keyence’s machine vision systems sit in the BCG Stars quadrant with high share in a global machine vision market of about $12 billion in 2024, riding the surge in automated inspection. The vision stack wins on ease-of-use and rapid deployment, keeping conversion and attach rates elevated. Growth is driven by added checks in EV, electronics and pharma lines. Continued gains hinge on software, AI add-ons and vertical templates.
Code readers & end‑to‑end traceability
2D/1D readers plus verification tools are now mission‑critical on modern lines as 2024 regulatory and recall pressures (eg DSCSA, EU traceability rules) push full traceability. Keyence’s proven high read rates and rugged hardware lead in complex marks and tough environments. Invest to lock in Keyence ecosystems across plant networks, not single workcells, to maximize uptime and traceability value.
Laser markers for in‑line identification
By 2024, serialization mandates such as the US DSCSA and EU FMD have pushed marking demand sharply higher, making laser markers a strategic Star in Keyence's portfolio.
Fiber laser systems, with micron-level precision and robust uptime, match high-speed, high-mix lines—Keyence targets this sweet spot to capture premium margins.
Tight integration of marking with vision/verification loops raises switching costs by embedding traceability into MES/QA, while expanded application libraries and turnkey cells accelerate adoption on customer floors.
2D/3D profilers & high‑speed displacement for inline QA
2D/3D profilers and high-speed displacement sensors are Stars in Keyence’s BCG matrix as surface, gap/flush and profile inspection demand surges across EV, battery and semiconductor tooling; Keyence systems commission quickly and maintain stability at line speeds, winning large program shares as manufacturers scale globally. Prioritize 3D and materials that are black, glossy or have micro-features to sustain growth.
- High line-speed stability
- Fast commissioning
- Focus: 3D & challenging materials
- Strong program share in EV/semiconductor
Digital microscopes & imaging platforms
QA labs and production cells are standardizing on digital over optical, with the global digital microscope market estimated at about $1.1B in 2024 and adoption in high-tech QA exceeding 50% as failure analysis moves upstream; Keyence’s anyone-can-measure UX accelerates multi-site rollouts and brings measurement closer to the line, increasing per-site utilization and service stickiness.
- Standardization: digital > optical in QA
- UX: anyone-can-measure drives multi-site deployments
- Usage: failure analysis shifting to line increases frequency
- Strategy: bundle analytics/reporting to lock enterprise standards
AI-powered machine vision drives $12B market - serialization, EV, QA gains
Keyence Stars: machine vision sits in a ~$12B 2024 market, winning on ease-of-use, rapid deployment and AI-enabled inspection; 2D/1D readers and laser markers benefit from 2024 serialization mandates (US DSCSA, EU FMD). 3D profilers and displacement sensors capture EV/semiconductor program share; digital microscopes address a ~$1.1B 2024 QA market.
| Product | 2024 Market | Role |
|---|---|---|
| Machine vision | $12B | High share, rapid growth |
| Digital microscope | $1.1B | Line-side QA adoption |
What is included in the product
Detailed Word Document
Concise BCG Matrix view of Keyence products: Stars, Cash Cows, Question Marks, Dogs with investment and divestment guidance.
Customizable Excel Spreadsheet
One-page Keyence BCG matrix that pinpoints pain areas and prescribes focus—clean, export-ready for C-level decks.
Cash Cows
Photoelectric, proximity, and inductive sensors
Photoelectric, proximity, and inductive sensors are classic detection workhorses in a mature, repeat‑buy market where global industrial sensors were roughly $20 billion in 2024 with a ~6% CAGR. Volumes are high and engineering support is light, enabling Keyence to sustain healthy unit economics; sensor margins for leading suppliers typically run in the 30–40% range. Brand trust and reliability keep replacement cycles steady, so milking with incremental SKUs and logistics excellence drives outsized cash flow.
Safety light curtains and area scanners
Safety light curtains and area scanners are classic cash cows for Keyence: stable replacement cycles and sticky safety certifications sustain a strong installed base, supporting recurring service and parts revenue; Keyence reported an operating margin near 40% in FY2024. Integration is routine, not a heavy lift, enabling widespread OEM fitment. Cash‑rich balance sheet funds modest promotional spend (≈1.5% of sales) while priorities remain: maintain approvals, simplify wiring, and protect price.
Instant measurement systems and optical comparators
Instant measurement systems and optical comparators sit in a mature metrology category where Keyence owns the speed + simplicity niche, underpinning steady upgrade and expansion orders; Keyence reported annual sales exceeding 700 billion JPY in FY2023 supporting cash-rich operations. Service contracts and training add tidy recurring margin, while optimizing manufacturing cost, refreshing UI and sustaining share keep the franchise high-return and resilient.
Conventional 1D displacement and confocal sensors
Conventional 1D displacement and confocal sensors remain cash cows for Keyence, delivering precision checks amid ~4% market growth in 2024 and generating high-margin, repeat revenue from long-term standardized lines; installed-base repeat rates exceed 60%, keeping churn low despite competition and meaningful switching pain for customers.
- Hold price
- Streamline variants
- Improve lead times
Gauging heads, counters, and panel instruments
Gauging heads, counters and panel instruments are classic cash cows for Keyence: low-growth, widely deployed, and dependable, with buyers tending to replace rather than re‑spec, driving steady unit sales and predictable support revenue.
Support costs and spare‑parts margins remain stable, delivering solid cash flow that prioritizes availability and service over heavy R&D investment; typical replacement cycles run about 5–10 years.
- Low growth, high penetration
- Replacement-driven demand
- Predictable support costs
- Focus on service/availability
Sensors & instruments: ≈40% operating margin, >700B JPY sales, 4-6% market growth
Keyence cash cows—sensors, safety curtains, instant measurement and panel instruments—deliver high-margin, repeat revenue in low-growth (~4–6% market growth in 2024) segments; installed-base replacement cycles typically 5–10 years. FY2024 operating margin near 40% and group scale (sales >700 billion JPY FY2023) support strong cash generation and low promotional spend (~1.5% of sales).
| Metric | Value |
|---|---|
| Market size (2024) | $20B (industrial sensors) |
| Market CAGR | 4–6% |
| Keyence OM (FY2024) | ≈40% |
| Keyence sales | >700B JPY (FY2023) |
Preview = Final Product
Keyence BCG Matrix
The file you're previewing is the exact Keyence BCG Matrix report you'll receive after purchase—no watermarks, no demo content, just the final, fully formatted document. Built by strategy pros for quick decision-making, it's ready to edit, print, or include in presentations. Purchase unlocks an immediate download sent straight to your inbox. No surprises—just a plug-and-play strategic tool.











