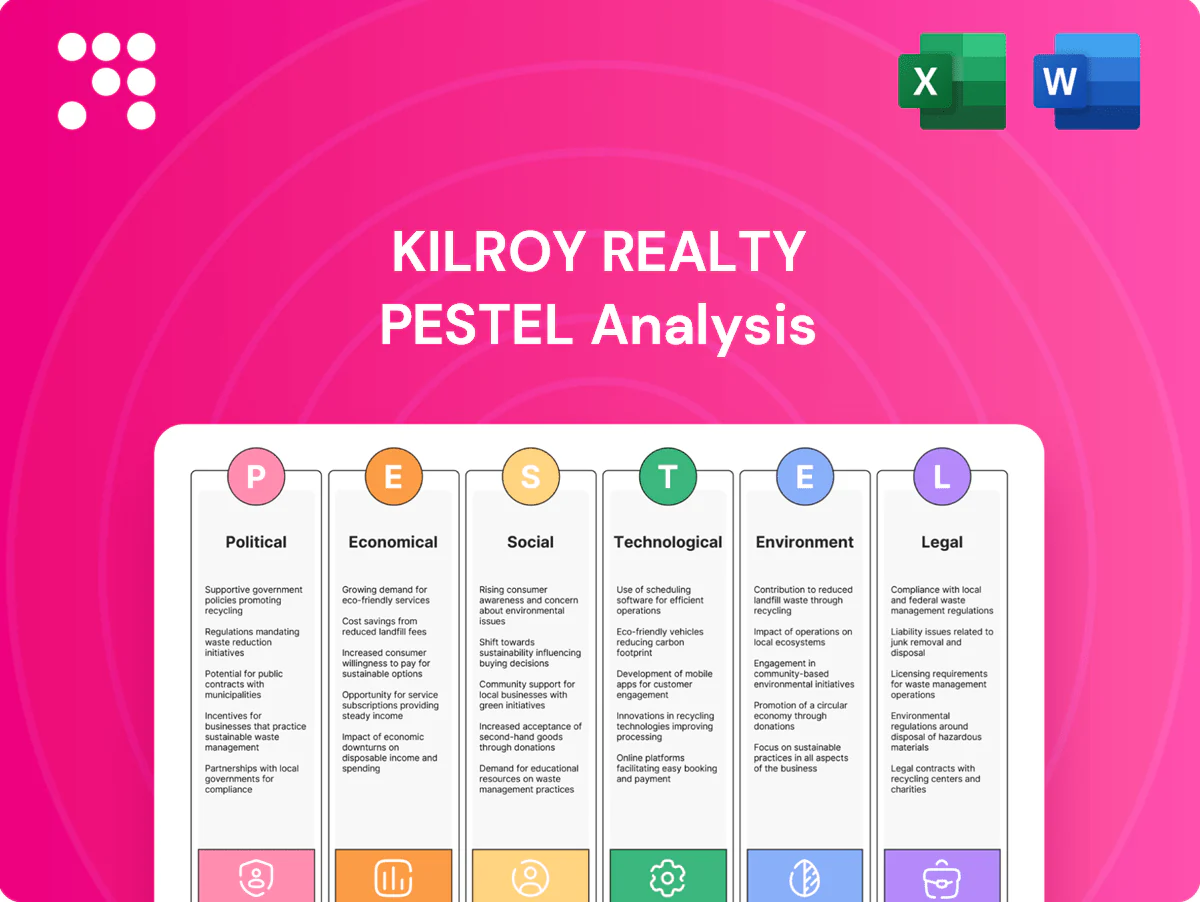
Kilroy Realty PESTLE Analysis

Your Competitive Advantage Starts with This Report
Discover how political shifts, market cycles, and technological trends uniquely affect Kilroy Realty with our concise PESTLE snapshot. These strategic insights reveal risks and growth levers for investors and planners. Purchase the full PESTLE to access the complete, actionable analysis now.
Political factors

Local zoning and entitlements
Entitlement timelines and discretionary approvals in California and Seattle routinely extend project cycles by 12–36 months, adding permitting and cost uncertainty for West Coast developers like Kilroy Realty. Community benefit negotiations and design review often constrain density or use, shifting program mixes and leaseable area. Early stakeholder engagement reduces delay risk and legal challenges. Streamlined approvals in Austin (often 6–12 months) can materially accelerate schedules, diversifying timing risk.
State and municipal incentives
Tax abatements, life‑science incentives and job credits materially shape Kilroy Realty’s development and tenant choices, especially across its ~13 million sq ft West Coast and Austin portfolio. Competing jurisdictions aggressively use incentives to lure anchor tenants and labs, raising bidding for lab space. Kilroy can target programs to enhance ESG and local workforce outcomes while monitoring municipal budget shifts and fiscal pressures.

Infrastructure and transit policy
Transit expansions and TOD policies materially shape site desirability and achievable rents; federal IIJA funding of 1.2 trillion and local programs like LA Measure M (roughly 120 billion over 40 years) underpin many projects. Funding gaps and phased budgets can delay transit-led office/lab cluster development. Kilroy benefits from assets near high-frequency transit (service every 15 minutes), and active advocacy for multimodal access preserves long-term competitiveness.

Public safety and urban governance
Perceptions of safety and active street life strongly influence tenant return-to-office choices, with Kastle Systems reporting a 2024 U.S. average weekday office occupancy near 52%, underscoring sensitivity to urban conditions. City policies on homelessness and policing materially affect CBD foot traffic and leasing momentum. Coordinated BID and placemaking efforts stabilize micro-market demand, while active on-site property management reduces reputational risk and turnover.
- Safety perception → tenant return
- Homelessness/policing → CBD foot traffic
- BID/placemaking → demand stability
- Active management → lower reputational risk
Tax policy and fiscal stability
Changes to property tax assessments, transfer taxes and business taxes directly alter Kilroy Realty cash flows; REITs must distribute 90% of taxable income and nonresidential property uses 39-year MACRS depreciation, both shaping capital allocation and taxable income. California and Seattle ballot measures have increased recurring owner costs historically, so monitoring city budget solvency helps anticipate service fees and assessments.
- REIT rule: 90% distribution requirement
- Depreciation: 39-year MACRS for commercial property
- Ballot measures: potential recurring cost increases (California, Seattle)
- City budget solvency signals future fees/service levels
Permitting: 12–36m WC / 6–12m Austin; REIT 90%; IIJA $1.2T; 2024 occ 52%
Entitlement delays (12–36 months West Coast; 6–12 months Austin) and design review raise permitting cost/risk. Incentives and REIT tax rules (90% distribution; 39‑year MACRS) drive tenant mix and cash flow. Transit funding (IIJA $1.2T; LA Measure M ~$120B) and 2024 office occupancy ~52% shape demand and site selection.
| Factor | Metric |
|---|---|
| Entitlement | 12–36m (CA/SEA); 6–12m (Austin) |
| Tax/REIT | 90% distribution; 39‑yr MACRS |
| Transit/Occupancy | IIJA $1.2T; LA Measure M ~$120B; 2024 occupancy 52% |
What is included in the product
 Detailed Word Document
Explores how macro-environmental factors uniquely affect Kilroy Realty across Political, Economic, Social, Technological, Environmental and Legal dimensions, with data-backed trends and region-specific regulatory context; designed for executives and investors to identify strategic risks and growth opportunities, with forward-looking insights for scenario planning and integration into plans, decks or reports.

 Customizable Excel Spreadsheet
A clean, summarized PESTLE of Kilroy Realty for easy meeting reference—visually segmented by categories, editable with personal notes, concise for PowerPoints and shareable across teams, using clear language to support external risk and market-positioning discussions.
Economic factors

Interest rates and cap rates
Higher policy rates—Fed funds ≈5.25–5.50% and the 10-year ≈4.0% in mid‑2025—compress valuations and make new developments marginal at typical projected returns. Coastal office cap rates have widened roughly 150–200 bps since 2022, raising refinancing and return hurdles. Kilroy’s use of fixed‑rate ladders and staggered maturities helps buffer cash‑flow volatility. Targeted asset sales or JVs allow efficient capital recycling to fund priority projects.
Office demand and hybrid work
Hybrid work cut aggregate office demand—occupancy averaged about 50% of 2019 levels in 2024—lengthening leasing cycles to roughly 9–12 months as tenants reassess footprints. Flight-to-quality concentrates demand in best-in-class assets, which in 2024 captured rent premiums of roughly 10–20% versus secondary space. Amenity-rich, flexible floorplates sustain those premiums, while proactive spec suites have reduced downtime between leases materially in 2024.

Life science market dynamics
Life science lab demand tracks biotech VC cycles and Big Pharma pipelines; Big Pharma R&D exceeds $200 billion annually, underpinning demand when pipelines progress. Capital tightening has reduced early-stage leasing and concentrated activity in core nodes. Converting offices or delivering lab-ready space hedges office softness. Specialized TI and HVAC can add roughly $200–$400/sf in CapEx but support materially higher rents.

Construction costs and supply chain
Materials and labor inflation continue to elevate development budgets and pro formas for Kilroy Realty, with the company managing a roughly $6.6 billion development pipeline as of year-end 2024 while construction cost pressures persist. Long-lead lab infrastructure items frequently extend schedules by 6–12 months, squeezing cash flow and leasing timelines. Value engineering, bulk procurement and phased delivery (aligning spend to leasing visibility) are used to protect margins.
- Materials/labor: ongoing upward pressure; impacts pro forma
- Lab lead times: commonly add 6–12 months to schedules
- Mitigants: value engineering, bulk procurement, phased delivery
Regional employment and migration
West Coast tech and life-science hiring remains the primary driver of office absorption in markets where Kilroy operates, even after roughly 200,000 US tech layoffs in 2023–24 tempered near-term demand.
Strong net migration into Austin (one of the top domestic gain metros in 2023–24) diversifies tenant pools and supports suburban and urban office uptake.
Targeting resilient sectors like life sciences, government contractors and engineering firms stabilizes rent-roll quality amid cyclical layoff waves.
- Tech layoffs ~200,000 (2023–24)
- Austin: top domestic migration gain metro (2023–24)
- Resilient sectors: life sciences, gov't, engineering
Permitting: 12–36m WC / 6–12m Austin; REIT 90%; IIJA $1.2T; 2024 occ 52%
Higher policy rates (Fed funds 5.25–5.50%, 10y ≈4.0% mid‑2025) and coastal cap‑rate expansion (+150–200bps since 2022) compress valuations and new‑development returns.
Office occupancy ~50% of 2019 levels in 2024; flight‑to‑quality drives 10–20% rent premiums for top assets, lengthening leasing to 9–12 months.
Kilroy’s $6.6B YE2024 pipeline, fixed‑rate ladders and asset sales/JVs mitigate refinancing and cash‑flow stress amid material construction inflation.
| Metric | Value |
|---|---|
| Fed funds (mid‑2025) | 5.25–5.50% |
| 10‑yr | ≈4.0% |
| Coastal cap‑rate widening | +150–200bps |
| Office occupancy (2024) | ~50% of 2019 |
| Kilroy pipeline (YE2024) | $6.6B |
What You See Is What You Get
Kilroy Realty PESTLE Analysis
The Kilroy Realty PESTLE Analysis provides a concise, professional review of political, economic, social, technological, legal, and environmental factors affecting the company. The preview shown here is the exact document you’ll receive after purchase—fully formatted and ready to use. No placeholders or teasers—this is the final file you’ll download immediately after payment.

Your Competitive Advantage Starts with This Report
Discover how political shifts, market cycles, and technological trends uniquely affect Kilroy Realty with our concise PESTLE snapshot. These strategic insights reveal risks and growth levers for investors and planners. Purchase the full PESTLE to access the complete, actionable analysis now.
Political factors
Local zoning and entitlements
Entitlement timelines and discretionary approvals in California and Seattle routinely extend project cycles by 12–36 months, adding permitting and cost uncertainty for West Coast developers like Kilroy Realty. Community benefit negotiations and design review often constrain density or use, shifting program mixes and leaseable area. Early stakeholder engagement reduces delay risk and legal challenges. Streamlined approvals in Austin (often 6–12 months) can materially accelerate schedules, diversifying timing risk.
State and municipal incentives
Tax abatements, life‑science incentives and job credits materially shape Kilroy Realty’s development and tenant choices, especially across its ~13 million sq ft West Coast and Austin portfolio. Competing jurisdictions aggressively use incentives to lure anchor tenants and labs, raising bidding for lab space. Kilroy can target programs to enhance ESG and local workforce outcomes while monitoring municipal budget shifts and fiscal pressures.
Infrastructure and transit policy
Transit expansions and TOD policies materially shape site desirability and achievable rents; federal IIJA funding of 1.2 trillion and local programs like LA Measure M (roughly 120 billion over 40 years) underpin many projects. Funding gaps and phased budgets can delay transit-led office/lab cluster development. Kilroy benefits from assets near high-frequency transit (service every 15 minutes), and active advocacy for multimodal access preserves long-term competitiveness.
Public safety and urban governance
Perceptions of safety and active street life strongly influence tenant return-to-office choices, with Kastle Systems reporting a 2024 U.S. average weekday office occupancy near 52%, underscoring sensitivity to urban conditions. City policies on homelessness and policing materially affect CBD foot traffic and leasing momentum. Coordinated BID and placemaking efforts stabilize micro-market demand, while active on-site property management reduces reputational risk and turnover.
- Safety perception → tenant return
- Homelessness/policing → CBD foot traffic
- BID/placemaking → demand stability
- Active management → lower reputational risk
Tax policy and fiscal stability
Changes to property tax assessments, transfer taxes and business taxes directly alter Kilroy Realty cash flows; REITs must distribute 90% of taxable income and nonresidential property uses 39-year MACRS depreciation, both shaping capital allocation and taxable income. California and Seattle ballot measures have increased recurring owner costs historically, so monitoring city budget solvency helps anticipate service fees and assessments.
- REIT rule: 90% distribution requirement
- Depreciation: 39-year MACRS for commercial property
- Ballot measures: potential recurring cost increases (California, Seattle)
- City budget solvency signals future fees/service levels
Permitting: 12–36m WC / 6–12m Austin; REIT 90%; IIJA $1.2T; 2024 occ 52%
Entitlement delays (12–36 months West Coast; 6–12 months Austin) and design review raise permitting cost/risk. Incentives and REIT tax rules (90% distribution; 39‑year MACRS) drive tenant mix and cash flow. Transit funding (IIJA $1.2T; LA Measure M ~$120B) and 2024 office occupancy ~52% shape demand and site selection.
| Factor | Metric |
|---|---|
| Entitlement | 12–36m (CA/SEA); 6–12m (Austin) |
| Tax/REIT | 90% distribution; 39‑yr MACRS |
| Transit/Occupancy | IIJA $1.2T; LA Measure M ~$120B; 2024 occupancy 52% |
What is included in the product
Detailed Word Document
Explores how macro-environmental factors uniquely affect Kilroy Realty across Political, Economic, Social, Technological, Environmental and Legal dimensions, with data-backed trends and region-specific regulatory context; designed for executives and investors to identify strategic risks and growth opportunities, with forward-looking insights for scenario planning and integration into plans, decks or reports.
Customizable Excel Spreadsheet
A clean, summarized PESTLE of Kilroy Realty for easy meeting reference—visually segmented by categories, editable with personal notes, concise for PowerPoints and shareable across teams, using clear language to support external risk and market-positioning discussions.
Economic factors
Interest rates and cap rates
Higher policy rates—Fed funds ≈5.25–5.50% and the 10-year ≈4.0% in mid‑2025—compress valuations and make new developments marginal at typical projected returns. Coastal office cap rates have widened roughly 150–200 bps since 2022, raising refinancing and return hurdles. Kilroy’s use of fixed‑rate ladders and staggered maturities helps buffer cash‑flow volatility. Targeted asset sales or JVs allow efficient capital recycling to fund priority projects.
Office demand and hybrid work
Hybrid work cut aggregate office demand—occupancy averaged about 50% of 2019 levels in 2024—lengthening leasing cycles to roughly 9–12 months as tenants reassess footprints. Flight-to-quality concentrates demand in best-in-class assets, which in 2024 captured rent premiums of roughly 10–20% versus secondary space. Amenity-rich, flexible floorplates sustain those premiums, while proactive spec suites have reduced downtime between leases materially in 2024.
Life science market dynamics
Life science lab demand tracks biotech VC cycles and Big Pharma pipelines; Big Pharma R&D exceeds $200 billion annually, underpinning demand when pipelines progress. Capital tightening has reduced early-stage leasing and concentrated activity in core nodes. Converting offices or delivering lab-ready space hedges office softness. Specialized TI and HVAC can add roughly $200–$400/sf in CapEx but support materially higher rents.
Construction costs and supply chain
Materials and labor inflation continue to elevate development budgets and pro formas for Kilroy Realty, with the company managing a roughly $6.6 billion development pipeline as of year-end 2024 while construction cost pressures persist. Long-lead lab infrastructure items frequently extend schedules by 6–12 months, squeezing cash flow and leasing timelines. Value engineering, bulk procurement and phased delivery (aligning spend to leasing visibility) are used to protect margins.
- Materials/labor: ongoing upward pressure; impacts pro forma
- Lab lead times: commonly add 6–12 months to schedules
- Mitigants: value engineering, bulk procurement, phased delivery
Regional employment and migration
West Coast tech and life-science hiring remains the primary driver of office absorption in markets where Kilroy operates, even after roughly 200,000 US tech layoffs in 2023–24 tempered near-term demand.
Strong net migration into Austin (one of the top domestic gain metros in 2023–24) diversifies tenant pools and supports suburban and urban office uptake.
Targeting resilient sectors like life sciences, government contractors and engineering firms stabilizes rent-roll quality amid cyclical layoff waves.
- Tech layoffs ~200,000 (2023–24)
- Austin: top domestic migration gain metro (2023–24)
- Resilient sectors: life sciences, gov't, engineering
Permitting: 12–36m WC / 6–12m Austin; REIT 90%; IIJA $1.2T; 2024 occ 52%
Higher policy rates (Fed funds 5.25–5.50%, 10y ≈4.0% mid‑2025) and coastal cap‑rate expansion (+150–200bps since 2022) compress valuations and new‑development returns.
Office occupancy ~50% of 2019 levels in 2024; flight‑to‑quality drives 10–20% rent premiums for top assets, lengthening leasing to 9–12 months.
Kilroy’s $6.6B YE2024 pipeline, fixed‑rate ladders and asset sales/JVs mitigate refinancing and cash‑flow stress amid material construction inflation.
| Metric | Value |
|---|---|
| Fed funds (mid‑2025) | 5.25–5.50% |
| 10‑yr | ≈4.0% |
| Coastal cap‑rate widening | +150–200bps |
| Office occupancy (2024) | ~50% of 2019 |
| Kilroy pipeline (YE2024) | $6.6B |
What You See Is What You Get
Kilroy Realty PESTLE Analysis
The Kilroy Realty PESTLE Analysis provides a concise, professional review of political, economic, social, technological, legal, and environmental factors affecting the company. The preview shown here is the exact document you’ll receive after purchase—fully formatted and ready to use. No placeholders or teasers—this is the final file you’ll download immediately after payment.
Original: $10.00
-65%$10.00
$3.50Description
Your Competitive Advantage Starts with This Report
Discover how political shifts, market cycles, and technological trends uniquely affect Kilroy Realty with our concise PESTLE snapshot. These strategic insights reveal risks and growth levers for investors and planners. Purchase the full PESTLE to access the complete, actionable analysis now.
Political factors
Local zoning and entitlements
Entitlement timelines and discretionary approvals in California and Seattle routinely extend project cycles by 12–36 months, adding permitting and cost uncertainty for West Coast developers like Kilroy Realty. Community benefit negotiations and design review often constrain density or use, shifting program mixes and leaseable area. Early stakeholder engagement reduces delay risk and legal challenges. Streamlined approvals in Austin (often 6–12 months) can materially accelerate schedules, diversifying timing risk.
State and municipal incentives
Tax abatements, life‑science incentives and job credits materially shape Kilroy Realty’s development and tenant choices, especially across its ~13 million sq ft West Coast and Austin portfolio. Competing jurisdictions aggressively use incentives to lure anchor tenants and labs, raising bidding for lab space. Kilroy can target programs to enhance ESG and local workforce outcomes while monitoring municipal budget shifts and fiscal pressures.
Infrastructure and transit policy
Transit expansions and TOD policies materially shape site desirability and achievable rents; federal IIJA funding of 1.2 trillion and local programs like LA Measure M (roughly 120 billion over 40 years) underpin many projects. Funding gaps and phased budgets can delay transit-led office/lab cluster development. Kilroy benefits from assets near high-frequency transit (service every 15 minutes), and active advocacy for multimodal access preserves long-term competitiveness.
Public safety and urban governance
Perceptions of safety and active street life strongly influence tenant return-to-office choices, with Kastle Systems reporting a 2024 U.S. average weekday office occupancy near 52%, underscoring sensitivity to urban conditions. City policies on homelessness and policing materially affect CBD foot traffic and leasing momentum. Coordinated BID and placemaking efforts stabilize micro-market demand, while active on-site property management reduces reputational risk and turnover.
- Safety perception → tenant return
- Homelessness/policing → CBD foot traffic
- BID/placemaking → demand stability
- Active management → lower reputational risk
Tax policy and fiscal stability
Changes to property tax assessments, transfer taxes and business taxes directly alter Kilroy Realty cash flows; REITs must distribute 90% of taxable income and nonresidential property uses 39-year MACRS depreciation, both shaping capital allocation and taxable income. California and Seattle ballot measures have increased recurring owner costs historically, so monitoring city budget solvency helps anticipate service fees and assessments.
- REIT rule: 90% distribution requirement
- Depreciation: 39-year MACRS for commercial property
- Ballot measures: potential recurring cost increases (California, Seattle)
- City budget solvency signals future fees/service levels
Permitting: 12–36m WC / 6–12m Austin; REIT 90%; IIJA $1.2T; 2024 occ 52%
Entitlement delays (12–36 months West Coast; 6–12 months Austin) and design review raise permitting cost/risk. Incentives and REIT tax rules (90% distribution; 39‑year MACRS) drive tenant mix and cash flow. Transit funding (IIJA $1.2T; LA Measure M ~$120B) and 2024 office occupancy ~52% shape demand and site selection.
| Factor | Metric |
|---|---|
| Entitlement | 12–36m (CA/SEA); 6–12m (Austin) |
| Tax/REIT | 90% distribution; 39‑yr MACRS |
| Transit/Occupancy | IIJA $1.2T; LA Measure M ~$120B; 2024 occupancy 52% |
What is included in the product
Detailed Word Document
Explores how macro-environmental factors uniquely affect Kilroy Realty across Political, Economic, Social, Technological, Environmental and Legal dimensions, with data-backed trends and region-specific regulatory context; designed for executives and investors to identify strategic risks and growth opportunities, with forward-looking insights for scenario planning and integration into plans, decks or reports.
Customizable Excel Spreadsheet
A clean, summarized PESTLE of Kilroy Realty for easy meeting reference—visually segmented by categories, editable with personal notes, concise for PowerPoints and shareable across teams, using clear language to support external risk and market-positioning discussions.
Economic factors
Interest rates and cap rates
Higher policy rates—Fed funds ≈5.25–5.50% and the 10-year ≈4.0% in mid‑2025—compress valuations and make new developments marginal at typical projected returns. Coastal office cap rates have widened roughly 150–200 bps since 2022, raising refinancing and return hurdles. Kilroy’s use of fixed‑rate ladders and staggered maturities helps buffer cash‑flow volatility. Targeted asset sales or JVs allow efficient capital recycling to fund priority projects.
Office demand and hybrid work
Hybrid work cut aggregate office demand—occupancy averaged about 50% of 2019 levels in 2024—lengthening leasing cycles to roughly 9–12 months as tenants reassess footprints. Flight-to-quality concentrates demand in best-in-class assets, which in 2024 captured rent premiums of roughly 10–20% versus secondary space. Amenity-rich, flexible floorplates sustain those premiums, while proactive spec suites have reduced downtime between leases materially in 2024.
Life science market dynamics
Life science lab demand tracks biotech VC cycles and Big Pharma pipelines; Big Pharma R&D exceeds $200 billion annually, underpinning demand when pipelines progress. Capital tightening has reduced early-stage leasing and concentrated activity in core nodes. Converting offices or delivering lab-ready space hedges office softness. Specialized TI and HVAC can add roughly $200–$400/sf in CapEx but support materially higher rents.
Construction costs and supply chain
Materials and labor inflation continue to elevate development budgets and pro formas for Kilroy Realty, with the company managing a roughly $6.6 billion development pipeline as of year-end 2024 while construction cost pressures persist. Long-lead lab infrastructure items frequently extend schedules by 6–12 months, squeezing cash flow and leasing timelines. Value engineering, bulk procurement and phased delivery (aligning spend to leasing visibility) are used to protect margins.
- Materials/labor: ongoing upward pressure; impacts pro forma
- Lab lead times: commonly add 6–12 months to schedules
- Mitigants: value engineering, bulk procurement, phased delivery
Regional employment and migration
West Coast tech and life-science hiring remains the primary driver of office absorption in markets where Kilroy operates, even after roughly 200,000 US tech layoffs in 2023–24 tempered near-term demand.
Strong net migration into Austin (one of the top domestic gain metros in 2023–24) diversifies tenant pools and supports suburban and urban office uptake.
Targeting resilient sectors like life sciences, government contractors and engineering firms stabilizes rent-roll quality amid cyclical layoff waves.
- Tech layoffs ~200,000 (2023–24)
- Austin: top domestic migration gain metro (2023–24)
- Resilient sectors: life sciences, gov't, engineering
Permitting: 12–36m WC / 6–12m Austin; REIT 90%; IIJA $1.2T; 2024 occ 52%
Higher policy rates (Fed funds 5.25–5.50%, 10y ≈4.0% mid‑2025) and coastal cap‑rate expansion (+150–200bps since 2022) compress valuations and new‑development returns.
Office occupancy ~50% of 2019 levels in 2024; flight‑to‑quality drives 10–20% rent premiums for top assets, lengthening leasing to 9–12 months.
Kilroy’s $6.6B YE2024 pipeline, fixed‑rate ladders and asset sales/JVs mitigate refinancing and cash‑flow stress amid material construction inflation.
| Metric | Value |
|---|---|
| Fed funds (mid‑2025) | 5.25–5.50% |
| 10‑yr | ≈4.0% |
| Coastal cap‑rate widening | +150–200bps |
| Office occupancy (2024) | ~50% of 2019 |
| Kilroy pipeline (YE2024) | $6.6B |
What You See Is What You Get
Kilroy Realty PESTLE Analysis
The Kilroy Realty PESTLE Analysis provides a concise, professional review of political, economic, social, technological, legal, and environmental factors affecting the company. The preview shown here is the exact document you’ll receive after purchase—fully formatted and ready to use. No placeholders or teasers—this is the final file you’ll download immediately after payment.











