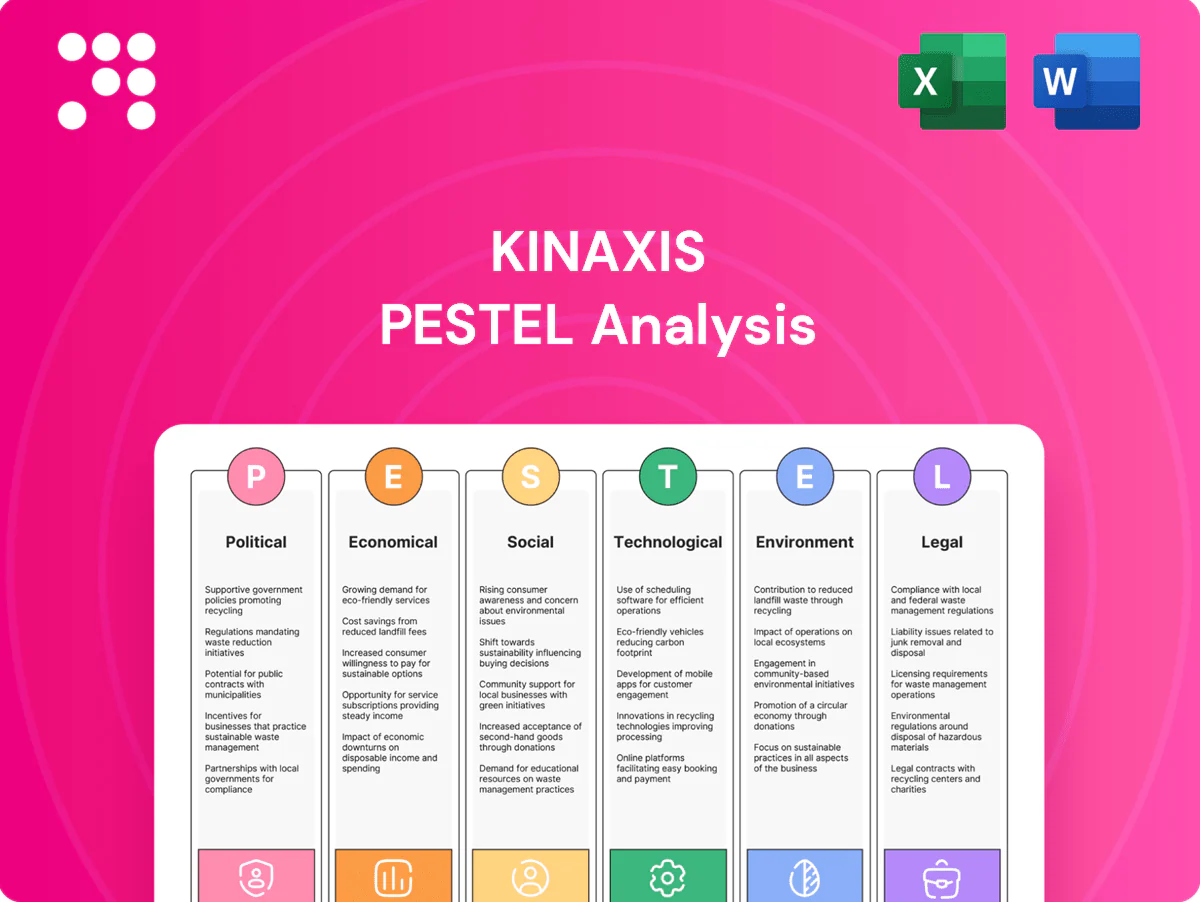
Kinaxis PESTLE Analysis

Make Smarter Strategic Decisions with a Complete PESTEL View
Discover how political, economic, social, technological, legal, and environmental forces are shaping Kinaxis’s strategy and growth prospects in our focused PESTLE Analysis. This concise, expert-crafted report highlights risks and opportunities you can act on immediately. Purchase the full version to get the complete, editable analysis and strengthen your investment or strategic decisions.
Political factors

Trade policy and geopolitics
Shifts in tariffs, sanctions and export controls remodel the multi-tier networks Kinaxis models, forcing rerouting in autos, electronics and pharma and raising demand for concurrent planning. Geopolitical tension heightens scenario-planning needs across customers. US CHIPS Act ($52B) and Inflation Reduction Act (~$369B) reshoring incentives change demand patterns and sales cycles.
Government supply chain resilience agendas
National initiatives to secure critical supply chains — notably the US CHIPS Act ($52 billion) and the Inflation Reduction Act (roughly $369 billion in clean energy tax credits and spending) — are driving enterprise investment in planning platforms. Public funding and mandates in healthcare, semiconductors and energy create sizable procurement opportunities that Kinaxis can target by aligning solutions to resilience KPIs (inventory days, recovery time). Public-sector procurement rules, however, often extend sales timelines to 9–18 months.

Data sovereignty and localization policies
Many jurisdictions now require data residency for operational data, with over 60 countries enforcing some localization rules as of 2024; Kinaxis must provide regional hosting options and granular controls to win deals. Localization drives changes in system architecture, raises cost-to-serve and narrows partner selection, increasing implementation complexity. Non-compliance can cause deal loss and regulatory fines (e.g., GDPR penalties up to €20 million or 4% of global turnover).

Industrial policy and subsidies
CHIPS-like programs (US CHIPS and Science Act: $52.7 billion) and green manufacturing incentives (US Inflation Reduction Act: $369 billion) expand capacity-planning scope as new fabs and decarbonized plants enter supply chains, requiring rapid supplier and plant onboarding into planning ecosystems. Policy-driven demand clusters regionally (US, EU, Taiwan) and by sector, and concurrent adoption across subsidized ecosystems tightens lead-time variability and can materially improve forecasting reliability.
- Capacity injections: $52.7B CHIPS
- Clean energy subsidies: $369B IRA
- Regional clustering: US, EU, Taiwan
- Onboarding: faster supplier/plant integration
Public cloud regulatory scrutiny
Governments are increasing scrutiny of cloud concentration and cross-border transfers as AWS, Azure and Google held about 65% of the global cloud market in 2024, raising regulatory exposure for Kinaxis when handling EU/US data. Certifications and audits (FedRAMP-like, ISO 27001, SOC 2) are table stakes in bids. Vendor lock-in concerns favor multi-cloud readiness, so Kinaxis should prioritize hybrid/multi-cloud support.
- Regulatory: 65% market concentration (2024)
- Compliance: FedRAMP-like/ISO/SOC required in many RFPs
- Strategy: enable multi-cloud/hybrid to reduce lock-in
Reshoring, tariffs and data localization lengthen sales cycles to 9-18 months, spur regional hubs
Geopolitical shifts, tariffs and sanctions raise demand for Kinaxis concurrent planning as reshoring incentives (US CHIPS $52.7B; IRA ~$369B) create regional capacity clusters and longer sales cycles (9–18 months). Data localization (60+ countries) and cloud concentration (~65% market share) force multi-region hosting and compliance (GDPR fines up to €20m/4%).
| Factor | 2024/25 Data |
|---|---|
| CHIPS | $52.7B |
| IRA | $369B |
| Data localization | 60+ countries |
| Cloud share | ~65% |
| GDPR fine | €20M/4% |
What is included in the product
 Detailed Word Document
Explores how macro-environmental factors uniquely affect Kinaxis across Political, Economic, Social, Technological, Environmental and Legal dimensions, with each section backed by current data and forward-looking insights for scenario planning. Designed for executives and investors, the analysis is market-specific, formatted for decks/reports and highlights actionable threats and opportunities.

 Customizable Excel Spreadsheet
Concise Kinaxis PESTLE summary, visually segmented by category for quick interpretation, easily editable for regional or business-line notes and shareable across teams to streamline risk discussions and align planning sessions.
Economic factors

Enterprise IT spending cycles
Macro slowdowns delay deals and elongate approvals — Gartner projected worldwide IT spending around $4.7 trillion in 2024, tightening procurement cycles and deferring large S&OP projects; conversely growth cycles accelerate digital transformation budgets, boosting demand for supply‑chain SaaS. Kinaxis’s ROI case depends on inventory turns, service levels and working‑capital gains that customers cite as primary payback drivers. Its subscription model cushions revenue volatility, though churn and downsell remain risks; land‑and‑expand sales strategies help mitigate cyclicality.
Inflation and cost-to-serve
Rising inflation (US CPI 2023: 3.4%) pushes up cloud infrastructure, talent and vendor costs, squeezing Kinaxis unless pricing power reflects value in supply shortages and disruptions. Indexing contracts or tiered packaging can protect margins. Efficiency in multi-tenant operations preserves SaaS gross margins (typically 70–80%).

Currency fluctuations
Currency fluctuations create FX translation risk for Kinaxis, which reported CAD 303.5 million in FY2024 revenue, earned across North America, EMEA and APAC. Cost bases in Canada and other regions provide natural hedges that partially offset currency exposure. Active pricing and hedging policies are required to manage volatility and preserve margins. FX swings can erode competitiveness in price-sensitive markets if not properly managed.

Sectoral demand variance
Cyclical industries like electronics and autos drive volatile order volumes while life sciences show steadier demand; Kinaxis revenue mix cushions swings through multi-vertical deployments. Upside from semiconductor capacity expansions (TSMC capex ~USD 40B guidance for 2024) and accelerating EV production supports stronger S&OP demand. Downside risk if broad capex freezes or deeper inventory corrections occur, slowing cloud subscription growth.
- electronics/autos: high volume volatility
- life sciences: resilient recurring demand
- upside: semiconductor and EV capex
- downside: capex freezes/inventory corrections
Total cost of ownership and ROI
Customers now scrutinize payback as US federal funds hovered near 5.25%–5.50% in mid‑2025; Kinaxis concurrent planning drives demonstrable benefits—case studies report inventory reductions up to 30% and service‑level gains that often deliver ROI within 12 months—while pre‑built connectors shorten time‑to‑value and lower deployment risk; outcome‑based pricing can align incentives between vendor and buyer.
- Total cost pressure: higher rates compress acceptable payback windows
- ROI drivers: concurrent planning + fewer stockouts → measurable savings (up to 30% inventory)
- Risk reduction: pre‑built connectors = faster deployments
- Pricing: outcome‑based models align incentives
Reshoring, tariffs and data localization lengthen sales cycles to 9-18 months, spur regional hubs
Macro slowdowns curb IT spend (Gartner $4.7T 2024) and delay S&OP deals; growth cycles lift SaaS demand. Kinaxis revenue CAD 303.5M (FY2024) and subscription model reduce volatility but FX and churn risk remain. Inflation (US CPI 2023 3.4%) and fed funds ~5.25–5.50% (mid‑2025) shorten payback windows; concurrent planning claims up to 30% inventory cuts.
| Metric | Value |
|---|---|
| Global IT spend | $4.7T (2024) |
| Kinaxis revenue | CAD 303.5M (FY2024) |
| Inventory reduction | Up to 30% |
| Fed funds | 5.25–5.50% (mid‑2025) |
Full Version Awaits
Kinaxis PESTLE Analysis
The Kinaxis PESTLE Analysis preview shown here is the exact document you’ll receive after purchase—fully formatted and ready to use. The content, layout, and insights on political, economic, social, technological, legal, and environmental factors are final. No placeholders or teasers—this is the real file you’ll download immediately after checkout.

Make Smarter Strategic Decisions with a Complete PESTEL View
Discover how political, economic, social, technological, legal, and environmental forces are shaping Kinaxis’s strategy and growth prospects in our focused PESTLE Analysis. This concise, expert-crafted report highlights risks and opportunities you can act on immediately. Purchase the full version to get the complete, editable analysis and strengthen your investment or strategic decisions.
Political factors
Trade policy and geopolitics
Shifts in tariffs, sanctions and export controls remodel the multi-tier networks Kinaxis models, forcing rerouting in autos, electronics and pharma and raising demand for concurrent planning. Geopolitical tension heightens scenario-planning needs across customers. US CHIPS Act ($52B) and Inflation Reduction Act (~$369B) reshoring incentives change demand patterns and sales cycles.
Government supply chain resilience agendas
National initiatives to secure critical supply chains — notably the US CHIPS Act ($52 billion) and the Inflation Reduction Act (roughly $369 billion in clean energy tax credits and spending) — are driving enterprise investment in planning platforms. Public funding and mandates in healthcare, semiconductors and energy create sizable procurement opportunities that Kinaxis can target by aligning solutions to resilience KPIs (inventory days, recovery time). Public-sector procurement rules, however, often extend sales timelines to 9–18 months.
Data sovereignty and localization policies
Many jurisdictions now require data residency for operational data, with over 60 countries enforcing some localization rules as of 2024; Kinaxis must provide regional hosting options and granular controls to win deals. Localization drives changes in system architecture, raises cost-to-serve and narrows partner selection, increasing implementation complexity. Non-compliance can cause deal loss and regulatory fines (e.g., GDPR penalties up to €20 million or 4% of global turnover).
Industrial policy and subsidies
CHIPS-like programs (US CHIPS and Science Act: $52.7 billion) and green manufacturing incentives (US Inflation Reduction Act: $369 billion) expand capacity-planning scope as new fabs and decarbonized plants enter supply chains, requiring rapid supplier and plant onboarding into planning ecosystems. Policy-driven demand clusters regionally (US, EU, Taiwan) and by sector, and concurrent adoption across subsidized ecosystems tightens lead-time variability and can materially improve forecasting reliability.
- Capacity injections: $52.7B CHIPS
- Clean energy subsidies: $369B IRA
- Regional clustering: US, EU, Taiwan
- Onboarding: faster supplier/plant integration
Public cloud regulatory scrutiny
Governments are increasing scrutiny of cloud concentration and cross-border transfers as AWS, Azure and Google held about 65% of the global cloud market in 2024, raising regulatory exposure for Kinaxis when handling EU/US data. Certifications and audits (FedRAMP-like, ISO 27001, SOC 2) are table stakes in bids. Vendor lock-in concerns favor multi-cloud readiness, so Kinaxis should prioritize hybrid/multi-cloud support.
- Regulatory: 65% market concentration (2024)
- Compliance: FedRAMP-like/ISO/SOC required in many RFPs
- Strategy: enable multi-cloud/hybrid to reduce lock-in
Reshoring, tariffs and data localization lengthen sales cycles to 9-18 months, spur regional hubs
Geopolitical shifts, tariffs and sanctions raise demand for Kinaxis concurrent planning as reshoring incentives (US CHIPS $52.7B; IRA ~$369B) create regional capacity clusters and longer sales cycles (9–18 months). Data localization (60+ countries) and cloud concentration (~65% market share) force multi-region hosting and compliance (GDPR fines up to €20m/4%).
| Factor | 2024/25 Data |
|---|---|
| CHIPS | $52.7B |
| IRA | $369B |
| Data localization | 60+ countries |
| Cloud share | ~65% |
| GDPR fine | €20M/4% |
What is included in the product
Detailed Word Document
Explores how macro-environmental factors uniquely affect Kinaxis across Political, Economic, Social, Technological, Environmental and Legal dimensions, with each section backed by current data and forward-looking insights for scenario planning. Designed for executives and investors, the analysis is market-specific, formatted for decks/reports and highlights actionable threats and opportunities.
Customizable Excel Spreadsheet
Concise Kinaxis PESTLE summary, visually segmented by category for quick interpretation, easily editable for regional or business-line notes and shareable across teams to streamline risk discussions and align planning sessions.
Economic factors
Enterprise IT spending cycles
Macro slowdowns delay deals and elongate approvals — Gartner projected worldwide IT spending around $4.7 trillion in 2024, tightening procurement cycles and deferring large S&OP projects; conversely growth cycles accelerate digital transformation budgets, boosting demand for supply‑chain SaaS. Kinaxis’s ROI case depends on inventory turns, service levels and working‑capital gains that customers cite as primary payback drivers. Its subscription model cushions revenue volatility, though churn and downsell remain risks; land‑and‑expand sales strategies help mitigate cyclicality.
Inflation and cost-to-serve
Rising inflation (US CPI 2023: 3.4%) pushes up cloud infrastructure, talent and vendor costs, squeezing Kinaxis unless pricing power reflects value in supply shortages and disruptions. Indexing contracts or tiered packaging can protect margins. Efficiency in multi-tenant operations preserves SaaS gross margins (typically 70–80%).
Currency fluctuations
Currency fluctuations create FX translation risk for Kinaxis, which reported CAD 303.5 million in FY2024 revenue, earned across North America, EMEA and APAC. Cost bases in Canada and other regions provide natural hedges that partially offset currency exposure. Active pricing and hedging policies are required to manage volatility and preserve margins. FX swings can erode competitiveness in price-sensitive markets if not properly managed.
Sectoral demand variance
Cyclical industries like electronics and autos drive volatile order volumes while life sciences show steadier demand; Kinaxis revenue mix cushions swings through multi-vertical deployments. Upside from semiconductor capacity expansions (TSMC capex ~USD 40B guidance for 2024) and accelerating EV production supports stronger S&OP demand. Downside risk if broad capex freezes or deeper inventory corrections occur, slowing cloud subscription growth.
- electronics/autos: high volume volatility
- life sciences: resilient recurring demand
- upside: semiconductor and EV capex
- downside: capex freezes/inventory corrections
Total cost of ownership and ROI
Customers now scrutinize payback as US federal funds hovered near 5.25%–5.50% in mid‑2025; Kinaxis concurrent planning drives demonstrable benefits—case studies report inventory reductions up to 30% and service‑level gains that often deliver ROI within 12 months—while pre‑built connectors shorten time‑to‑value and lower deployment risk; outcome‑based pricing can align incentives between vendor and buyer.
- Total cost pressure: higher rates compress acceptable payback windows
- ROI drivers: concurrent planning + fewer stockouts → measurable savings (up to 30% inventory)
- Risk reduction: pre‑built connectors = faster deployments
- Pricing: outcome‑based models align incentives
Reshoring, tariffs and data localization lengthen sales cycles to 9-18 months, spur regional hubs
Macro slowdowns curb IT spend (Gartner $4.7T 2024) and delay S&OP deals; growth cycles lift SaaS demand. Kinaxis revenue CAD 303.5M (FY2024) and subscription model reduce volatility but FX and churn risk remain. Inflation (US CPI 2023 3.4%) and fed funds ~5.25–5.50% (mid‑2025) shorten payback windows; concurrent planning claims up to 30% inventory cuts.
| Metric | Value |
|---|---|
| Global IT spend | $4.7T (2024) |
| Kinaxis revenue | CAD 303.5M (FY2024) |
| Inventory reduction | Up to 30% |
| Fed funds | 5.25–5.50% (mid‑2025) |
Full Version Awaits
Kinaxis PESTLE Analysis
The Kinaxis PESTLE Analysis preview shown here is the exact document you’ll receive after purchase—fully formatted and ready to use. The content, layout, and insights on political, economic, social, technological, legal, and environmental factors are final. No placeholders or teasers—this is the real file you’ll download immediately after checkout.
Original: $10.00
-65%$10.00
$3.50Description
Make Smarter Strategic Decisions with a Complete PESTEL View
Discover how political, economic, social, technological, legal, and environmental forces are shaping Kinaxis’s strategy and growth prospects in our focused PESTLE Analysis. This concise, expert-crafted report highlights risks and opportunities you can act on immediately. Purchase the full version to get the complete, editable analysis and strengthen your investment or strategic decisions.
Political factors
Trade policy and geopolitics
Shifts in tariffs, sanctions and export controls remodel the multi-tier networks Kinaxis models, forcing rerouting in autos, electronics and pharma and raising demand for concurrent planning. Geopolitical tension heightens scenario-planning needs across customers. US CHIPS Act ($52B) and Inflation Reduction Act (~$369B) reshoring incentives change demand patterns and sales cycles.
Government supply chain resilience agendas
National initiatives to secure critical supply chains — notably the US CHIPS Act ($52 billion) and the Inflation Reduction Act (roughly $369 billion in clean energy tax credits and spending) — are driving enterprise investment in planning platforms. Public funding and mandates in healthcare, semiconductors and energy create sizable procurement opportunities that Kinaxis can target by aligning solutions to resilience KPIs (inventory days, recovery time). Public-sector procurement rules, however, often extend sales timelines to 9–18 months.
Data sovereignty and localization policies
Many jurisdictions now require data residency for operational data, with over 60 countries enforcing some localization rules as of 2024; Kinaxis must provide regional hosting options and granular controls to win deals. Localization drives changes in system architecture, raises cost-to-serve and narrows partner selection, increasing implementation complexity. Non-compliance can cause deal loss and regulatory fines (e.g., GDPR penalties up to €20 million or 4% of global turnover).
Industrial policy and subsidies
CHIPS-like programs (US CHIPS and Science Act: $52.7 billion) and green manufacturing incentives (US Inflation Reduction Act: $369 billion) expand capacity-planning scope as new fabs and decarbonized plants enter supply chains, requiring rapid supplier and plant onboarding into planning ecosystems. Policy-driven demand clusters regionally (US, EU, Taiwan) and by sector, and concurrent adoption across subsidized ecosystems tightens lead-time variability and can materially improve forecasting reliability.
- Capacity injections: $52.7B CHIPS
- Clean energy subsidies: $369B IRA
- Regional clustering: US, EU, Taiwan
- Onboarding: faster supplier/plant integration
Public cloud regulatory scrutiny
Governments are increasing scrutiny of cloud concentration and cross-border transfers as AWS, Azure and Google held about 65% of the global cloud market in 2024, raising regulatory exposure for Kinaxis when handling EU/US data. Certifications and audits (FedRAMP-like, ISO 27001, SOC 2) are table stakes in bids. Vendor lock-in concerns favor multi-cloud readiness, so Kinaxis should prioritize hybrid/multi-cloud support.
- Regulatory: 65% market concentration (2024)
- Compliance: FedRAMP-like/ISO/SOC required in many RFPs
- Strategy: enable multi-cloud/hybrid to reduce lock-in
Reshoring, tariffs and data localization lengthen sales cycles to 9-18 months, spur regional hubs
Geopolitical shifts, tariffs and sanctions raise demand for Kinaxis concurrent planning as reshoring incentives (US CHIPS $52.7B; IRA ~$369B) create regional capacity clusters and longer sales cycles (9–18 months). Data localization (60+ countries) and cloud concentration (~65% market share) force multi-region hosting and compliance (GDPR fines up to €20m/4%).
| Factor | 2024/25 Data |
|---|---|
| CHIPS | $52.7B |
| IRA | $369B |
| Data localization | 60+ countries |
| Cloud share | ~65% |
| GDPR fine | €20M/4% |
What is included in the product
Detailed Word Document
Explores how macro-environmental factors uniquely affect Kinaxis across Political, Economic, Social, Technological, Environmental and Legal dimensions, with each section backed by current data and forward-looking insights for scenario planning. Designed for executives and investors, the analysis is market-specific, formatted for decks/reports and highlights actionable threats and opportunities.
Customizable Excel Spreadsheet
Concise Kinaxis PESTLE summary, visually segmented by category for quick interpretation, easily editable for regional or business-line notes and shareable across teams to streamline risk discussions and align planning sessions.
Economic factors
Enterprise IT spending cycles
Macro slowdowns delay deals and elongate approvals — Gartner projected worldwide IT spending around $4.7 trillion in 2024, tightening procurement cycles and deferring large S&OP projects; conversely growth cycles accelerate digital transformation budgets, boosting demand for supply‑chain SaaS. Kinaxis’s ROI case depends on inventory turns, service levels and working‑capital gains that customers cite as primary payback drivers. Its subscription model cushions revenue volatility, though churn and downsell remain risks; land‑and‑expand sales strategies help mitigate cyclicality.
Inflation and cost-to-serve
Rising inflation (US CPI 2023: 3.4%) pushes up cloud infrastructure, talent and vendor costs, squeezing Kinaxis unless pricing power reflects value in supply shortages and disruptions. Indexing contracts or tiered packaging can protect margins. Efficiency in multi-tenant operations preserves SaaS gross margins (typically 70–80%).
Currency fluctuations
Currency fluctuations create FX translation risk for Kinaxis, which reported CAD 303.5 million in FY2024 revenue, earned across North America, EMEA and APAC. Cost bases in Canada and other regions provide natural hedges that partially offset currency exposure. Active pricing and hedging policies are required to manage volatility and preserve margins. FX swings can erode competitiveness in price-sensitive markets if not properly managed.
Sectoral demand variance
Cyclical industries like electronics and autos drive volatile order volumes while life sciences show steadier demand; Kinaxis revenue mix cushions swings through multi-vertical deployments. Upside from semiconductor capacity expansions (TSMC capex ~USD 40B guidance for 2024) and accelerating EV production supports stronger S&OP demand. Downside risk if broad capex freezes or deeper inventory corrections occur, slowing cloud subscription growth.
- electronics/autos: high volume volatility
- life sciences: resilient recurring demand
- upside: semiconductor and EV capex
- downside: capex freezes/inventory corrections
Total cost of ownership and ROI
Customers now scrutinize payback as US federal funds hovered near 5.25%–5.50% in mid‑2025; Kinaxis concurrent planning drives demonstrable benefits—case studies report inventory reductions up to 30% and service‑level gains that often deliver ROI within 12 months—while pre‑built connectors shorten time‑to‑value and lower deployment risk; outcome‑based pricing can align incentives between vendor and buyer.
- Total cost pressure: higher rates compress acceptable payback windows
- ROI drivers: concurrent planning + fewer stockouts → measurable savings (up to 30% inventory)
- Risk reduction: pre‑built connectors = faster deployments
- Pricing: outcome‑based models align incentives
Reshoring, tariffs and data localization lengthen sales cycles to 9-18 months, spur regional hubs
Macro slowdowns curb IT spend (Gartner $4.7T 2024) and delay S&OP deals; growth cycles lift SaaS demand. Kinaxis revenue CAD 303.5M (FY2024) and subscription model reduce volatility but FX and churn risk remain. Inflation (US CPI 2023 3.4%) and fed funds ~5.25–5.50% (mid‑2025) shorten payback windows; concurrent planning claims up to 30% inventory cuts.
| Metric | Value |
|---|---|
| Global IT spend | $4.7T (2024) |
| Kinaxis revenue | CAD 303.5M (FY2024) |
| Inventory reduction | Up to 30% |
| Fed funds | 5.25–5.50% (mid‑2025) |
Full Version Awaits
Kinaxis PESTLE Analysis
The Kinaxis PESTLE Analysis preview shown here is the exact document you’ll receive after purchase—fully formatted and ready to use. The content, layout, and insights on political, economic, social, technological, legal, and environmental factors are final. No placeholders or teasers—this is the real file you’ll download immediately after checkout.











