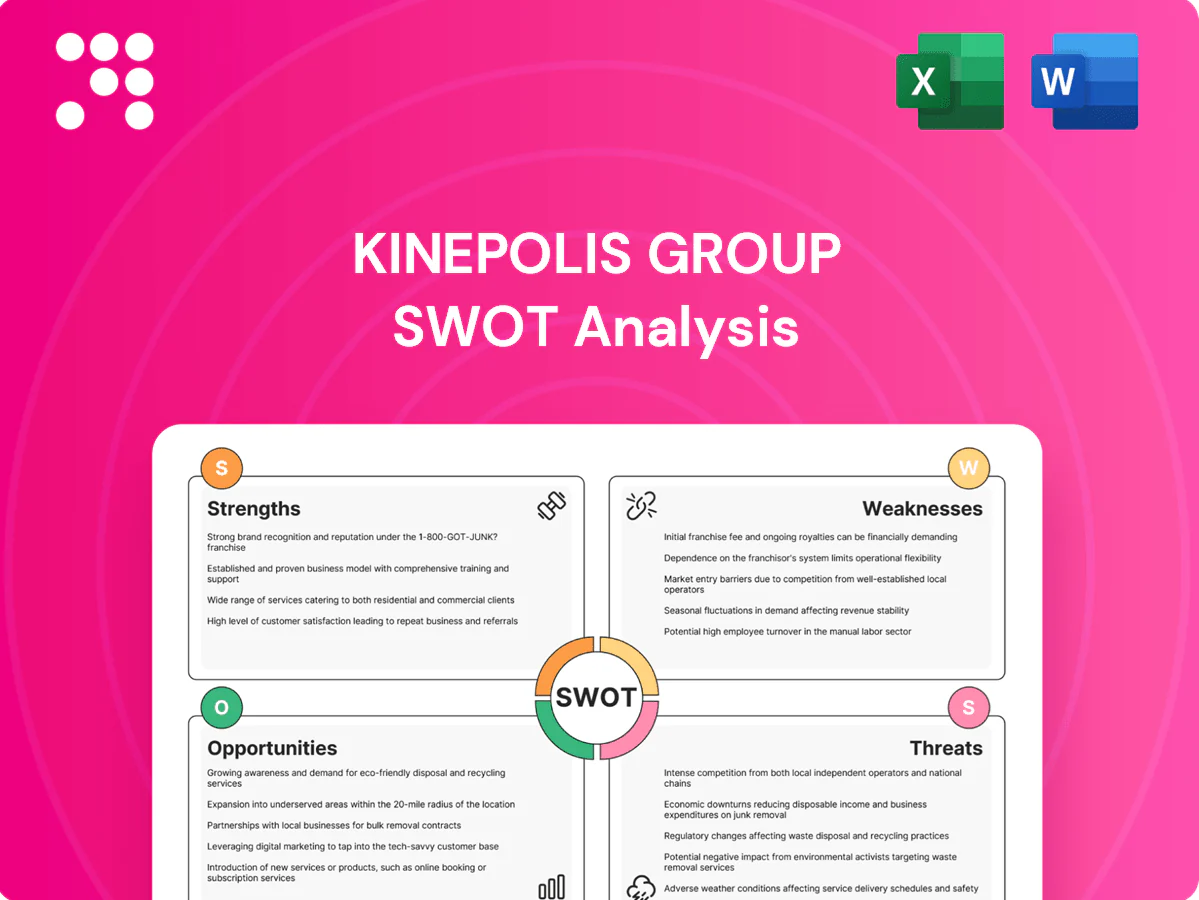
Kinepolis Group SWOT Analysis

Your Strategic Toolkit Starts Here
Kinepolis' strengths include a strong European footprint and premium cinematic experiences, while digital disruption, rising streaming competition, and cost pressures pose clear risks. Our full SWOT unpacks strategic opportunities, financial context, and mitigation tactics across 3–5 years. Purchase the complete, editable Word + Excel report to plan, pitch, and invest with confidence.
Strengths

Leading cinema operator footprint
Kinepolis leverages a leading footprint across Europe and North America, operating in 10 countries with over 100 cinemas and 1,000+ screens, which diversifies attendance and revenue streams. Its scale secures more favorable film rental terms and concentrates marketing spend, improving efficiency. The geographic spread cushions the group against local market volatility, while strong brand recognition drives customer trust and higher repeat visits.
Premium, modern infrastructure
Investment in state-of-the-art projection, sound and seating at Kinepolis (115 complexes, ~1,067 screens in 2024) elevates the movie experience and supports premium formats that typically command ~20% higher average ticket prices. Modern venues boost ancillary revenue from events and private rentals, contributing to diversified income streams. Rigorous quality standards differentiate Kinepolis from smaller competitors.

Customer-centric services
Data-driven programming and loyalty programs enable highly personalized film and offer recommendations, while seamless digital journeys—apps and online booking—cut friction at purchase and entry, boosting NPS and visit frequency; superior in-theatre service further increases repeat visits, and tailored offers measurably lift concession and upsell conversion rates.

Diverse revenue streams
Cinema ticket sales are boosted by higher-margin snacks, beverages and event programming, while private screenings, corporate events and alternative content raise seat utilization beyond blockbuster windows. On-site advertising and commercial partnerships provide steady ancillary income, and this mixed-revenue model reduces dependence on any single film slate, smoothing seasonal volatility.
- Ancillary sales: margin accretion
- Private/corporate: higher utilization
- Ads/partnerships: incremental income
- Revenue mix: seasonality buffer
Operational efficiency and know-how
Standardized processes and centralized procurement drive consistent cost control across Kinepolis operations, supporting margin resilience and faster site rollouts.
Lean staffing models combined with automation and analytics increase throughput and reduce per-screen labor costs while data-driven scheduling optimizes capacity and concessions revenue.
Proven rollout and refurbishment playbook shortens time-to-ROI for new and upgraded sites, accelerating payback and scaling best practices across markets.
- Operational scale
- Centralized procurement
- Lean staffing + automation
- Data-led scheduling
- Fast rollout/refurb playbook
Pan-European cinema leader: 10 countries, 115 complexes, ~1,067 screens, ~20% premium
Kinepolis operates in 10 countries with a leading footprint of 115 complexes and ~1,067 screens (2024), diversifying box office and geographic risk.
Scale secures better film rental terms, concentrated marketing efficiency and centralized procurement, supporting margin resilience and faster rollouts.
Investment in premium formats and digital loyalty drives higher AOV and repeat visits; premium formats command ~20% higher average ticket prices.
| Metric | Value (2024) |
|---|---|
| Countries | 10 |
| Complexes | 115 |
| Screens | ~1,067 |
| Premium price uplift | ~20% |
What is included in the product
 Detailed Word Document
Provides a concise SWOT analysis of Kinepolis Group, highlighting strengths like a premium cinema network and diversified revenue streams, weaknesses including capital intensity and market concentration, opportunities from digital expansion and experiential offerings, and threats from streaming competition and macroeconomic sensitivity.

 Customizable Excel Spreadsheet
Provides a concise SWOT matrix tailored to Kinepolis Group for fast, visual strategy alignment and identification of operational pain points. Editable format enables quick updates to reflect cinema-industry shifts, ideal for executives needing a snapshot for swift decision-making.
Weaknesses

High fixed-cost structure
Kinepolis faces a high fixed-cost structure—rent, long-term leases and salaried staffing create material operating leverage across its network of over 1,000 screens in 12 countries; attendance dips can quickly compress margins, while recurring maintenance and upgrade capex for premium projection and sound systems runs in the tens of millions yearly, making rapid cost flexing difficult.
Dependence on film slate quality
Box office performance hinges on studio timing and appeal, leaving Kinepolis exposed to swings in slate quality and release calendars. Limited control over the content pipeline heightens revenue volatility, amplified by industry disruptions such as the WGA strike (May 2–Sept 27, 2023) and SAG‑AFTRA strike (July 14–Nov 9, 2023) that delayed releases and depressed admissions. Dependence on tentpole titles concentrates risk and adds cyclicality to attendance.

Sensitivity to macro and discretionary spend
Kinepolis remains highly sensitive to macro and discretionary spend: inflation and weak consumer confidence have reduced visits and concessions across its markets (Belgium, France, Netherlands, Spain, Switzerland, Poland, Luxembourg, Canada). Rising utility and wage costs since the 2021–2023 energy shock continue to pressure margins. Currency swings across these regions distort reported results. Price hikes risk exposing demand elasticity and lower footfall.

Limited diversification beyond cinemas
Non-cinema ventures remain modest versus core box office: FY 2023 group revenue €1.14bn with 51.5m admissions, while ancillary activities contribute a small share of total turnover, leaving the group heavily dependent on theater receipts. This overreliance constrains resilience to structural shifts (streaming, windowing changes) and limits upside from content ownership and digital monetization. The portfolio lacks strong countercyclical buffers.
- FY 2023 revenue: €1.14bn; admissions: 51.5m
- Non-cinema activities: minor share of turnover
- High exposure to box office cycles
- Limited streaming/content ownership footprint
Debt and lease commitments
Expansion and refurbishments have raised Kinepolis Group's leverage, while recent ECB rate hikes increase financing costs and tighten interest cover; covenant headroom may contract in economic slowdowns, and sizeable lease liabilities under IFRS 16 limit near-term financial flexibility.
- Leverage elevated by capex and M&A
- Higher rates → rising interest expense
- Covenant risk in downturns
- Lease liabilities reduce liquidity and flexibility
High fixed costs, rising rates and strikes squeeze cinema margins and cash flow
Kinepolis has high fixed costs and annual capex needs that compress margins when admissions fall; FY2023 revenue €1.14bn with 51.5m admissions underscores box‑office dependence. Limited control over studio slate and 2023 WGA/SAG‑AFTRA strikes increased revenue volatility. Non‑cinema activities remain a minor share, while rising rates and substantial lease liabilities constrain financial flexibility.
| Metric | Value |
|---|---|
| FY2023 revenue | €1.14bn |
| Admissions | 51.5m |
| Key risks | Studio timing, 2023 strikes, rates, leases |
Preview Before You Purchase
Kinepolis Group SWOT Analysis
This is the actual SWOT analysis for Kinepolis Group you’ll receive upon purchase—no surprises, just professional quality. The preview below is taken directly from the full SWOT report you'll get; purchase unlocks the entire in-depth, editable version. The content is structured, actionable and ready for immediate download after checkout.

Your Strategic Toolkit Starts Here
Kinepolis' strengths include a strong European footprint and premium cinematic experiences, while digital disruption, rising streaming competition, and cost pressures pose clear risks. Our full SWOT unpacks strategic opportunities, financial context, and mitigation tactics across 3–5 years. Purchase the complete, editable Word + Excel report to plan, pitch, and invest with confidence.
Strengths
Leading cinema operator footprint
Kinepolis leverages a leading footprint across Europe and North America, operating in 10 countries with over 100 cinemas and 1,000+ screens, which diversifies attendance and revenue streams. Its scale secures more favorable film rental terms and concentrates marketing spend, improving efficiency. The geographic spread cushions the group against local market volatility, while strong brand recognition drives customer trust and higher repeat visits.
Premium, modern infrastructure
Investment in state-of-the-art projection, sound and seating at Kinepolis (115 complexes, ~1,067 screens in 2024) elevates the movie experience and supports premium formats that typically command ~20% higher average ticket prices. Modern venues boost ancillary revenue from events and private rentals, contributing to diversified income streams. Rigorous quality standards differentiate Kinepolis from smaller competitors.
Customer-centric services
Data-driven programming and loyalty programs enable highly personalized film and offer recommendations, while seamless digital journeys—apps and online booking—cut friction at purchase and entry, boosting NPS and visit frequency; superior in-theatre service further increases repeat visits, and tailored offers measurably lift concession and upsell conversion rates.
Diverse revenue streams
Cinema ticket sales are boosted by higher-margin snacks, beverages and event programming, while private screenings, corporate events and alternative content raise seat utilization beyond blockbuster windows. On-site advertising and commercial partnerships provide steady ancillary income, and this mixed-revenue model reduces dependence on any single film slate, smoothing seasonal volatility.
- Ancillary sales: margin accretion
- Private/corporate: higher utilization
- Ads/partnerships: incremental income
- Revenue mix: seasonality buffer
Operational efficiency and know-how
Standardized processes and centralized procurement drive consistent cost control across Kinepolis operations, supporting margin resilience and faster site rollouts.
Lean staffing models combined with automation and analytics increase throughput and reduce per-screen labor costs while data-driven scheduling optimizes capacity and concessions revenue.
Proven rollout and refurbishment playbook shortens time-to-ROI for new and upgraded sites, accelerating payback and scaling best practices across markets.
- Operational scale
- Centralized procurement
- Lean staffing + automation
- Data-led scheduling
- Fast rollout/refurb playbook
Pan-European cinema leader: 10 countries, 115 complexes, ~1,067 screens, ~20% premium
Kinepolis operates in 10 countries with a leading footprint of 115 complexes and ~1,067 screens (2024), diversifying box office and geographic risk.
Scale secures better film rental terms, concentrated marketing efficiency and centralized procurement, supporting margin resilience and faster rollouts.
Investment in premium formats and digital loyalty drives higher AOV and repeat visits; premium formats command ~20% higher average ticket prices.
| Metric | Value (2024) |
|---|---|
| Countries | 10 |
| Complexes | 115 |
| Screens | ~1,067 |
| Premium price uplift | ~20% |
What is included in the product
Detailed Word Document
Provides a concise SWOT analysis of Kinepolis Group, highlighting strengths like a premium cinema network and diversified revenue streams, weaknesses including capital intensity and market concentration, opportunities from digital expansion and experiential offerings, and threats from streaming competition and macroeconomic sensitivity.
Customizable Excel Spreadsheet
Provides a concise SWOT matrix tailored to Kinepolis Group for fast, visual strategy alignment and identification of operational pain points. Editable format enables quick updates to reflect cinema-industry shifts, ideal for executives needing a snapshot for swift decision-making.
Weaknesses
High fixed-cost structure
Kinepolis faces a high fixed-cost structure—rent, long-term leases and salaried staffing create material operating leverage across its network of over 1,000 screens in 12 countries; attendance dips can quickly compress margins, while recurring maintenance and upgrade capex for premium projection and sound systems runs in the tens of millions yearly, making rapid cost flexing difficult.
Dependence on film slate quality
Box office performance hinges on studio timing and appeal, leaving Kinepolis exposed to swings in slate quality and release calendars. Limited control over the content pipeline heightens revenue volatility, amplified by industry disruptions such as the WGA strike (May 2–Sept 27, 2023) and SAG‑AFTRA strike (July 14–Nov 9, 2023) that delayed releases and depressed admissions. Dependence on tentpole titles concentrates risk and adds cyclicality to attendance.
Sensitivity to macro and discretionary spend
Kinepolis remains highly sensitive to macro and discretionary spend: inflation and weak consumer confidence have reduced visits and concessions across its markets (Belgium, France, Netherlands, Spain, Switzerland, Poland, Luxembourg, Canada). Rising utility and wage costs since the 2021–2023 energy shock continue to pressure margins. Currency swings across these regions distort reported results. Price hikes risk exposing demand elasticity and lower footfall.
Limited diversification beyond cinemas
Non-cinema ventures remain modest versus core box office: FY 2023 group revenue €1.14bn with 51.5m admissions, while ancillary activities contribute a small share of total turnover, leaving the group heavily dependent on theater receipts. This overreliance constrains resilience to structural shifts (streaming, windowing changes) and limits upside from content ownership and digital monetization. The portfolio lacks strong countercyclical buffers.
- FY 2023 revenue: €1.14bn; admissions: 51.5m
- Non-cinema activities: minor share of turnover
- High exposure to box office cycles
- Limited streaming/content ownership footprint
Debt and lease commitments
Expansion and refurbishments have raised Kinepolis Group's leverage, while recent ECB rate hikes increase financing costs and tighten interest cover; covenant headroom may contract in economic slowdowns, and sizeable lease liabilities under IFRS 16 limit near-term financial flexibility.
- Leverage elevated by capex and M&A
- Higher rates → rising interest expense
- Covenant risk in downturns
- Lease liabilities reduce liquidity and flexibility
High fixed costs, rising rates and strikes squeeze cinema margins and cash flow
Kinepolis has high fixed costs and annual capex needs that compress margins when admissions fall; FY2023 revenue €1.14bn with 51.5m admissions underscores box‑office dependence. Limited control over studio slate and 2023 WGA/SAG‑AFTRA strikes increased revenue volatility. Non‑cinema activities remain a minor share, while rising rates and substantial lease liabilities constrain financial flexibility.
| Metric | Value |
|---|---|
| FY2023 revenue | €1.14bn |
| Admissions | 51.5m |
| Key risks | Studio timing, 2023 strikes, rates, leases |
Preview Before You Purchase
Kinepolis Group SWOT Analysis
This is the actual SWOT analysis for Kinepolis Group you’ll receive upon purchase—no surprises, just professional quality. The preview below is taken directly from the full SWOT report you'll get; purchase unlocks the entire in-depth, editable version. The content is structured, actionable and ready for immediate download after checkout.
Original: $10.00
-65%$10.00
$3.50Description
Your Strategic Toolkit Starts Here
Kinepolis' strengths include a strong European footprint and premium cinematic experiences, while digital disruption, rising streaming competition, and cost pressures pose clear risks. Our full SWOT unpacks strategic opportunities, financial context, and mitigation tactics across 3–5 years. Purchase the complete, editable Word + Excel report to plan, pitch, and invest with confidence.
Strengths
Leading cinema operator footprint
Kinepolis leverages a leading footprint across Europe and North America, operating in 10 countries with over 100 cinemas and 1,000+ screens, which diversifies attendance and revenue streams. Its scale secures more favorable film rental terms and concentrates marketing spend, improving efficiency. The geographic spread cushions the group against local market volatility, while strong brand recognition drives customer trust and higher repeat visits.
Premium, modern infrastructure
Investment in state-of-the-art projection, sound and seating at Kinepolis (115 complexes, ~1,067 screens in 2024) elevates the movie experience and supports premium formats that typically command ~20% higher average ticket prices. Modern venues boost ancillary revenue from events and private rentals, contributing to diversified income streams. Rigorous quality standards differentiate Kinepolis from smaller competitors.
Customer-centric services
Data-driven programming and loyalty programs enable highly personalized film and offer recommendations, while seamless digital journeys—apps and online booking—cut friction at purchase and entry, boosting NPS and visit frequency; superior in-theatre service further increases repeat visits, and tailored offers measurably lift concession and upsell conversion rates.
Diverse revenue streams
Cinema ticket sales are boosted by higher-margin snacks, beverages and event programming, while private screenings, corporate events and alternative content raise seat utilization beyond blockbuster windows. On-site advertising and commercial partnerships provide steady ancillary income, and this mixed-revenue model reduces dependence on any single film slate, smoothing seasonal volatility.
- Ancillary sales: margin accretion
- Private/corporate: higher utilization
- Ads/partnerships: incremental income
- Revenue mix: seasonality buffer
Operational efficiency and know-how
Standardized processes and centralized procurement drive consistent cost control across Kinepolis operations, supporting margin resilience and faster site rollouts.
Lean staffing models combined with automation and analytics increase throughput and reduce per-screen labor costs while data-driven scheduling optimizes capacity and concessions revenue.
Proven rollout and refurbishment playbook shortens time-to-ROI for new and upgraded sites, accelerating payback and scaling best practices across markets.
- Operational scale
- Centralized procurement
- Lean staffing + automation
- Data-led scheduling
- Fast rollout/refurb playbook
Pan-European cinema leader: 10 countries, 115 complexes, ~1,067 screens, ~20% premium
Kinepolis operates in 10 countries with a leading footprint of 115 complexes and ~1,067 screens (2024), diversifying box office and geographic risk.
Scale secures better film rental terms, concentrated marketing efficiency and centralized procurement, supporting margin resilience and faster rollouts.
Investment in premium formats and digital loyalty drives higher AOV and repeat visits; premium formats command ~20% higher average ticket prices.
| Metric | Value (2024) |
|---|---|
| Countries | 10 |
| Complexes | 115 |
| Screens | ~1,067 |
| Premium price uplift | ~20% |
What is included in the product
Detailed Word Document
Provides a concise SWOT analysis of Kinepolis Group, highlighting strengths like a premium cinema network and diversified revenue streams, weaknesses including capital intensity and market concentration, opportunities from digital expansion and experiential offerings, and threats from streaming competition and macroeconomic sensitivity.
Customizable Excel Spreadsheet
Provides a concise SWOT matrix tailored to Kinepolis Group for fast, visual strategy alignment and identification of operational pain points. Editable format enables quick updates to reflect cinema-industry shifts, ideal for executives needing a snapshot for swift decision-making.
Weaknesses
High fixed-cost structure
Kinepolis faces a high fixed-cost structure—rent, long-term leases and salaried staffing create material operating leverage across its network of over 1,000 screens in 12 countries; attendance dips can quickly compress margins, while recurring maintenance and upgrade capex for premium projection and sound systems runs in the tens of millions yearly, making rapid cost flexing difficult.
Dependence on film slate quality
Box office performance hinges on studio timing and appeal, leaving Kinepolis exposed to swings in slate quality and release calendars. Limited control over the content pipeline heightens revenue volatility, amplified by industry disruptions such as the WGA strike (May 2–Sept 27, 2023) and SAG‑AFTRA strike (July 14–Nov 9, 2023) that delayed releases and depressed admissions. Dependence on tentpole titles concentrates risk and adds cyclicality to attendance.
Sensitivity to macro and discretionary spend
Kinepolis remains highly sensitive to macro and discretionary spend: inflation and weak consumer confidence have reduced visits and concessions across its markets (Belgium, France, Netherlands, Spain, Switzerland, Poland, Luxembourg, Canada). Rising utility and wage costs since the 2021–2023 energy shock continue to pressure margins. Currency swings across these regions distort reported results. Price hikes risk exposing demand elasticity and lower footfall.
Limited diversification beyond cinemas
Non-cinema ventures remain modest versus core box office: FY 2023 group revenue €1.14bn with 51.5m admissions, while ancillary activities contribute a small share of total turnover, leaving the group heavily dependent on theater receipts. This overreliance constrains resilience to structural shifts (streaming, windowing changes) and limits upside from content ownership and digital monetization. The portfolio lacks strong countercyclical buffers.
- FY 2023 revenue: €1.14bn; admissions: 51.5m
- Non-cinema activities: minor share of turnover
- High exposure to box office cycles
- Limited streaming/content ownership footprint
Debt and lease commitments
Expansion and refurbishments have raised Kinepolis Group's leverage, while recent ECB rate hikes increase financing costs and tighten interest cover; covenant headroom may contract in economic slowdowns, and sizeable lease liabilities under IFRS 16 limit near-term financial flexibility.
- Leverage elevated by capex and M&A
- Higher rates → rising interest expense
- Covenant risk in downturns
- Lease liabilities reduce liquidity and flexibility
High fixed costs, rising rates and strikes squeeze cinema margins and cash flow
Kinepolis has high fixed costs and annual capex needs that compress margins when admissions fall; FY2023 revenue €1.14bn with 51.5m admissions underscores box‑office dependence. Limited control over studio slate and 2023 WGA/SAG‑AFTRA strikes increased revenue volatility. Non‑cinema activities remain a minor share, while rising rates and substantial lease liabilities constrain financial flexibility.
| Metric | Value |
|---|---|
| FY2023 revenue | €1.14bn |
| Admissions | 51.5m |
| Key risks | Studio timing, 2023 strikes, rates, leases |
Preview Before You Purchase
Kinepolis Group SWOT Analysis
This is the actual SWOT analysis for Kinepolis Group you’ll receive upon purchase—no surprises, just professional quality. The preview below is taken directly from the full SWOT report you'll get; purchase unlocks the entire in-depth, editable version. The content is structured, actionable and ready for immediate download after checkout.











