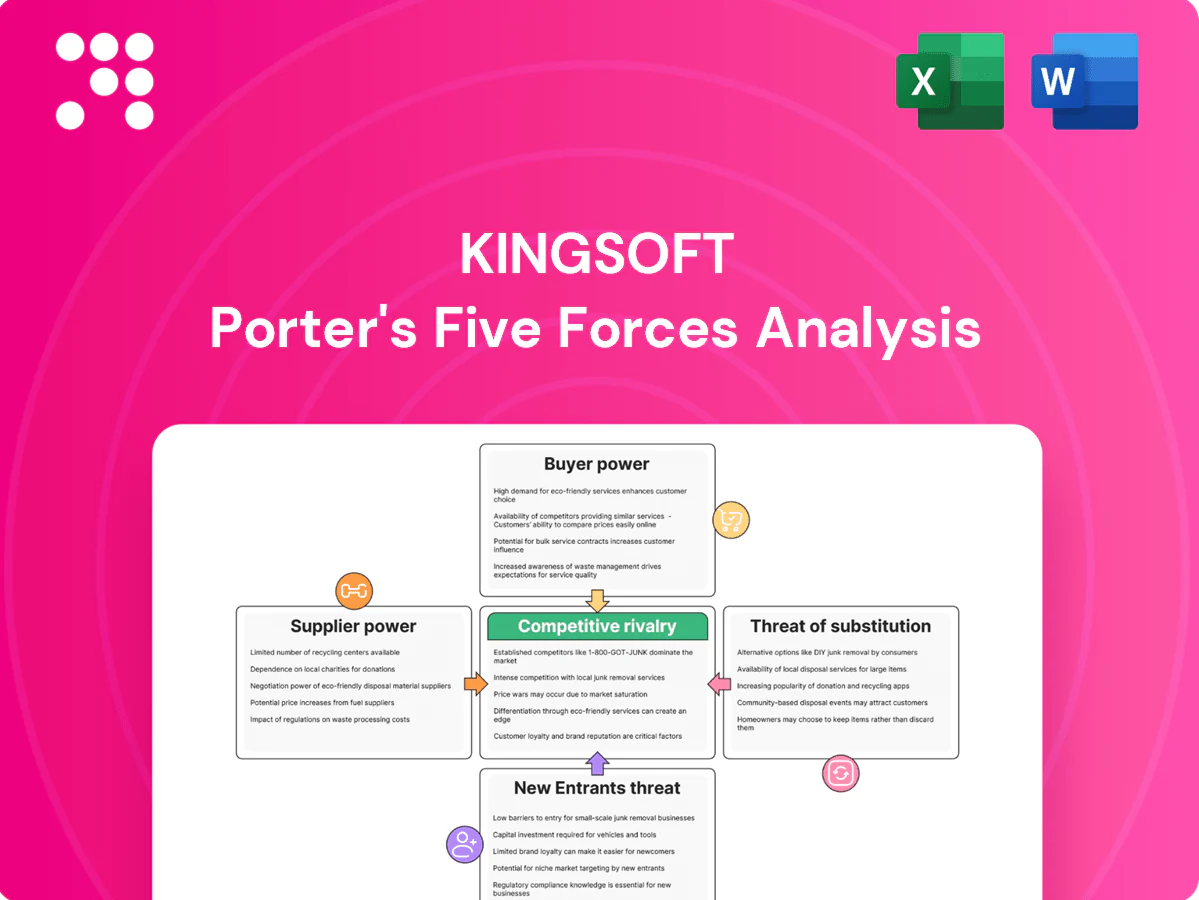
Kingsoft Porter's Five Forces Analysis

From Overview to Strategy Blueprint
Kingsoft's Porter's Five Forces snapshot highlights supplier bargaining, buyer power, competitive rivalry, threat of entrants and substitutes and their impact on margins. It surfaces key strategic pressures and opportunity areas for growth. This brief only scratches the surface. Unlock the full Porter's Five Forces Analysis to explore Kingsoft’s competitive dynamics in depth.
Suppliers Bargaining Power

Concentrated core tech vendors
Kingsoft relies on a concentrated set of CPU, GPU and database vendors, with Intel holding roughly 60% of x86 server CPU share in 2023 (IDC) and NVIDIA commanding about 80% of datacenter AI GPU shipments in 2024, raising switching costs and supplier leverage on price and roadmaps. Domestic Chinese alternatives (Huawei GaussDB, Alibaba PolarDB, Tencent TDSQL) and multi-sourcing lower that leverage, while long-term volume commitments secure improved terms.
Platform gatekeepers and app stores
Distribution for WPS and games relies heavily on Apple App Store and Google Play (commissions up to 30% with 15% tiers for developers under $1M), plus Windows ecosystem gatekeepers that can dictate fees and policies.
Gatekeeper control materially affects discoverability and monetization, forcing Kingsoft to use direct-downloads and partner channels to mitigate dependence.
EU Digital Markets Act enforcement in 2024 and ongoing regulatory scrutiny have modestly rebalanced power by enabling alternative stores and sideloading options.

Network bandwidth and data center partners
Cloud operations force Kingsoft to rely on ISPs, colocation and power providers with regional footprints; the global colocation market reached roughly $70 billion in 2024, concentrating capacity in a few hubs. Limited high-tier facilities in some cities — top 10 metros held about 60% of hyperscale/colocation capacity in 2024 — raises supplier leverage. Long-term leases or self-built capacity reduce exposure but require heavy capex. Volatile energy prices, with power often ~30% of data center OPEX, further tighten supplier influence.

Talent, studios, and content licensors
Game development and security research hinge on scarce creative and technical talent; the global games market was about $196 billion in 2023, amplifying demand for top developers. Star studios and IP holders frequently secure upfront fees and revenue shares, squeezing margins. Retention programs and in-house IP creation mitigate supplier power, while competition for AI/ML talent (median US ML engineer pay ~146,000 in 2024) raises costs.
- Talent scarcity: high bargaining leverage
- IP licensors: upfront fees + rev share pressure
- Mitigants: retention, in-house IP
- AI/ML hiring: salary-driven cost inflation
Third-party SDKs and compliance tooling
Analytics, payments, anti-cheat and AI models are largely integrated via external SDKs, with 2024 surveys reporting about 75% of game studios relying on third-party tooling; vendor lock-in and 6–12 month certification cycles raise switching friction. Kingsoft can develop substitutes or negotiate bundled deals, but long timelines and certifications limit immediate leverage; open-source alternatives partially offset dependency.
- High dependency: ~75% studios use external SDKs
- Switching cost: 6–12 month certification cycles
- Leverage: bundle negotiations vs build timelines
- Mitigation: open-source reduces but does not eliminate risk
High supplier concentration raises costs, switching friction and talent pressure
Supplier power is high: Intel ~60% x86 CPU share (2023), NVIDIA ~80% datacenter AI GPU shipments (2024) and App Store/Play fees up to 30% (15% tier) raise costs and switching friction. Colocation market ~$70B (2024) with top‑10 metros ~60% capacity and power ~30% of DC OPEX concentrates leverage. Talent/SDK dependence (75% studios use third‑party tools; median ML pay ~$146k in 2024) sustains bargaining pressure.
| Supplier area | Key metric (2023/24) | Impact |
|---|---|---|
| CPUs/GPUs | Intel 60% / NVIDIA 80% | High price/roadmap leverage |
| App stores | Fees 30% (15% tier) | Monetization cuts |
| Colocation | $70B; top10 60% | Capacity concentration |
| Talent/SDKs | 75% use; ML pay $146k | Costly retention/switching |
What is included in the product
 Detailed Word Document
Concise Porter's Five Forces analysis for Kingsoft, assessing competitive rivalry, buyer and supplier power, threat of new entrants and substitutes, and identifying strategic levers to protect market share and profitability.

 Customizable Excel Spreadsheet
Clear Kingsoft-focused Five Forces one-sheet—instantly shows supplier/buyer power, rivalry intensity, new entrant and substitute threats to speed strategic decisions and boardroom briefings.
Customers Bargaining Power

Low switching costs in productivity suites
Enterprise and consumer users can switch among WPS, Microsoft Office, and Google Workspace with high file compatibility, and WPS reports over 400 million global users as of 2024, increasing buyer options. Freemium models (industry conversion often below 5%) amplify price sensitivity and drive churn. Kingsoft counters with local support, lower total cost of ownership and government alignment in China. Feature parity and migration tools remain key to dampen buyer power.
Enterprise and government procurement clout
Large Chinese SOEs and government agencies wield significant procurement clout, negotiating volume discounts and stringent security/localization clauses; in 2024 sales cycles for such deals commonly span 6–12 months. Compliance and localization give Kingsoft a competitive edge but lengthen procurement timelines. Custom on-prem or hybrid deployments increase perceived buyer power by raising switching costs. Once secured, multi-year contracts (typically 3–5 years) help stabilize pricing power.

Gaming players’ fickle preferences
Players can churn rapidly across titles with minimal friction: industry averages show Day 1 retention near 25% and Day 30 retention around 4% in 2024, pressuring studios to sustain engagement. Content freshness and live-ops quality dictate monetization resilience, with live events driving spikes in ARPDAU. Promotional pricing and events push user acquisition costs—global mobile CPI averaged about $1.70 in 2024—reflecting buyer leverage. Cross-title ecosystems and strong IP loyalty can moderate churn by increasing lifetime value.

Cloud clients sensitive to price-performance
Cloud clients in China benchmark IaaS/PaaS offers primarily against Alibaba Cloud (about 39% market share in 2024), Tencent Cloud and Huawei Cloud, making transparent pricing and reserved-instance discounts (up to 70%) drive tight price-performance comparisons. Managed services increase workload stickiness and reduce buyer power over time, while initial trials and credits (commonly up to $300 equivalent) boost early leverage.
- Benchmarking: Alibaba ~39% (2024)
- Reserved discounts: up to 70%
- Managed services: higher stickiness, lower long-term buyer power
- Trials/credits: up to $300 equivalent enhance early leverage
Security software commoditization
- free/bundled adoption ~60%
- enterprise SLA premium ~+20%
- brand trust lifts renewals ~+12%
- key differentiators: detection accuracy, low impact, compliance
Competition raises buyer pressure; 400M users and 39% cloud share
Enterprise and consumer users can switch among WPS, MS Office and Google Workspace; WPS reports 400M users (2024), raising buyer options and price sensitivity. Large Chinese SOEs/govt negotiate discounts; typical deals 6–12 months and contracts 3–5 years. Cloud benchmarking vs Alibaba (~39% share 2024) tightens pricing; managed services raise stickiness and reduce buyer power.
| Metric | 2024 |
|---|---|
| WPS users | 400M |
| Alibaba cloud share | 39% |
| Sales cycle | 6–12m |
| Contract length | 3–5y |
Full Version Awaits
Kingsoft Porter's Five Forces Analysis
This preview shows the exact Kingsoft Porter's Five Forces Analysis you'll receive immediately after purchase—no surprises, no placeholders. The report is a complete, professionally formatted assessment covering competitive rivalry, supplier and buyer power, threats of new entrants and substitutes, and strategic implications. It's ready for download and use the moment you buy. Instant access, no customization required.

From Overview to Strategy Blueprint
Kingsoft's Porter's Five Forces snapshot highlights supplier bargaining, buyer power, competitive rivalry, threat of entrants and substitutes and their impact on margins. It surfaces key strategic pressures and opportunity areas for growth. This brief only scratches the surface. Unlock the full Porter's Five Forces Analysis to explore Kingsoft’s competitive dynamics in depth.
Suppliers Bargaining Power
Concentrated core tech vendors
Kingsoft relies on a concentrated set of CPU, GPU and database vendors, with Intel holding roughly 60% of x86 server CPU share in 2023 (IDC) and NVIDIA commanding about 80% of datacenter AI GPU shipments in 2024, raising switching costs and supplier leverage on price and roadmaps. Domestic Chinese alternatives (Huawei GaussDB, Alibaba PolarDB, Tencent TDSQL) and multi-sourcing lower that leverage, while long-term volume commitments secure improved terms.
Platform gatekeepers and app stores
Distribution for WPS and games relies heavily on Apple App Store and Google Play (commissions up to 30% with 15% tiers for developers under $1M), plus Windows ecosystem gatekeepers that can dictate fees and policies.
Gatekeeper control materially affects discoverability and monetization, forcing Kingsoft to use direct-downloads and partner channels to mitigate dependence.
EU Digital Markets Act enforcement in 2024 and ongoing regulatory scrutiny have modestly rebalanced power by enabling alternative stores and sideloading options.
Network bandwidth and data center partners
Cloud operations force Kingsoft to rely on ISPs, colocation and power providers with regional footprints; the global colocation market reached roughly $70 billion in 2024, concentrating capacity in a few hubs. Limited high-tier facilities in some cities — top 10 metros held about 60% of hyperscale/colocation capacity in 2024 — raises supplier leverage. Long-term leases or self-built capacity reduce exposure but require heavy capex. Volatile energy prices, with power often ~30% of data center OPEX, further tighten supplier influence.
Talent, studios, and content licensors
Game development and security research hinge on scarce creative and technical talent; the global games market was about $196 billion in 2023, amplifying demand for top developers. Star studios and IP holders frequently secure upfront fees and revenue shares, squeezing margins. Retention programs and in-house IP creation mitigate supplier power, while competition for AI/ML talent (median US ML engineer pay ~146,000 in 2024) raises costs.
- Talent scarcity: high bargaining leverage
- IP licensors: upfront fees + rev share pressure
- Mitigants: retention, in-house IP
- AI/ML hiring: salary-driven cost inflation
Third-party SDKs and compliance tooling
Analytics, payments, anti-cheat and AI models are largely integrated via external SDKs, with 2024 surveys reporting about 75% of game studios relying on third-party tooling; vendor lock-in and 6–12 month certification cycles raise switching friction. Kingsoft can develop substitutes or negotiate bundled deals, but long timelines and certifications limit immediate leverage; open-source alternatives partially offset dependency.
- High dependency: ~75% studios use external SDKs
- Switching cost: 6–12 month certification cycles
- Leverage: bundle negotiations vs build timelines
- Mitigation: open-source reduces but does not eliminate risk
High supplier concentration raises costs, switching friction and talent pressure
Supplier power is high: Intel ~60% x86 CPU share (2023), NVIDIA ~80% datacenter AI GPU shipments (2024) and App Store/Play fees up to 30% (15% tier) raise costs and switching friction. Colocation market ~$70B (2024) with top‑10 metros ~60% capacity and power ~30% of DC OPEX concentrates leverage. Talent/SDK dependence (75% studios use third‑party tools; median ML pay ~$146k in 2024) sustains bargaining pressure.
| Supplier area | Key metric (2023/24) | Impact |
|---|---|---|
| CPUs/GPUs | Intel 60% / NVIDIA 80% | High price/roadmap leverage |
| App stores | Fees 30% (15% tier) | Monetization cuts |
| Colocation | $70B; top10 60% | Capacity concentration |
| Talent/SDKs | 75% use; ML pay $146k | Costly retention/switching |
What is included in the product
Detailed Word Document
Concise Porter's Five Forces analysis for Kingsoft, assessing competitive rivalry, buyer and supplier power, threat of new entrants and substitutes, and identifying strategic levers to protect market share and profitability.
Customizable Excel Spreadsheet
Clear Kingsoft-focused Five Forces one-sheet—instantly shows supplier/buyer power, rivalry intensity, new entrant and substitute threats to speed strategic decisions and boardroom briefings.
Customers Bargaining Power
Low switching costs in productivity suites
Enterprise and consumer users can switch among WPS, Microsoft Office, and Google Workspace with high file compatibility, and WPS reports over 400 million global users as of 2024, increasing buyer options. Freemium models (industry conversion often below 5%) amplify price sensitivity and drive churn. Kingsoft counters with local support, lower total cost of ownership and government alignment in China. Feature parity and migration tools remain key to dampen buyer power.
Enterprise and government procurement clout
Large Chinese SOEs and government agencies wield significant procurement clout, negotiating volume discounts and stringent security/localization clauses; in 2024 sales cycles for such deals commonly span 6–12 months. Compliance and localization give Kingsoft a competitive edge but lengthen procurement timelines. Custom on-prem or hybrid deployments increase perceived buyer power by raising switching costs. Once secured, multi-year contracts (typically 3–5 years) help stabilize pricing power.
Gaming players’ fickle preferences
Players can churn rapidly across titles with minimal friction: industry averages show Day 1 retention near 25% and Day 30 retention around 4% in 2024, pressuring studios to sustain engagement. Content freshness and live-ops quality dictate monetization resilience, with live events driving spikes in ARPDAU. Promotional pricing and events push user acquisition costs—global mobile CPI averaged about $1.70 in 2024—reflecting buyer leverage. Cross-title ecosystems and strong IP loyalty can moderate churn by increasing lifetime value.
Cloud clients sensitive to price-performance
Cloud clients in China benchmark IaaS/PaaS offers primarily against Alibaba Cloud (about 39% market share in 2024), Tencent Cloud and Huawei Cloud, making transparent pricing and reserved-instance discounts (up to 70%) drive tight price-performance comparisons. Managed services increase workload stickiness and reduce buyer power over time, while initial trials and credits (commonly up to $300 equivalent) boost early leverage.
- Benchmarking: Alibaba ~39% (2024)
- Reserved discounts: up to 70%
- Managed services: higher stickiness, lower long-term buyer power
- Trials/credits: up to $300 equivalent enhance early leverage
Security software commoditization
- free/bundled adoption ~60%
- enterprise SLA premium ~+20%
- brand trust lifts renewals ~+12%
- key differentiators: detection accuracy, low impact, compliance
Competition raises buyer pressure; 400M users and 39% cloud share
Enterprise and consumer users can switch among WPS, MS Office and Google Workspace; WPS reports 400M users (2024), raising buyer options and price sensitivity. Large Chinese SOEs/govt negotiate discounts; typical deals 6–12 months and contracts 3–5 years. Cloud benchmarking vs Alibaba (~39% share 2024) tightens pricing; managed services raise stickiness and reduce buyer power.
| Metric | 2024 |
|---|---|
| WPS users | 400M |
| Alibaba cloud share | 39% |
| Sales cycle | 6–12m |
| Contract length | 3–5y |
Full Version Awaits
Kingsoft Porter's Five Forces Analysis
This preview shows the exact Kingsoft Porter's Five Forces Analysis you'll receive immediately after purchase—no surprises, no placeholders. The report is a complete, professionally formatted assessment covering competitive rivalry, supplier and buyer power, threats of new entrants and substitutes, and strategic implications. It's ready for download and use the moment you buy. Instant access, no customization required.
Description
From Overview to Strategy Blueprint
Kingsoft's Porter's Five Forces snapshot highlights supplier bargaining, buyer power, competitive rivalry, threat of entrants and substitutes and their impact on margins. It surfaces key strategic pressures and opportunity areas for growth. This brief only scratches the surface. Unlock the full Porter's Five Forces Analysis to explore Kingsoft’s competitive dynamics in depth.
Suppliers Bargaining Power
Concentrated core tech vendors
Kingsoft relies on a concentrated set of CPU, GPU and database vendors, with Intel holding roughly 60% of x86 server CPU share in 2023 (IDC) and NVIDIA commanding about 80% of datacenter AI GPU shipments in 2024, raising switching costs and supplier leverage on price and roadmaps. Domestic Chinese alternatives (Huawei GaussDB, Alibaba PolarDB, Tencent TDSQL) and multi-sourcing lower that leverage, while long-term volume commitments secure improved terms.
Platform gatekeepers and app stores
Distribution for WPS and games relies heavily on Apple App Store and Google Play (commissions up to 30% with 15% tiers for developers under $1M), plus Windows ecosystem gatekeepers that can dictate fees and policies.
Gatekeeper control materially affects discoverability and monetization, forcing Kingsoft to use direct-downloads and partner channels to mitigate dependence.
EU Digital Markets Act enforcement in 2024 and ongoing regulatory scrutiny have modestly rebalanced power by enabling alternative stores and sideloading options.
Network bandwidth and data center partners
Cloud operations force Kingsoft to rely on ISPs, colocation and power providers with regional footprints; the global colocation market reached roughly $70 billion in 2024, concentrating capacity in a few hubs. Limited high-tier facilities in some cities — top 10 metros held about 60% of hyperscale/colocation capacity in 2024 — raises supplier leverage. Long-term leases or self-built capacity reduce exposure but require heavy capex. Volatile energy prices, with power often ~30% of data center OPEX, further tighten supplier influence.
Talent, studios, and content licensors
Game development and security research hinge on scarce creative and technical talent; the global games market was about $196 billion in 2023, amplifying demand for top developers. Star studios and IP holders frequently secure upfront fees and revenue shares, squeezing margins. Retention programs and in-house IP creation mitigate supplier power, while competition for AI/ML talent (median US ML engineer pay ~146,000 in 2024) raises costs.
- Talent scarcity: high bargaining leverage
- IP licensors: upfront fees + rev share pressure
- Mitigants: retention, in-house IP
- AI/ML hiring: salary-driven cost inflation
Third-party SDKs and compliance tooling
Analytics, payments, anti-cheat and AI models are largely integrated via external SDKs, with 2024 surveys reporting about 75% of game studios relying on third-party tooling; vendor lock-in and 6–12 month certification cycles raise switching friction. Kingsoft can develop substitutes or negotiate bundled deals, but long timelines and certifications limit immediate leverage; open-source alternatives partially offset dependency.
- High dependency: ~75% studios use external SDKs
- Switching cost: 6–12 month certification cycles
- Leverage: bundle negotiations vs build timelines
- Mitigation: open-source reduces but does not eliminate risk
High supplier concentration raises costs, switching friction and talent pressure
Supplier power is high: Intel ~60% x86 CPU share (2023), NVIDIA ~80% datacenter AI GPU shipments (2024) and App Store/Play fees up to 30% (15% tier) raise costs and switching friction. Colocation market ~$70B (2024) with top‑10 metros ~60% capacity and power ~30% of DC OPEX concentrates leverage. Talent/SDK dependence (75% studios use third‑party tools; median ML pay ~$146k in 2024) sustains bargaining pressure.
| Supplier area | Key metric (2023/24) | Impact |
|---|---|---|
| CPUs/GPUs | Intel 60% / NVIDIA 80% | High price/roadmap leverage |
| App stores | Fees 30% (15% tier) | Monetization cuts |
| Colocation | $70B; top10 60% | Capacity concentration |
| Talent/SDKs | 75% use; ML pay $146k | Costly retention/switching |
What is included in the product
Detailed Word Document
Concise Porter's Five Forces analysis for Kingsoft, assessing competitive rivalry, buyer and supplier power, threat of new entrants and substitutes, and identifying strategic levers to protect market share and profitability.
Customizable Excel Spreadsheet
Clear Kingsoft-focused Five Forces one-sheet—instantly shows supplier/buyer power, rivalry intensity, new entrant and substitute threats to speed strategic decisions and boardroom briefings.
Customers Bargaining Power
Low switching costs in productivity suites
Enterprise and consumer users can switch among WPS, Microsoft Office, and Google Workspace with high file compatibility, and WPS reports over 400 million global users as of 2024, increasing buyer options. Freemium models (industry conversion often below 5%) amplify price sensitivity and drive churn. Kingsoft counters with local support, lower total cost of ownership and government alignment in China. Feature parity and migration tools remain key to dampen buyer power.
Enterprise and government procurement clout
Large Chinese SOEs and government agencies wield significant procurement clout, negotiating volume discounts and stringent security/localization clauses; in 2024 sales cycles for such deals commonly span 6–12 months. Compliance and localization give Kingsoft a competitive edge but lengthen procurement timelines. Custom on-prem or hybrid deployments increase perceived buyer power by raising switching costs. Once secured, multi-year contracts (typically 3–5 years) help stabilize pricing power.
Gaming players’ fickle preferences
Players can churn rapidly across titles with minimal friction: industry averages show Day 1 retention near 25% and Day 30 retention around 4% in 2024, pressuring studios to sustain engagement. Content freshness and live-ops quality dictate monetization resilience, with live events driving spikes in ARPDAU. Promotional pricing and events push user acquisition costs—global mobile CPI averaged about $1.70 in 2024—reflecting buyer leverage. Cross-title ecosystems and strong IP loyalty can moderate churn by increasing lifetime value.
Cloud clients sensitive to price-performance
Cloud clients in China benchmark IaaS/PaaS offers primarily against Alibaba Cloud (about 39% market share in 2024), Tencent Cloud and Huawei Cloud, making transparent pricing and reserved-instance discounts (up to 70%) drive tight price-performance comparisons. Managed services increase workload stickiness and reduce buyer power over time, while initial trials and credits (commonly up to $300 equivalent) boost early leverage.
- Benchmarking: Alibaba ~39% (2024)
- Reserved discounts: up to 70%
- Managed services: higher stickiness, lower long-term buyer power
- Trials/credits: up to $300 equivalent enhance early leverage
Security software commoditization
- free/bundled adoption ~60%
- enterprise SLA premium ~+20%
- brand trust lifts renewals ~+12%
- key differentiators: detection accuracy, low impact, compliance
Competition raises buyer pressure; 400M users and 39% cloud share
Enterprise and consumer users can switch among WPS, MS Office and Google Workspace; WPS reports 400M users (2024), raising buyer options and price sensitivity. Large Chinese SOEs/govt negotiate discounts; typical deals 6–12 months and contracts 3–5 years. Cloud benchmarking vs Alibaba (~39% share 2024) tightens pricing; managed services raise stickiness and reduce buyer power.
| Metric | 2024 |
|---|---|
| WPS users | 400M |
| Alibaba cloud share | 39% |
| Sales cycle | 6–12m |
| Contract length | 3–5y |
Full Version Awaits
Kingsoft Porter's Five Forces Analysis
This preview shows the exact Kingsoft Porter's Five Forces Analysis you'll receive immediately after purchase—no surprises, no placeholders. The report is a complete, professionally formatted assessment covering competitive rivalry, supplier and buyer power, threats of new entrants and substitutes, and strategic implications. It's ready for download and use the moment you buy. Instant access, no customization required.











