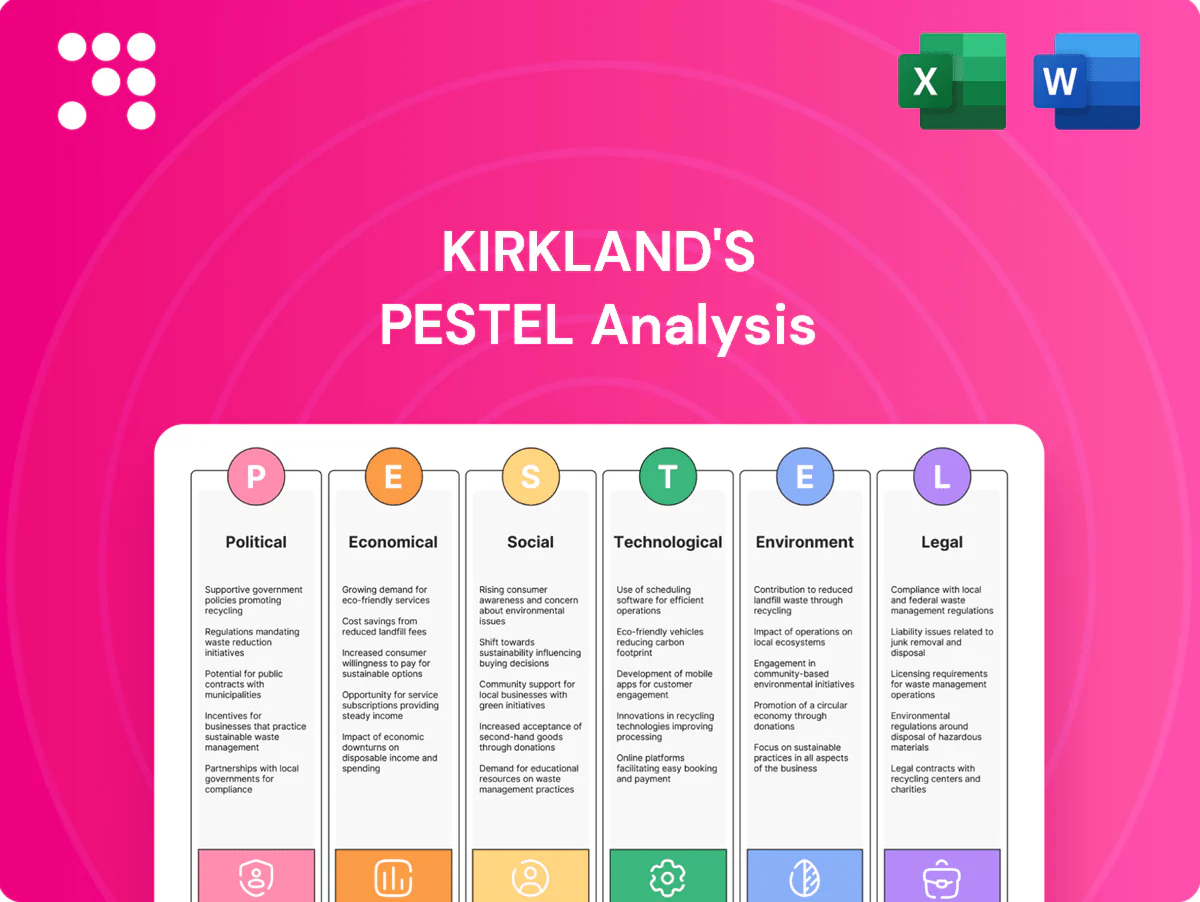
Kirkland's PESTLE Analysis

Your Shortcut to Market Insight Starts Here
Unlock how political, economic, social, technological, legal, and environmental forces are reshaping Kirkland's competitive landscape in our concise PESTLE Analysis. Designed for investors and strategists, it highlights risks and growth levers you can act on today. Purchase the full report for the complete, ready-to-use insights and downloadable charts.
Political factors

Tariffs and import exposure
Many home décor and furniture items are sourced overseas, exposing Kirkland’s cost of goods to tariff shifts; Section 301 U.S. tariffs on Chinese goods remain as high as 25%, directly pressuring margins and retail pricing. Changes in U.S.–China or other trade policies can quickly force markdowns or price increases. Kirkland’s must hedge, diversify suppliers, or shift sourcing to reduce volatility, since trade certainty affects inventory planning and can extend lead times substantially.
Sales tax nexus and local policy
Operating stores and e-commerce subject Kirkland's to multi-state sales tax collection and reporting since the 2018 South Dakota v. Wayfair ruling expanded nexus standards for remote sellers.
State-level policy shifts raise compliance costs and affect price transparency; 45 states (five states have no statewide sales tax) and DC impose sales taxes, complicating filings.
Local incentives or zoning rules influence store openings/remodels, while harmonized tax processes can improve checkout conversion and lower compliance burden.

Labor and wage policy
Federal minimum wage remains $7.25 (unchanged since 2009) while many states and large cities implemented $15+ floors by 2025, driving higher store and distribution labor costs and tighter scheduling rules. Benefits mandates such as paid leave and health contributions elevate fixed expenses but can improve retention. Strong political momentum for worker protections may further limit scheduling flexibility. Efficient labor models and selective automation can partly offset these policy-driven costs.

Infrastructure and logistics policy
Public investment in ports, highways and rail — IIJA enacted $1.2 trillion in 2021 including roughly $110 billion for roads and bridges and about $17 billion for ports, waterways and coastal restoration — directly reduces inbound freight time and cost for Kirkland by improving capacity and resilience.
Policy-driven congestion pricing and tighter emissions standards raise last-mile costs but incentives for logistics modernization and multimodal links support faster inventory turns and better on-time delivery, aiding omnichannel execution.
- Infrastructure funding: IIJA $1.2 trillion; $110B roads/bridges; $17B ports
- Impact: lower inbound freight lead times, higher inventory turns
- Risks: congestion fees, emissions rules lift last-mile costs
- Opportunities: grants/tax incentives for logistics modernization
Geopolitical supply risk
Instability in sourcing regions can disrupt materials and finished goods for Kirkland, with sanctions on Russia since 2022 and intermittent China export controls raising lead-time and cost uncertainty across retail supply chains. Multi-country sourcing and nearshoring reduce supplier concentration and inventory risk, while real-time visibility tools enable rerouting of orders during disruptions.
- Disruptions: regional instability raises lead times
- Regulatory risk: sanctions and export controls increase cost uncertainty
- Mitigation: multi-country sourcing and nearshoring
- Tools: visibility platforms enable dynamic rerouting
Retail margins at risk from tariffs, Wayfair nexus, rising wages and IIJA logistics shifts
Kirkland’s margins remain exposed to import tariffs (Section 301 up to 25%) and shifting U.S.–China trade policy, forcing sourcing diversification. Post-Wayfair (2018) nexus rules require multi-state sales tax compliance, raising admin costs. Rising state/city wages (many $15+ by 2025) and IIJA logistics investments reshape labor and freight economics.
| Metric | 2024/25 Data | Impact |
|---|---|---|
| Section 301 tariffs | up to 25% | ↑COGS, pricing pressure |
| Sales tax nexus | Wayfair 2018 applied | ↑Compliance costs |
| Wages | Federal $7.25; many $15+ | ↑Labor costs |
| IIJA | $1.2T; $110B roads; $17B ports | ↓Freight lead times |
What is included in the product
 Detailed Word Document
Provides a concise PESTLE analysis of Kirkland's, examining Political, Economic, Social, Technological, Environmental, and Legal forces with data-driven trends and forward-looking insights to inform executives, investors, and strategists on risks, opportunities, and scenario planning specific to its retail home décor market.

 Customizable Excel Spreadsheet
A concise, visually segmented PESTLE summary of Kirkland's that relieves prep time by providing easily shareable, editable insights for meetings, presentations, and regional or business-line annotations.
Economic factors

Consumer discretionary spending
Home décor is highly cyclical and tracks disposable income and consumer confidence; U.S. furniture and home furnishings retail sales were about 162 billion in 2023 (U.S. Census Bureau), underscoring category scale. During slowdowns consumers shift to promotional items and reduce basket size, while stimulus or wage growth supports trade-ups. Kirkland's value positioning helps defend share in downturns by attracting budget-conscious buyers.
Housing market and interest rates
Furniture and décor demand closely follows home sales and renovations: existing‑home sales totaled about 4.06 million in 2024 (NAR), so lower turnover can dampen big‑ticket purchases. Higher 30‑year mortgage rates near 7% in mid‑2025 (Freddie Mac) suppress moves, though remodeling in place keeps décor refresh demand. Monitoring housing starts—around 1.4–1.5 million annualized in 2024 (U.S. Census)—helps guide Kirkland’s inventory mix.

Inflation and input costs
Freight, materials and wage inflation—with freight costs up ~20% vs 2019 and US CPI ~3.4% in 2024—compress Kirkland's gross margins if not offset by pricing or category mix.
Sticky price sensitivity in value-focused home décor limits pass-through; vendor renegotiation and pack-size optimization can restore unit economics and cut per-unit costs.
Deflation risks in soft demand can force inventory markdowns, amplifying margin pressure and working-capital needs.

FX and sourcing economics
Currency swings alter import costs and vendor pricing for Kirkland's even on dollar-denominated contracts; the US Dollar Index averaged near 103 in 2024, keeping import dynamics volatile. Active hedging programs reduced COGS variability for many retailers, while supplier-region diversification balances FX and geopolitical risk. Stable FX underpins predictable pricing strategies and margin planning.
- Hedging: smooths COGS swings
- Diversify suppliers: reduces FX/geopolitical exposure
- Stable DXY (~103 in 2024): aids pricing predictability
Seasonality and inventory turns
Seasonal décor peaks concentrate a large share of sales into Q4, raising sales volatility and working capital needs; accurate forecasting reduces markdowns and stockouts and was a focus after 2023–24 holiday mix shifts. Efficient inventory turns (industry averages 4–6 turns for specialty home retailers) free cash for growth and digital investment, while weather anomalies can amplify seasonal-miss risk.
- Seasonality: Q4 concentration raises volatility
- Forecasting: lowers markdowns/stockouts
- Turns: 4–6 industry avg frees cash
- Weather: amplifies miss risk
Retail margins at risk from tariffs, Wayfair nexus, rising wages and IIJA logistics shifts
Kirkland’s sales track disposable income and housing activity: US home furnishings sales ~$162B (2023) and existing‑home sales 4.06M (2024). High 30‑yr mortgage ~7% (mid‑2025) and CPI ~3.4% (2024) constrain big-ticket demand; freight +20% vs 2019 and DXY ~103 (2024) pressure margins, favoring value positioning, vendor renegotiation and hedging.
| Metric | Value |
|---|---|
| Home furnishings sales | $162B (2023) |
| Existing‑home sales | 4.06M (2024) |
| 30‑yr mortgage | ~7% (mid‑2025) |
| CPI | 3.4% (2024) |
| DXY | ~103 (2024) |
What You See Is What You Get
Kirkland's PESTLE Analysis
The Kirkland's PESTLE Analysis you see here is the exact, fully formatted document you’ll receive after purchase, ready to use for strategy and decision-making. The content, layout, and structure are final—no placeholders or surprises—download immediately after checkout.

Your Shortcut to Market Insight Starts Here
Unlock how political, economic, social, technological, legal, and environmental forces are reshaping Kirkland's competitive landscape in our concise PESTLE Analysis. Designed for investors and strategists, it highlights risks and growth levers you can act on today. Purchase the full report for the complete, ready-to-use insights and downloadable charts.
Political factors
Tariffs and import exposure
Many home décor and furniture items are sourced overseas, exposing Kirkland’s cost of goods to tariff shifts; Section 301 U.S. tariffs on Chinese goods remain as high as 25%, directly pressuring margins and retail pricing. Changes in U.S.–China or other trade policies can quickly force markdowns or price increases. Kirkland’s must hedge, diversify suppliers, or shift sourcing to reduce volatility, since trade certainty affects inventory planning and can extend lead times substantially.
Sales tax nexus and local policy
Operating stores and e-commerce subject Kirkland's to multi-state sales tax collection and reporting since the 2018 South Dakota v. Wayfair ruling expanded nexus standards for remote sellers.
State-level policy shifts raise compliance costs and affect price transparency; 45 states (five states have no statewide sales tax) and DC impose sales taxes, complicating filings.
Local incentives or zoning rules influence store openings/remodels, while harmonized tax processes can improve checkout conversion and lower compliance burden.
Labor and wage policy
Federal minimum wage remains $7.25 (unchanged since 2009) while many states and large cities implemented $15+ floors by 2025, driving higher store and distribution labor costs and tighter scheduling rules. Benefits mandates such as paid leave and health contributions elevate fixed expenses but can improve retention. Strong political momentum for worker protections may further limit scheduling flexibility. Efficient labor models and selective automation can partly offset these policy-driven costs.
Infrastructure and logistics policy
Public investment in ports, highways and rail — IIJA enacted $1.2 trillion in 2021 including roughly $110 billion for roads and bridges and about $17 billion for ports, waterways and coastal restoration — directly reduces inbound freight time and cost for Kirkland by improving capacity and resilience.
Policy-driven congestion pricing and tighter emissions standards raise last-mile costs but incentives for logistics modernization and multimodal links support faster inventory turns and better on-time delivery, aiding omnichannel execution.
- Infrastructure funding: IIJA $1.2 trillion; $110B roads/bridges; $17B ports
- Impact: lower inbound freight lead times, higher inventory turns
- Risks: congestion fees, emissions rules lift last-mile costs
- Opportunities: grants/tax incentives for logistics modernization
Geopolitical supply risk
Instability in sourcing regions can disrupt materials and finished goods for Kirkland, with sanctions on Russia since 2022 and intermittent China export controls raising lead-time and cost uncertainty across retail supply chains. Multi-country sourcing and nearshoring reduce supplier concentration and inventory risk, while real-time visibility tools enable rerouting of orders during disruptions.
- Disruptions: regional instability raises lead times
- Regulatory risk: sanctions and export controls increase cost uncertainty
- Mitigation: multi-country sourcing and nearshoring
- Tools: visibility platforms enable dynamic rerouting
Retail margins at risk from tariffs, Wayfair nexus, rising wages and IIJA logistics shifts
Kirkland’s margins remain exposed to import tariffs (Section 301 up to 25%) and shifting U.S.–China trade policy, forcing sourcing diversification. Post-Wayfair (2018) nexus rules require multi-state sales tax compliance, raising admin costs. Rising state/city wages (many $15+ by 2025) and IIJA logistics investments reshape labor and freight economics.
| Metric | 2024/25 Data | Impact |
|---|---|---|
| Section 301 tariffs | up to 25% | ↑COGS, pricing pressure |
| Sales tax nexus | Wayfair 2018 applied | ↑Compliance costs |
| Wages | Federal $7.25; many $15+ | ↑Labor costs |
| IIJA | $1.2T; $110B roads; $17B ports | ↓Freight lead times |
What is included in the product
Detailed Word Document
Provides a concise PESTLE analysis of Kirkland's, examining Political, Economic, Social, Technological, Environmental, and Legal forces with data-driven trends and forward-looking insights to inform executives, investors, and strategists on risks, opportunities, and scenario planning specific to its retail home décor market.
Customizable Excel Spreadsheet
A concise, visually segmented PESTLE summary of Kirkland's that relieves prep time by providing easily shareable, editable insights for meetings, presentations, and regional or business-line annotations.
Economic factors
Consumer discretionary spending
Home décor is highly cyclical and tracks disposable income and consumer confidence; U.S. furniture and home furnishings retail sales were about 162 billion in 2023 (U.S. Census Bureau), underscoring category scale. During slowdowns consumers shift to promotional items and reduce basket size, while stimulus or wage growth supports trade-ups. Kirkland's value positioning helps defend share in downturns by attracting budget-conscious buyers.
Housing market and interest rates
Furniture and décor demand closely follows home sales and renovations: existing‑home sales totaled about 4.06 million in 2024 (NAR), so lower turnover can dampen big‑ticket purchases. Higher 30‑year mortgage rates near 7% in mid‑2025 (Freddie Mac) suppress moves, though remodeling in place keeps décor refresh demand. Monitoring housing starts—around 1.4–1.5 million annualized in 2024 (U.S. Census)—helps guide Kirkland’s inventory mix.
Inflation and input costs
Freight, materials and wage inflation—with freight costs up ~20% vs 2019 and US CPI ~3.4% in 2024—compress Kirkland's gross margins if not offset by pricing or category mix.
Sticky price sensitivity in value-focused home décor limits pass-through; vendor renegotiation and pack-size optimization can restore unit economics and cut per-unit costs.
Deflation risks in soft demand can force inventory markdowns, amplifying margin pressure and working-capital needs.
FX and sourcing economics
Currency swings alter import costs and vendor pricing for Kirkland's even on dollar-denominated contracts; the US Dollar Index averaged near 103 in 2024, keeping import dynamics volatile. Active hedging programs reduced COGS variability for many retailers, while supplier-region diversification balances FX and geopolitical risk. Stable FX underpins predictable pricing strategies and margin planning.
- Hedging: smooths COGS swings
- Diversify suppliers: reduces FX/geopolitical exposure
- Stable DXY (~103 in 2024): aids pricing predictability
Seasonality and inventory turns
Seasonal décor peaks concentrate a large share of sales into Q4, raising sales volatility and working capital needs; accurate forecasting reduces markdowns and stockouts and was a focus after 2023–24 holiday mix shifts. Efficient inventory turns (industry averages 4–6 turns for specialty home retailers) free cash for growth and digital investment, while weather anomalies can amplify seasonal-miss risk.
- Seasonality: Q4 concentration raises volatility
- Forecasting: lowers markdowns/stockouts
- Turns: 4–6 industry avg frees cash
- Weather: amplifies miss risk
Retail margins at risk from tariffs, Wayfair nexus, rising wages and IIJA logistics shifts
Kirkland’s sales track disposable income and housing activity: US home furnishings sales ~$162B (2023) and existing‑home sales 4.06M (2024). High 30‑yr mortgage ~7% (mid‑2025) and CPI ~3.4% (2024) constrain big-ticket demand; freight +20% vs 2019 and DXY ~103 (2024) pressure margins, favoring value positioning, vendor renegotiation and hedging.
| Metric | Value |
|---|---|
| Home furnishings sales | $162B (2023) |
| Existing‑home sales | 4.06M (2024) |
| 30‑yr mortgage | ~7% (mid‑2025) |
| CPI | 3.4% (2024) |
| DXY | ~103 (2024) |
What You See Is What You Get
Kirkland's PESTLE Analysis
The Kirkland's PESTLE Analysis you see here is the exact, fully formatted document you’ll receive after purchase, ready to use for strategy and decision-making. The content, layout, and structure are final—no placeholders or surprises—download immediately after checkout.
Original: $10.00
-65%$10.00
$3.50Description
Your Shortcut to Market Insight Starts Here
Unlock how political, economic, social, technological, legal, and environmental forces are reshaping Kirkland's competitive landscape in our concise PESTLE Analysis. Designed for investors and strategists, it highlights risks and growth levers you can act on today. Purchase the full report for the complete, ready-to-use insights and downloadable charts.
Political factors
Tariffs and import exposure
Many home décor and furniture items are sourced overseas, exposing Kirkland’s cost of goods to tariff shifts; Section 301 U.S. tariffs on Chinese goods remain as high as 25%, directly pressuring margins and retail pricing. Changes in U.S.–China or other trade policies can quickly force markdowns or price increases. Kirkland’s must hedge, diversify suppliers, or shift sourcing to reduce volatility, since trade certainty affects inventory planning and can extend lead times substantially.
Sales tax nexus and local policy
Operating stores and e-commerce subject Kirkland's to multi-state sales tax collection and reporting since the 2018 South Dakota v. Wayfair ruling expanded nexus standards for remote sellers.
State-level policy shifts raise compliance costs and affect price transparency; 45 states (five states have no statewide sales tax) and DC impose sales taxes, complicating filings.
Local incentives or zoning rules influence store openings/remodels, while harmonized tax processes can improve checkout conversion and lower compliance burden.
Labor and wage policy
Federal minimum wage remains $7.25 (unchanged since 2009) while many states and large cities implemented $15+ floors by 2025, driving higher store and distribution labor costs and tighter scheduling rules. Benefits mandates such as paid leave and health contributions elevate fixed expenses but can improve retention. Strong political momentum for worker protections may further limit scheduling flexibility. Efficient labor models and selective automation can partly offset these policy-driven costs.
Infrastructure and logistics policy
Public investment in ports, highways and rail — IIJA enacted $1.2 trillion in 2021 including roughly $110 billion for roads and bridges and about $17 billion for ports, waterways and coastal restoration — directly reduces inbound freight time and cost for Kirkland by improving capacity and resilience.
Policy-driven congestion pricing and tighter emissions standards raise last-mile costs but incentives for logistics modernization and multimodal links support faster inventory turns and better on-time delivery, aiding omnichannel execution.
- Infrastructure funding: IIJA $1.2 trillion; $110B roads/bridges; $17B ports
- Impact: lower inbound freight lead times, higher inventory turns
- Risks: congestion fees, emissions rules lift last-mile costs
- Opportunities: grants/tax incentives for logistics modernization
Geopolitical supply risk
Instability in sourcing regions can disrupt materials and finished goods for Kirkland, with sanctions on Russia since 2022 and intermittent China export controls raising lead-time and cost uncertainty across retail supply chains. Multi-country sourcing and nearshoring reduce supplier concentration and inventory risk, while real-time visibility tools enable rerouting of orders during disruptions.
- Disruptions: regional instability raises lead times
- Regulatory risk: sanctions and export controls increase cost uncertainty
- Mitigation: multi-country sourcing and nearshoring
- Tools: visibility platforms enable dynamic rerouting
Retail margins at risk from tariffs, Wayfair nexus, rising wages and IIJA logistics shifts
Kirkland’s margins remain exposed to import tariffs (Section 301 up to 25%) and shifting U.S.–China trade policy, forcing sourcing diversification. Post-Wayfair (2018) nexus rules require multi-state sales tax compliance, raising admin costs. Rising state/city wages (many $15+ by 2025) and IIJA logistics investments reshape labor and freight economics.
| Metric | 2024/25 Data | Impact |
|---|---|---|
| Section 301 tariffs | up to 25% | ↑COGS, pricing pressure |
| Sales tax nexus | Wayfair 2018 applied | ↑Compliance costs |
| Wages | Federal $7.25; many $15+ | ↑Labor costs |
| IIJA | $1.2T; $110B roads; $17B ports | ↓Freight lead times |
What is included in the product
Detailed Word Document
Provides a concise PESTLE analysis of Kirkland's, examining Political, Economic, Social, Technological, Environmental, and Legal forces with data-driven trends and forward-looking insights to inform executives, investors, and strategists on risks, opportunities, and scenario planning specific to its retail home décor market.
Customizable Excel Spreadsheet
A concise, visually segmented PESTLE summary of Kirkland's that relieves prep time by providing easily shareable, editable insights for meetings, presentations, and regional or business-line annotations.
Economic factors
Consumer discretionary spending
Home décor is highly cyclical and tracks disposable income and consumer confidence; U.S. furniture and home furnishings retail sales were about 162 billion in 2023 (U.S. Census Bureau), underscoring category scale. During slowdowns consumers shift to promotional items and reduce basket size, while stimulus or wage growth supports trade-ups. Kirkland's value positioning helps defend share in downturns by attracting budget-conscious buyers.
Housing market and interest rates
Furniture and décor demand closely follows home sales and renovations: existing‑home sales totaled about 4.06 million in 2024 (NAR), so lower turnover can dampen big‑ticket purchases. Higher 30‑year mortgage rates near 7% in mid‑2025 (Freddie Mac) suppress moves, though remodeling in place keeps décor refresh demand. Monitoring housing starts—around 1.4–1.5 million annualized in 2024 (U.S. Census)—helps guide Kirkland’s inventory mix.
Inflation and input costs
Freight, materials and wage inflation—with freight costs up ~20% vs 2019 and US CPI ~3.4% in 2024—compress Kirkland's gross margins if not offset by pricing or category mix.
Sticky price sensitivity in value-focused home décor limits pass-through; vendor renegotiation and pack-size optimization can restore unit economics and cut per-unit costs.
Deflation risks in soft demand can force inventory markdowns, amplifying margin pressure and working-capital needs.
FX and sourcing economics
Currency swings alter import costs and vendor pricing for Kirkland's even on dollar-denominated contracts; the US Dollar Index averaged near 103 in 2024, keeping import dynamics volatile. Active hedging programs reduced COGS variability for many retailers, while supplier-region diversification balances FX and geopolitical risk. Stable FX underpins predictable pricing strategies and margin planning.
- Hedging: smooths COGS swings
- Diversify suppliers: reduces FX/geopolitical exposure
- Stable DXY (~103 in 2024): aids pricing predictability
Seasonality and inventory turns
Seasonal décor peaks concentrate a large share of sales into Q4, raising sales volatility and working capital needs; accurate forecasting reduces markdowns and stockouts and was a focus after 2023–24 holiday mix shifts. Efficient inventory turns (industry averages 4–6 turns for specialty home retailers) free cash for growth and digital investment, while weather anomalies can amplify seasonal-miss risk.
- Seasonality: Q4 concentration raises volatility
- Forecasting: lowers markdowns/stockouts
- Turns: 4–6 industry avg frees cash
- Weather: amplifies miss risk
Retail margins at risk from tariffs, Wayfair nexus, rising wages and IIJA logistics shifts
Kirkland’s sales track disposable income and housing activity: US home furnishings sales ~$162B (2023) and existing‑home sales 4.06M (2024). High 30‑yr mortgage ~7% (mid‑2025) and CPI ~3.4% (2024) constrain big-ticket demand; freight +20% vs 2019 and DXY ~103 (2024) pressure margins, favoring value positioning, vendor renegotiation and hedging.
| Metric | Value |
|---|---|
| Home furnishings sales | $162B (2023) |
| Existing‑home sales | 4.06M (2024) |
| 30‑yr mortgage | ~7% (mid‑2025) |
| CPI | 3.4% (2024) |
| DXY | ~103 (2024) |
What You See Is What You Get
Kirkland's PESTLE Analysis
The Kirkland's PESTLE Analysis you see here is the exact, fully formatted document you’ll receive after purchase, ready to use for strategy and decision-making. The content, layout, and structure are final—no placeholders or surprises—download immediately after checkout.











