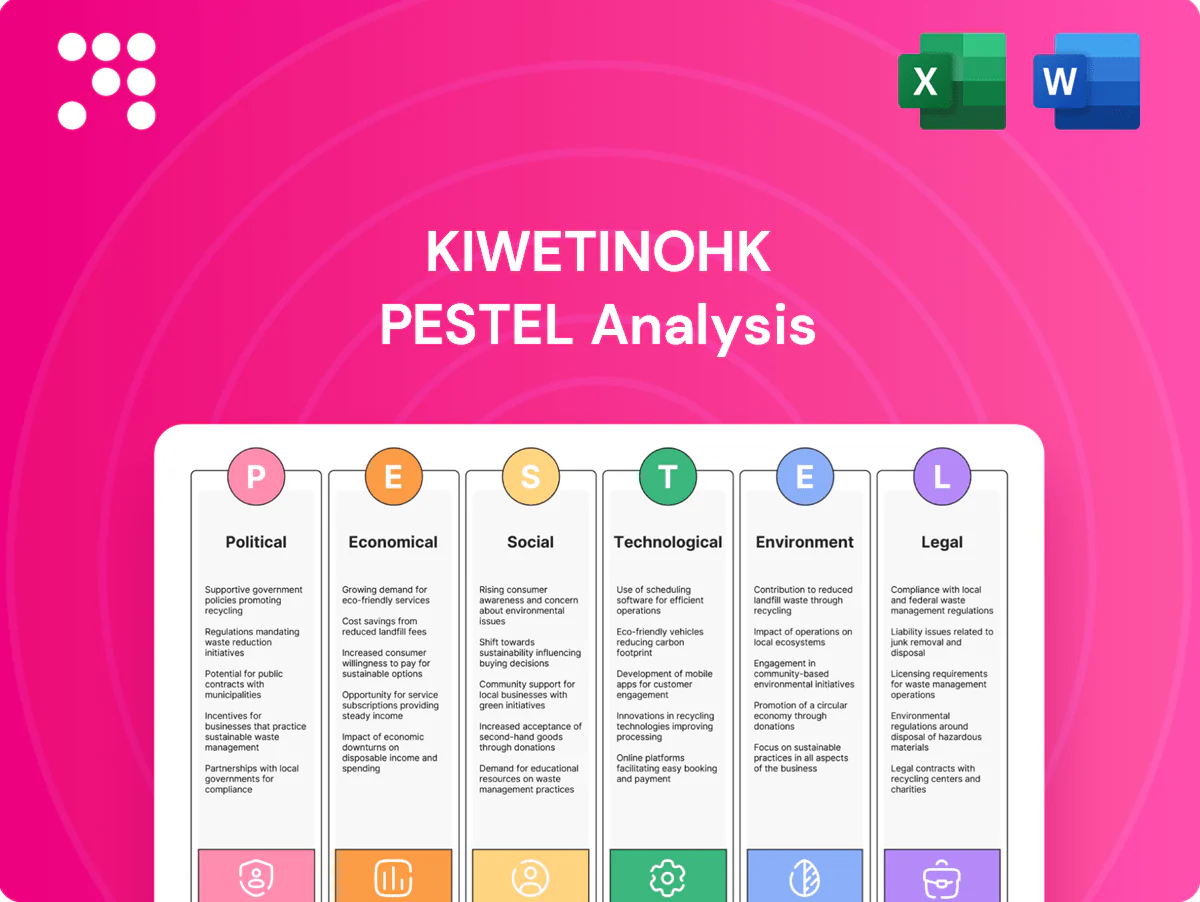
Kiwetinohk PESTLE Analysis

Your Competitive Advantage Starts with This Report
Unlock how political shifts, regulatory pressures, and energy-market trends are shaping Kiwetinohk’s strategy and risk profile in our concise PESTLE snapshot; buy the full analysis for a complete, ready-to-use report that equips investors and strategists with actionable, boardroom-ready insights.
Political factors

Federal climate policy direction
Canada’s shifting federal climate policy—carbon price at $65/tCO2e in 2023, legislated to rise toward $170/t by 2030—recasts economics for gas, power and CCS, altering cashflows and valuation multiples. Changes to carbon pricing trajectories or federal backstops materially affect project IRRs and payback periods. Policy stability lowers required returns for long-cycle projects; reversals raise risk premiums, so Kiwetinohk must design portfolios resilient to oscillations.
Provincial energy governance
Alberta’s regulatory stance—from AESO market rules to provincial approvals—shapes upstream development and power-market signals, with the province operating roughly 17 GW of installed capacity serving a population of about 4.6 million (2024). Pauses in renewable procurement, staggered gas-plant approvals, or changes to capacity-market design materially shift investment timing and cost of capital. Misalignment between provincial rules and federal climate or compliance policies increases permitting complexity, where local permitting speed remains a key competitive factor.

Indigenous relations and co-development
Federal policy shifts — notably the Impact Assessment Act (2019) and Bill C-15 implementing UNDRIP (2021) — have elevated Indigenous participation, affecting project timelines and social licence for Kiwetinohk. Equity partnerships and impact-benefit agreements have been decisive tools for unlocking political support. Early, transparent engagement reduces permitting friction. Co-created projects show greater durability amid shifting political climates.

Cross-border dynamics with the U.S.
North American gas flows and power-equipment supply chains remain politically sensitive; U.S. LNG exports reached about 12 billion cubic feet per day in 2024, shaping regional prices and routes. The Inflation Reduction Act, a roughly 369 billion dollar package, tilts clean-tech competitiveness toward U.S. firms, affecting Canadian project economics. Harmonized CCS measurement and 45Q credits (up to about 85 dollars/ton for DAC/early projects) tighten investment clarity. Ongoing trade frictions have pushed component lead times to 12–18 months and can raise costs by roughly 5–15 percent.
- US LNG ~12 Bcf/d (2024)
- IRA ~369 billion USD (clean-tech pull)
- 45Q ~85 USD/ton (DAC/priority)
- Lead times 12–18 months; cost +5–15%
Public funding and incentives
Access to federal and provincial tax credits and grants (for example Canada's federal CCUS investment tax credit announced in 2022 and the US 45Q credit now valuing storage at about 85 USD/t and utilization at 60 USD/t) materially improves project IRRs and can crowd-in private capital. Administrative certainty and timely disbursement are critical to bankability and debt sizing. Competition for limited public funds forces preference for shovel-ready, de-risked projects.
- public-funding: billions available but limited
- tax-credit-impact: 85 USD/t (45Q storage), 60 USD/t (45Q utilization)
- bankability: timely payouts drive lender comfort
- project-readiness: shovel-ready wins scarce grants
Carbon price to ~170 USD/t and 45Q reshape Alberta project returns
Federal carbon price (65 USD/t in 2023, rising toward ~170 USD/t by 2030) plus CCUS credits reshape project IRRs and risk premiums. Alberta market rules (≈17 GW capacity; population ~4.6M) and Indigenous consent regimes dictate timelines and social licence. US drivers (LNG ~12 Bcf/d in 2024; IRA ≈369B USD) and 45Q (~85 USD/t) shift supply chains and funding; lead times 12–18 months, costs +5–15%.
| Indicator | Value |
|---|---|
| Federal carbon price (2023/2030) | 65 USD/t → ~170 USD/t (2030) |
| Alberta capacity / pop | ≈17 GW / 4.6M |
| US LNG (2024) | ~12 Bcf/d |
| IRA | ≈369B USD |
| 45Q credit | up to ≈85 USD/t |
| Supply chain impact | Lead times 12–18m; cost +5–15% |
What is included in the product
 Detailed Word Document
Explores how Political, Economic, Social, Technological, Environmental and Legal forces uniquely impact Kiwetinohk, with data-backed, region- and industry-specific insights and forward-looking scenarios to inform strategy. Designed for executives and investors, the analysis is formatted for direct use in plans, decks, and funding pitches.

 Customizable Excel Spreadsheet
A concise, visually segmented Kiwetinohk PESTLE summary that can be dropped into presentations, annotated for local context, and easily shared across teams to streamline external risk discussions and strategic planning.
Economic factors

Commodity price volatility
Natural gas and NGL price swings—with Henry Hub averaging near 3.0 USD/MMBtu and AECO around 2.5 CAD/GJ in 2024—drive cash flow volatility for upstream assets, directly impacting Kiwetinohk’s receipts. A disciplined hedging program plus low-cost operations can cap downside and protect margins. Power sales offer partial revenue diversification but introduce merchant exposure to hourly power price swings. A well-structured integrated portfolio smooths cycles and improves cash stability.
Carbon pricing and credit markets
Carbon costs materially affect dispatch economics for gas-fired power and the revenue case for CCS, with benchmark prices like EU ETS ~€90/ton in 2024 and Canada’s federal price scheduled to rise to CAD 170/ton by 2030. Credible carbon credits and offsets can create new revenue streams and balance sheets when compliant with ICVCM integrity benchmarks. Price transparency and permanence rules directly affect project financing terms and risk premiums. Long-term carbon price expectations drive capital allocation toward low‑carbon and CCS investments.

Capital cost inflation
Equipment, labor and EPC costs for energy projects increased materially, with EPC tender prices rising roughly 10% year-on-year in 2023–24, squeezing project IRRs and prompting delays to some FIDs. Vendor diversification and modular, factory-built designs have reduced site escalation risk and shortened schedules. Embedding indexation clauses in offtake contracts preserves margins against ongoing inflationary pressure.

Grid demand growth and electrification
EV adoption (global new‑car EV share ~20% in 2024) plus hyperscale data centers and industrial electrification are driving incremental grid demand; firm gas-fired capacity remains essential to back up intermittent wind/solar and stabilize supply. Locational marginal economics shape interconnection queue outcomes and nodal congestion risk; securing PPAs locks revenue against growing load and merchant price volatility.
- EVs: +20% new‑car share (2024)
- Data centers: hyperscale demand rising, MW-scale builds
- Gas firming: reliability hedge vs renewables
- LMPs: drive queue economics
- PPAs: de‑risk revenue
Access to financing and cost of capital
- Interest rates: ~4–5% in 2024–25
- ESG loan premium: margin savings 5–50 bps
- Bankability: long-term PPAs/carbon contracts reduce financing risk
- Equity preference: scalable, de-risked CCS/power platforms
Carbon price to ~170 USD/t and 45Q reshape Alberta project returns
Volatile gas/NGL prices (Henry Hub ~3.0 USD/MMBtu; AECO ~2.5 CAD/GJ in 2024) drive cashflow swings; hedging and low‑cost ops protect margins. Carbon pricing (EU ETS ~€90/t in 2024; Canada federal CAD170/t by 2030) shifts CAPEX to CCS/low‑carbon. Higher EPC costs (+~10% y/y 2023–24) and rates (~4–5% in 2024–25) raise financing needs; PPAs/long carbon contracts improve bankability.
| Metric | Value |
|---|---|
| Henry Hub | ~3.0 USD/MMBtu (2024) |
| AECO | ~2.5 CAD/GJ (2024) |
| EU ETS | ~€90/t (2024) |
| Interest rates | ~4–5% (2024–25) |
Full Version Awaits
Kiwetinohk PESTLE Analysis
The preview shown here is the exact Kiwetinohk PESTLE Analysis document you’ll receive after purchase—fully formatted and ready to use. No placeholders or teasers; the content, structure, and layout visible here are exactly what you’ll download immediately after payment. This is the final, professionally structured file you’ll own upon checkout.

Your Competitive Advantage Starts with This Report
Unlock how political shifts, regulatory pressures, and energy-market trends are shaping Kiwetinohk’s strategy and risk profile in our concise PESTLE snapshot; buy the full analysis for a complete, ready-to-use report that equips investors and strategists with actionable, boardroom-ready insights.
Political factors
Federal climate policy direction
Canada’s shifting federal climate policy—carbon price at $65/tCO2e in 2023, legislated to rise toward $170/t by 2030—recasts economics for gas, power and CCS, altering cashflows and valuation multiples. Changes to carbon pricing trajectories or federal backstops materially affect project IRRs and payback periods. Policy stability lowers required returns for long-cycle projects; reversals raise risk premiums, so Kiwetinohk must design portfolios resilient to oscillations.
Provincial energy governance
Alberta’s regulatory stance—from AESO market rules to provincial approvals—shapes upstream development and power-market signals, with the province operating roughly 17 GW of installed capacity serving a population of about 4.6 million (2024). Pauses in renewable procurement, staggered gas-plant approvals, or changes to capacity-market design materially shift investment timing and cost of capital. Misalignment between provincial rules and federal climate or compliance policies increases permitting complexity, where local permitting speed remains a key competitive factor.
Indigenous relations and co-development
Federal policy shifts — notably the Impact Assessment Act (2019) and Bill C-15 implementing UNDRIP (2021) — have elevated Indigenous participation, affecting project timelines and social licence for Kiwetinohk. Equity partnerships and impact-benefit agreements have been decisive tools for unlocking political support. Early, transparent engagement reduces permitting friction. Co-created projects show greater durability amid shifting political climates.
Cross-border dynamics with the U.S.
North American gas flows and power-equipment supply chains remain politically sensitive; U.S. LNG exports reached about 12 billion cubic feet per day in 2024, shaping regional prices and routes. The Inflation Reduction Act, a roughly 369 billion dollar package, tilts clean-tech competitiveness toward U.S. firms, affecting Canadian project economics. Harmonized CCS measurement and 45Q credits (up to about 85 dollars/ton for DAC/early projects) tighten investment clarity. Ongoing trade frictions have pushed component lead times to 12–18 months and can raise costs by roughly 5–15 percent.
- US LNG ~12 Bcf/d (2024)
- IRA ~369 billion USD (clean-tech pull)
- 45Q ~85 USD/ton (DAC/priority)
- Lead times 12–18 months; cost +5–15%
Public funding and incentives
Access to federal and provincial tax credits and grants (for example Canada's federal CCUS investment tax credit announced in 2022 and the US 45Q credit now valuing storage at about 85 USD/t and utilization at 60 USD/t) materially improves project IRRs and can crowd-in private capital. Administrative certainty and timely disbursement are critical to bankability and debt sizing. Competition for limited public funds forces preference for shovel-ready, de-risked projects.
- public-funding: billions available but limited
- tax-credit-impact: 85 USD/t (45Q storage), 60 USD/t (45Q utilization)
- bankability: timely payouts drive lender comfort
- project-readiness: shovel-ready wins scarce grants
Carbon price to ~170 USD/t and 45Q reshape Alberta project returns
Federal carbon price (65 USD/t in 2023, rising toward ~170 USD/t by 2030) plus CCUS credits reshape project IRRs and risk premiums. Alberta market rules (≈17 GW capacity; population ~4.6M) and Indigenous consent regimes dictate timelines and social licence. US drivers (LNG ~12 Bcf/d in 2024; IRA ≈369B USD) and 45Q (~85 USD/t) shift supply chains and funding; lead times 12–18 months, costs +5–15%.
| Indicator | Value |
|---|---|
| Federal carbon price (2023/2030) | 65 USD/t → ~170 USD/t (2030) |
| Alberta capacity / pop | ≈17 GW / 4.6M |
| US LNG (2024) | ~12 Bcf/d |
| IRA | ≈369B USD |
| 45Q credit | up to ≈85 USD/t |
| Supply chain impact | Lead times 12–18m; cost +5–15% |
What is included in the product
Detailed Word Document
Explores how Political, Economic, Social, Technological, Environmental and Legal forces uniquely impact Kiwetinohk, with data-backed, region- and industry-specific insights and forward-looking scenarios to inform strategy. Designed for executives and investors, the analysis is formatted for direct use in plans, decks, and funding pitches.
Customizable Excel Spreadsheet
A concise, visually segmented Kiwetinohk PESTLE summary that can be dropped into presentations, annotated for local context, and easily shared across teams to streamline external risk discussions and strategic planning.
Economic factors
Commodity price volatility
Natural gas and NGL price swings—with Henry Hub averaging near 3.0 USD/MMBtu and AECO around 2.5 CAD/GJ in 2024—drive cash flow volatility for upstream assets, directly impacting Kiwetinohk’s receipts. A disciplined hedging program plus low-cost operations can cap downside and protect margins. Power sales offer partial revenue diversification but introduce merchant exposure to hourly power price swings. A well-structured integrated portfolio smooths cycles and improves cash stability.
Carbon pricing and credit markets
Carbon costs materially affect dispatch economics for gas-fired power and the revenue case for CCS, with benchmark prices like EU ETS ~€90/ton in 2024 and Canada’s federal price scheduled to rise to CAD 170/ton by 2030. Credible carbon credits and offsets can create new revenue streams and balance sheets when compliant with ICVCM integrity benchmarks. Price transparency and permanence rules directly affect project financing terms and risk premiums. Long-term carbon price expectations drive capital allocation toward low‑carbon and CCS investments.
Capital cost inflation
Equipment, labor and EPC costs for energy projects increased materially, with EPC tender prices rising roughly 10% year-on-year in 2023–24, squeezing project IRRs and prompting delays to some FIDs. Vendor diversification and modular, factory-built designs have reduced site escalation risk and shortened schedules. Embedding indexation clauses in offtake contracts preserves margins against ongoing inflationary pressure.
Grid demand growth and electrification
EV adoption (global new‑car EV share ~20% in 2024) plus hyperscale data centers and industrial electrification are driving incremental grid demand; firm gas-fired capacity remains essential to back up intermittent wind/solar and stabilize supply. Locational marginal economics shape interconnection queue outcomes and nodal congestion risk; securing PPAs locks revenue against growing load and merchant price volatility.
- EVs: +20% new‑car share (2024)
- Data centers: hyperscale demand rising, MW-scale builds
- Gas firming: reliability hedge vs renewables
- LMPs: drive queue economics
- PPAs: de‑risk revenue
Access to financing and cost of capital
- Interest rates: ~4–5% in 2024–25
- ESG loan premium: margin savings 5–50 bps
- Bankability: long-term PPAs/carbon contracts reduce financing risk
- Equity preference: scalable, de-risked CCS/power platforms
Carbon price to ~170 USD/t and 45Q reshape Alberta project returns
Volatile gas/NGL prices (Henry Hub ~3.0 USD/MMBtu; AECO ~2.5 CAD/GJ in 2024) drive cashflow swings; hedging and low‑cost ops protect margins. Carbon pricing (EU ETS ~€90/t in 2024; Canada federal CAD170/t by 2030) shifts CAPEX to CCS/low‑carbon. Higher EPC costs (+~10% y/y 2023–24) and rates (~4–5% in 2024–25) raise financing needs; PPAs/long carbon contracts improve bankability.
| Metric | Value |
|---|---|
| Henry Hub | ~3.0 USD/MMBtu (2024) |
| AECO | ~2.5 CAD/GJ (2024) |
| EU ETS | ~€90/t (2024) |
| Interest rates | ~4–5% (2024–25) |
Full Version Awaits
Kiwetinohk PESTLE Analysis
The preview shown here is the exact Kiwetinohk PESTLE Analysis document you’ll receive after purchase—fully formatted and ready to use. No placeholders or teasers; the content, structure, and layout visible here are exactly what you’ll download immediately after payment. This is the final, professionally structured file you’ll own upon checkout.
Original: $10.00
-65%$10.00
$3.50Description
Your Competitive Advantage Starts with This Report
Unlock how political shifts, regulatory pressures, and energy-market trends are shaping Kiwetinohk’s strategy and risk profile in our concise PESTLE snapshot; buy the full analysis for a complete, ready-to-use report that equips investors and strategists with actionable, boardroom-ready insights.
Political factors
Federal climate policy direction
Canada’s shifting federal climate policy—carbon price at $65/tCO2e in 2023, legislated to rise toward $170/t by 2030—recasts economics for gas, power and CCS, altering cashflows and valuation multiples. Changes to carbon pricing trajectories or federal backstops materially affect project IRRs and payback periods. Policy stability lowers required returns for long-cycle projects; reversals raise risk premiums, so Kiwetinohk must design portfolios resilient to oscillations.
Provincial energy governance
Alberta’s regulatory stance—from AESO market rules to provincial approvals—shapes upstream development and power-market signals, with the province operating roughly 17 GW of installed capacity serving a population of about 4.6 million (2024). Pauses in renewable procurement, staggered gas-plant approvals, or changes to capacity-market design materially shift investment timing and cost of capital. Misalignment between provincial rules and federal climate or compliance policies increases permitting complexity, where local permitting speed remains a key competitive factor.
Indigenous relations and co-development
Federal policy shifts — notably the Impact Assessment Act (2019) and Bill C-15 implementing UNDRIP (2021) — have elevated Indigenous participation, affecting project timelines and social licence for Kiwetinohk. Equity partnerships and impact-benefit agreements have been decisive tools for unlocking political support. Early, transparent engagement reduces permitting friction. Co-created projects show greater durability amid shifting political climates.
Cross-border dynamics with the U.S.
North American gas flows and power-equipment supply chains remain politically sensitive; U.S. LNG exports reached about 12 billion cubic feet per day in 2024, shaping regional prices and routes. The Inflation Reduction Act, a roughly 369 billion dollar package, tilts clean-tech competitiveness toward U.S. firms, affecting Canadian project economics. Harmonized CCS measurement and 45Q credits (up to about 85 dollars/ton for DAC/early projects) tighten investment clarity. Ongoing trade frictions have pushed component lead times to 12–18 months and can raise costs by roughly 5–15 percent.
- US LNG ~12 Bcf/d (2024)
- IRA ~369 billion USD (clean-tech pull)
- 45Q ~85 USD/ton (DAC/priority)
- Lead times 12–18 months; cost +5–15%
Public funding and incentives
Access to federal and provincial tax credits and grants (for example Canada's federal CCUS investment tax credit announced in 2022 and the US 45Q credit now valuing storage at about 85 USD/t and utilization at 60 USD/t) materially improves project IRRs and can crowd-in private capital. Administrative certainty and timely disbursement are critical to bankability and debt sizing. Competition for limited public funds forces preference for shovel-ready, de-risked projects.
- public-funding: billions available but limited
- tax-credit-impact: 85 USD/t (45Q storage), 60 USD/t (45Q utilization)
- bankability: timely payouts drive lender comfort
- project-readiness: shovel-ready wins scarce grants
Carbon price to ~170 USD/t and 45Q reshape Alberta project returns
Federal carbon price (65 USD/t in 2023, rising toward ~170 USD/t by 2030) plus CCUS credits reshape project IRRs and risk premiums. Alberta market rules (≈17 GW capacity; population ~4.6M) and Indigenous consent regimes dictate timelines and social licence. US drivers (LNG ~12 Bcf/d in 2024; IRA ≈369B USD) and 45Q (~85 USD/t) shift supply chains and funding; lead times 12–18 months, costs +5–15%.
| Indicator | Value |
|---|---|
| Federal carbon price (2023/2030) | 65 USD/t → ~170 USD/t (2030) |
| Alberta capacity / pop | ≈17 GW / 4.6M |
| US LNG (2024) | ~12 Bcf/d |
| IRA | ≈369B USD |
| 45Q credit | up to ≈85 USD/t |
| Supply chain impact | Lead times 12–18m; cost +5–15% |
What is included in the product
Detailed Word Document
Explores how Political, Economic, Social, Technological, Environmental and Legal forces uniquely impact Kiwetinohk, with data-backed, region- and industry-specific insights and forward-looking scenarios to inform strategy. Designed for executives and investors, the analysis is formatted for direct use in plans, decks, and funding pitches.
Customizable Excel Spreadsheet
A concise, visually segmented Kiwetinohk PESTLE summary that can be dropped into presentations, annotated for local context, and easily shared across teams to streamline external risk discussions and strategic planning.
Economic factors
Commodity price volatility
Natural gas and NGL price swings—with Henry Hub averaging near 3.0 USD/MMBtu and AECO around 2.5 CAD/GJ in 2024—drive cash flow volatility for upstream assets, directly impacting Kiwetinohk’s receipts. A disciplined hedging program plus low-cost operations can cap downside and protect margins. Power sales offer partial revenue diversification but introduce merchant exposure to hourly power price swings. A well-structured integrated portfolio smooths cycles and improves cash stability.
Carbon pricing and credit markets
Carbon costs materially affect dispatch economics for gas-fired power and the revenue case for CCS, with benchmark prices like EU ETS ~€90/ton in 2024 and Canada’s federal price scheduled to rise to CAD 170/ton by 2030. Credible carbon credits and offsets can create new revenue streams and balance sheets when compliant with ICVCM integrity benchmarks. Price transparency and permanence rules directly affect project financing terms and risk premiums. Long-term carbon price expectations drive capital allocation toward low‑carbon and CCS investments.
Capital cost inflation
Equipment, labor and EPC costs for energy projects increased materially, with EPC tender prices rising roughly 10% year-on-year in 2023–24, squeezing project IRRs and prompting delays to some FIDs. Vendor diversification and modular, factory-built designs have reduced site escalation risk and shortened schedules. Embedding indexation clauses in offtake contracts preserves margins against ongoing inflationary pressure.
Grid demand growth and electrification
EV adoption (global new‑car EV share ~20% in 2024) plus hyperscale data centers and industrial electrification are driving incremental grid demand; firm gas-fired capacity remains essential to back up intermittent wind/solar and stabilize supply. Locational marginal economics shape interconnection queue outcomes and nodal congestion risk; securing PPAs locks revenue against growing load and merchant price volatility.
- EVs: +20% new‑car share (2024)
- Data centers: hyperscale demand rising, MW-scale builds
- Gas firming: reliability hedge vs renewables
- LMPs: drive queue economics
- PPAs: de‑risk revenue
Access to financing and cost of capital
- Interest rates: ~4–5% in 2024–25
- ESG loan premium: margin savings 5–50 bps
- Bankability: long-term PPAs/carbon contracts reduce financing risk
- Equity preference: scalable, de-risked CCS/power platforms
Carbon price to ~170 USD/t and 45Q reshape Alberta project returns
Volatile gas/NGL prices (Henry Hub ~3.0 USD/MMBtu; AECO ~2.5 CAD/GJ in 2024) drive cashflow swings; hedging and low‑cost ops protect margins. Carbon pricing (EU ETS ~€90/t in 2024; Canada federal CAD170/t by 2030) shifts CAPEX to CCS/low‑carbon. Higher EPC costs (+~10% y/y 2023–24) and rates (~4–5% in 2024–25) raise financing needs; PPAs/long carbon contracts improve bankability.
| Metric | Value |
|---|---|
| Henry Hub | ~3.0 USD/MMBtu (2024) |
| AECO | ~2.5 CAD/GJ (2024) |
| EU ETS | ~€90/t (2024) |
| Interest rates | ~4–5% (2024–25) |
Full Version Awaits
Kiwetinohk PESTLE Analysis
The preview shown here is the exact Kiwetinohk PESTLE Analysis document you’ll receive after purchase—fully formatted and ready to use. No placeholders or teasers; the content, structure, and layout visible here are exactly what you’ll download immediately after payment. This is the final, professionally structured file you’ll own upon checkout.











