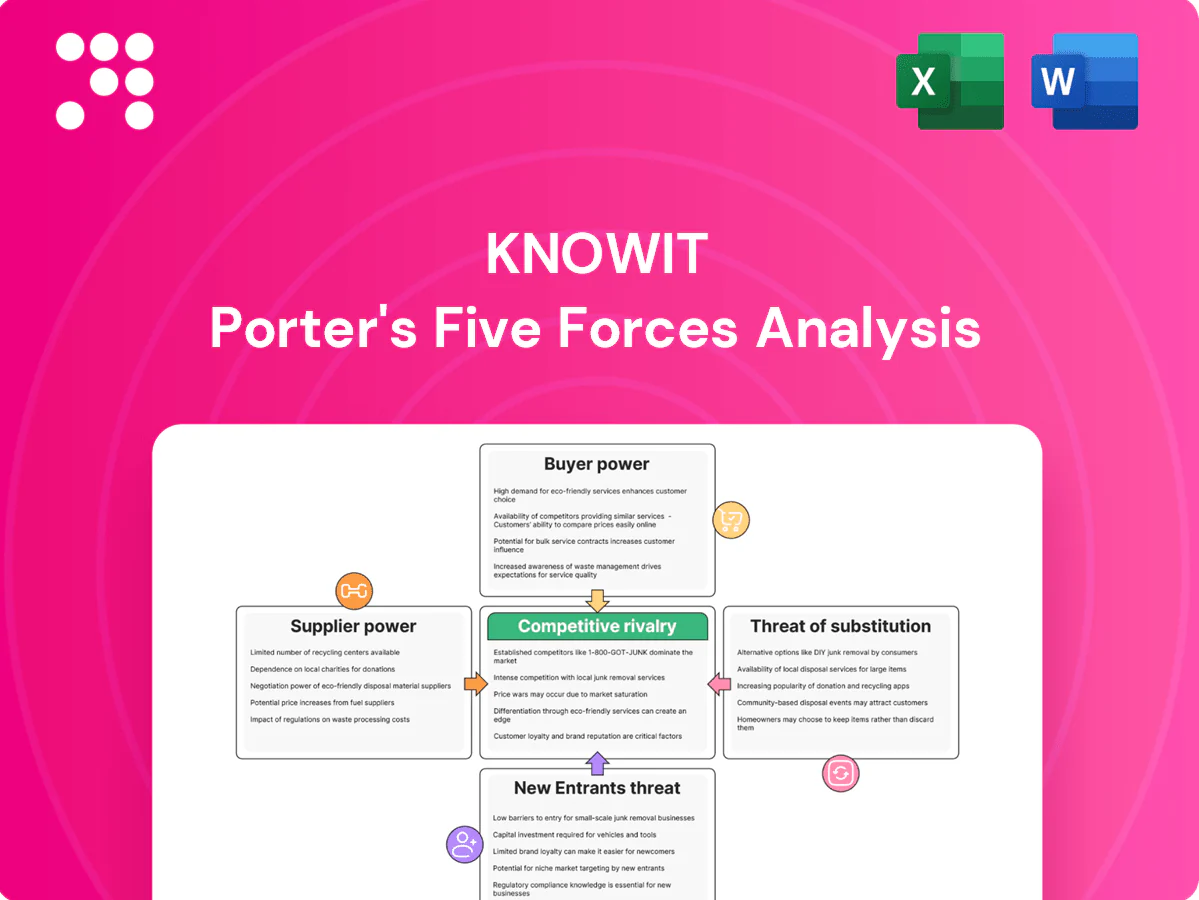
Knowit Porter's Five Forces Analysis

From Overview to Strategy Blueprint
Knowit's Porter's Five Forces snapshot highlights supplier and buyer pressures, competitive rivalry, threat of entrants and substitutes, and key strategic levers shaping its market position. It surfaces immediate risks and opportunities for investors and strategists in concise, actionable terms. This brief only scratches the surface — unlock the full Porter's Five Forces Analysis to explore Knowit’s competitive dynamics and strategic advantages in detail.
Suppliers Bargaining Power

Scarce senior tech talent
Senior architects and niche specialists remain scarce, giving talent suppliers leverage over rates and conditions; 2024 industry surveys report double-digit wage inflation for senior tech roles and many firms face >60% difficulty filling specialist positions. Remote work widens options for top talent, pushing Knowit costs up. Knowit must invest in EVP, training, nearshore hubs, strong bench planning and internal academies to reduce contractor reliance.
Dependence on hyperscalers
Platforms like AWS (≈32% market share), Microsoft Azure (≈23%) and Google Cloud (≈11%) act as quasi-suppliers through certifications, tooling and partner tiers, so price changes or certification rule shifts materially affect project economics. Multi-cloud proficiency and partner diversification reduce concentration risk. Building IP accelerators atop these platforms creates stickiness and buffers supplier-driven margin pressure.

Software license ecosystems
Enterprise tools shape stacks and licensing costs—Atlassian reported FY24 revenue of about $3.83B, illustrating license-driven pricing power that can inflate project budgets. Bundling and EULA shifts have compressed margins in fixed-price engagements, often forcing pass-through costs or scope cuts. Negotiating partner discounts and standardizing preferred stacks reduces volatility, while growing open-source adoption (present in the vast majority of codebases) and reusable components lower supplier dependency risk.

Specialist subcontractors
Peak-load delivery often requires niche boutiques or freelancers; in 2024 many Nordic consulting projects relied on specialist subcontractors for 25–40% of peak capacity, driving spot-rate uplifts and tighter short-term availability. When demand spikes subcontractor rates typically increase and lead times lengthen, making procurement sensitivity acute. Framework agreements and long-term panels secure better pricing and priority, while knowledge-transfer clauses reduce single-vendor dependency and continuity risk.
- Tags: specialist-subcontractors
- Tags: peak-load
- Tags: framework-agreements
- Tags: knowledge-transfer
Data and AI model providers
Access to proprietary data sets, LLM APIs and analytics tooling creates a supply bottleneck: 2024 API token pricing ranges roughly from $0.0001 to $0.03 per 1K tokens, directly compressing project margins and raising variable costs. Usage limits and rate caps force architecture trade-offs; favoring portable, model-agnostic patterns and co-developing proprietary assets reduces vendor lock-in and strengthens bargaining leverage.
- Data access concentration
- API token cost sensitivity
- Portable architectures mitigate lock-in
- Proprietary assets = stronger leverage
Talent scarcity, double-digit wages raise costs; cloud 32/23/11%
Talent scarcity (senior wage inflation double-digit in 2024; >60% specialist-fill difficulty) elevates supplier leverage and contractor costs. Cloud concentration (AWS 32%, Azure 23%, GCP 11%) and tool licensing (Atlassian FY24 revenue $3.83B) compress margins. Subcontractors supply 25–40% peak capacity and API token costs (~$0.0001–$0.03/1K tokens) create variable-cost pressure.
| Metric | 2024 Value |
|---|---|
| Senior fill difficulty | >60% |
| AWS/Azure/GCP share | 32%/23%/11% |
| Atlassian rev | $3.83B |
| Subcontractor peak | 25–40% |
| API token cost | $0.0001–$0.03/1K |
What is included in the product
 Detailed Word Document
Comprehensive Porter's Five Forces analysis tailored for Knowit, uncovering competitive drivers, buyer/supplier power, entry barriers, substitutes and disruptive threats; includes strategic commentary, industry data, editable Word format and ready-to-use insights for investor decks, business plans and strategy work.

 Customizable Excel Spreadsheet
A clear, one-sheet summary of all five forces—perfect for quick decision-making, with customizable pressure levels and an instant spider chart to visualize strategic pressure and relieve analysis bottlenecks.
Customers Bargaining Power

Procurement maturity
Large enterprises and public entities run competitive RFPs with strict SLAs and rate cards, driving strong price sensitivity; EU public procurement represented about 12% of GDP in 2024, underscoring the scale of tendered spend. These RFP processes commonly elongate sales cycles to 6–9 months. Differentiation via measurable outcomes, client references and domain IP counters pure price comparisons, while framework contracts and MSP relationships stabilize recurring volume.
Switching ease in services
Consulting outputs are often modular, so vendor switching is feasible and 2024 industry surveys indicate over 50% of buyers rate switching ease as a key procurement factor. Strong documentation and agile delivery paradoxically lower barriers to replacement by making handovers smoother. Deep technical integration, managed services and productized accelerators increase client stickiness. Value-based pricing tied to KPIs demonstrably reduces churn risk.

Budget cyclicality
IT spend flexes with macro cycles: Gartner estimated global IT spending at about $5.1 trillion in 2024, highlighting modest ~3% growth and shifting buyer leverage as budgets tighten. In downturns insourcing and project deferrals increase, intensifying discount pressure on vendors. Emphasizing cost-to-value narratives and efficiency programs helps preserve demand, while a balanced industry mix (public, finance, healthcare, manufacturing) diversifies exposure.

Demand for sustainability
Clients increasingly demand measurable sustainability impacts and reporting; the EU CSRD now extends mandatory sustainability disclosure to roughly 50,000 companies, raising buyer expectations. Vendors lacking credible ESG delivery lose negotiating ground while Knowit’s sustainability positioning can command a premium in green transformation. Embedding carbon analytics into delivery strengthens value and defensibility.
- Clients: mandatory disclosures (~50,000 firms under CSRD)
- Vendors: ESG credibility = negotiating power
- Knowit: premium for green transformation; carbon analytics = higher value
Outcome transparency
Outcome transparency lets clients benchmark vendors on velocity, quality and ROI; Gartner 2024 reported 66% of procurement leaders now use analytics for vendor benchmarking, boosting renegotiation leverage and average contract savings. Establishing joint success metrics and a continuous improvement cadence builds trust and reduces churn. Publishing case studies with quantified outcomes raises win rates and shortens sales cycles.
- Benchmarking: velocity, quality, ROI
- Contract leverage: renegotiation with analytics
- Trust: joint metrics + continuous improvement
- Proof: quantified case studies raise win rates
RFP power, long cycles and >50% switching ease force IT vendors toward ESG services
Buyers wield strong price leverage via RFPs (EU public procurement ~12% of GDP in 2024) and lengthy 6–9 month cycles; differentiation and framework contracts mitigate this. Over 50% of buyers rate switching ease high; deeper integration, managed services and KPI-based pricing raise stickiness. Global IT spend ~$5.1T (2024) and CSRD covering ~50,000 firms shift procurement toward measurable ESG outcomes.
| Metric | 2024 | Impact |
|---|---|---|
| EU public procurement | ~12% GDP | High tendered volume |
| Global IT spend | $5.1T | Moderate growth, buyer leverage |
| Buyer switching ease | >50% | Higher churn risk |
| CSRD scope | ~50,000 firms | ESG as procurement factor |
| Procurement analytics use | 66% | Renegotiation leverage |
What You See Is What You Get
Knowit Porter's Five Forces Analysis
This preview shows the exact Knowit Porter’s Five Forces Analysis you'll receive immediately after purchase—no surprises, no placeholders. The document displayed is the full, professionally written analysis and is ready for download and use the moment you buy. You’re viewing the actual file; instant access follows payment.

From Overview to Strategy Blueprint
Knowit's Porter's Five Forces snapshot highlights supplier and buyer pressures, competitive rivalry, threat of entrants and substitutes, and key strategic levers shaping its market position. It surfaces immediate risks and opportunities for investors and strategists in concise, actionable terms. This brief only scratches the surface — unlock the full Porter's Five Forces Analysis to explore Knowit’s competitive dynamics and strategic advantages in detail.
Suppliers Bargaining Power
Scarce senior tech talent
Senior architects and niche specialists remain scarce, giving talent suppliers leverage over rates and conditions; 2024 industry surveys report double-digit wage inflation for senior tech roles and many firms face >60% difficulty filling specialist positions. Remote work widens options for top talent, pushing Knowit costs up. Knowit must invest in EVP, training, nearshore hubs, strong bench planning and internal academies to reduce contractor reliance.
Dependence on hyperscalers
Platforms like AWS (≈32% market share), Microsoft Azure (≈23%) and Google Cloud (≈11%) act as quasi-suppliers through certifications, tooling and partner tiers, so price changes or certification rule shifts materially affect project economics. Multi-cloud proficiency and partner diversification reduce concentration risk. Building IP accelerators atop these platforms creates stickiness and buffers supplier-driven margin pressure.
Software license ecosystems
Enterprise tools shape stacks and licensing costs—Atlassian reported FY24 revenue of about $3.83B, illustrating license-driven pricing power that can inflate project budgets. Bundling and EULA shifts have compressed margins in fixed-price engagements, often forcing pass-through costs or scope cuts. Negotiating partner discounts and standardizing preferred stacks reduces volatility, while growing open-source adoption (present in the vast majority of codebases) and reusable components lower supplier dependency risk.
Specialist subcontractors
Peak-load delivery often requires niche boutiques or freelancers; in 2024 many Nordic consulting projects relied on specialist subcontractors for 25–40% of peak capacity, driving spot-rate uplifts and tighter short-term availability. When demand spikes subcontractor rates typically increase and lead times lengthen, making procurement sensitivity acute. Framework agreements and long-term panels secure better pricing and priority, while knowledge-transfer clauses reduce single-vendor dependency and continuity risk.
- Tags: specialist-subcontractors
- Tags: peak-load
- Tags: framework-agreements
- Tags: knowledge-transfer
Data and AI model providers
Access to proprietary data sets, LLM APIs and analytics tooling creates a supply bottleneck: 2024 API token pricing ranges roughly from $0.0001 to $0.03 per 1K tokens, directly compressing project margins and raising variable costs. Usage limits and rate caps force architecture trade-offs; favoring portable, model-agnostic patterns and co-developing proprietary assets reduces vendor lock-in and strengthens bargaining leverage.
- Data access concentration
- API token cost sensitivity
- Portable architectures mitigate lock-in
- Proprietary assets = stronger leverage
Talent scarcity, double-digit wages raise costs; cloud 32/23/11%
Talent scarcity (senior wage inflation double-digit in 2024; >60% specialist-fill difficulty) elevates supplier leverage and contractor costs. Cloud concentration (AWS 32%, Azure 23%, GCP 11%) and tool licensing (Atlassian FY24 revenue $3.83B) compress margins. Subcontractors supply 25–40% peak capacity and API token costs (~$0.0001–$0.03/1K tokens) create variable-cost pressure.
| Metric | 2024 Value |
|---|---|
| Senior fill difficulty | >60% |
| AWS/Azure/GCP share | 32%/23%/11% |
| Atlassian rev | $3.83B |
| Subcontractor peak | 25–40% |
| API token cost | $0.0001–$0.03/1K |
What is included in the product
Detailed Word Document
Comprehensive Porter's Five Forces analysis tailored for Knowit, uncovering competitive drivers, buyer/supplier power, entry barriers, substitutes and disruptive threats; includes strategic commentary, industry data, editable Word format and ready-to-use insights for investor decks, business plans and strategy work.
Customizable Excel Spreadsheet
A clear, one-sheet summary of all five forces—perfect for quick decision-making, with customizable pressure levels and an instant spider chart to visualize strategic pressure and relieve analysis bottlenecks.
Customers Bargaining Power
Procurement maturity
Large enterprises and public entities run competitive RFPs with strict SLAs and rate cards, driving strong price sensitivity; EU public procurement represented about 12% of GDP in 2024, underscoring the scale of tendered spend. These RFP processes commonly elongate sales cycles to 6–9 months. Differentiation via measurable outcomes, client references and domain IP counters pure price comparisons, while framework contracts and MSP relationships stabilize recurring volume.
Switching ease in services
Consulting outputs are often modular, so vendor switching is feasible and 2024 industry surveys indicate over 50% of buyers rate switching ease as a key procurement factor. Strong documentation and agile delivery paradoxically lower barriers to replacement by making handovers smoother. Deep technical integration, managed services and productized accelerators increase client stickiness. Value-based pricing tied to KPIs demonstrably reduces churn risk.
Budget cyclicality
IT spend flexes with macro cycles: Gartner estimated global IT spending at about $5.1 trillion in 2024, highlighting modest ~3% growth and shifting buyer leverage as budgets tighten. In downturns insourcing and project deferrals increase, intensifying discount pressure on vendors. Emphasizing cost-to-value narratives and efficiency programs helps preserve demand, while a balanced industry mix (public, finance, healthcare, manufacturing) diversifies exposure.
Demand for sustainability
Clients increasingly demand measurable sustainability impacts and reporting; the EU CSRD now extends mandatory sustainability disclosure to roughly 50,000 companies, raising buyer expectations. Vendors lacking credible ESG delivery lose negotiating ground while Knowit’s sustainability positioning can command a premium in green transformation. Embedding carbon analytics into delivery strengthens value and defensibility.
- Clients: mandatory disclosures (~50,000 firms under CSRD)
- Vendors: ESG credibility = negotiating power
- Knowit: premium for green transformation; carbon analytics = higher value
Outcome transparency
Outcome transparency lets clients benchmark vendors on velocity, quality and ROI; Gartner 2024 reported 66% of procurement leaders now use analytics for vendor benchmarking, boosting renegotiation leverage and average contract savings. Establishing joint success metrics and a continuous improvement cadence builds trust and reduces churn. Publishing case studies with quantified outcomes raises win rates and shortens sales cycles.
- Benchmarking: velocity, quality, ROI
- Contract leverage: renegotiation with analytics
- Trust: joint metrics + continuous improvement
- Proof: quantified case studies raise win rates
RFP power, long cycles and >50% switching ease force IT vendors toward ESG services
Buyers wield strong price leverage via RFPs (EU public procurement ~12% of GDP in 2024) and lengthy 6–9 month cycles; differentiation and framework contracts mitigate this. Over 50% of buyers rate switching ease high; deeper integration, managed services and KPI-based pricing raise stickiness. Global IT spend ~$5.1T (2024) and CSRD covering ~50,000 firms shift procurement toward measurable ESG outcomes.
| Metric | 2024 | Impact |
|---|---|---|
| EU public procurement | ~12% GDP | High tendered volume |
| Global IT spend | $5.1T | Moderate growth, buyer leverage |
| Buyer switching ease | >50% | Higher churn risk |
| CSRD scope | ~50,000 firms | ESG as procurement factor |
| Procurement analytics use | 66% | Renegotiation leverage |
What You See Is What You Get
Knowit Porter's Five Forces Analysis
This preview shows the exact Knowit Porter’s Five Forces Analysis you'll receive immediately after purchase—no surprises, no placeholders. The document displayed is the full, professionally written analysis and is ready for download and use the moment you buy. You’re viewing the actual file; instant access follows payment.
Description
From Overview to Strategy Blueprint
Knowit's Porter's Five Forces snapshot highlights supplier and buyer pressures, competitive rivalry, threat of entrants and substitutes, and key strategic levers shaping its market position. It surfaces immediate risks and opportunities for investors and strategists in concise, actionable terms. This brief only scratches the surface — unlock the full Porter's Five Forces Analysis to explore Knowit’s competitive dynamics and strategic advantages in detail.
Suppliers Bargaining Power
Scarce senior tech talent
Senior architects and niche specialists remain scarce, giving talent suppliers leverage over rates and conditions; 2024 industry surveys report double-digit wage inflation for senior tech roles and many firms face >60% difficulty filling specialist positions. Remote work widens options for top talent, pushing Knowit costs up. Knowit must invest in EVP, training, nearshore hubs, strong bench planning and internal academies to reduce contractor reliance.
Dependence on hyperscalers
Platforms like AWS (≈32% market share), Microsoft Azure (≈23%) and Google Cloud (≈11%) act as quasi-suppliers through certifications, tooling and partner tiers, so price changes or certification rule shifts materially affect project economics. Multi-cloud proficiency and partner diversification reduce concentration risk. Building IP accelerators atop these platforms creates stickiness and buffers supplier-driven margin pressure.
Software license ecosystems
Enterprise tools shape stacks and licensing costs—Atlassian reported FY24 revenue of about $3.83B, illustrating license-driven pricing power that can inflate project budgets. Bundling and EULA shifts have compressed margins in fixed-price engagements, often forcing pass-through costs or scope cuts. Negotiating partner discounts and standardizing preferred stacks reduces volatility, while growing open-source adoption (present in the vast majority of codebases) and reusable components lower supplier dependency risk.
Specialist subcontractors
Peak-load delivery often requires niche boutiques or freelancers; in 2024 many Nordic consulting projects relied on specialist subcontractors for 25–40% of peak capacity, driving spot-rate uplifts and tighter short-term availability. When demand spikes subcontractor rates typically increase and lead times lengthen, making procurement sensitivity acute. Framework agreements and long-term panels secure better pricing and priority, while knowledge-transfer clauses reduce single-vendor dependency and continuity risk.
- Tags: specialist-subcontractors
- Tags: peak-load
- Tags: framework-agreements
- Tags: knowledge-transfer
Data and AI model providers
Access to proprietary data sets, LLM APIs and analytics tooling creates a supply bottleneck: 2024 API token pricing ranges roughly from $0.0001 to $0.03 per 1K tokens, directly compressing project margins and raising variable costs. Usage limits and rate caps force architecture trade-offs; favoring portable, model-agnostic patterns and co-developing proprietary assets reduces vendor lock-in and strengthens bargaining leverage.
- Data access concentration
- API token cost sensitivity
- Portable architectures mitigate lock-in
- Proprietary assets = stronger leverage
Talent scarcity, double-digit wages raise costs; cloud 32/23/11%
Talent scarcity (senior wage inflation double-digit in 2024; >60% specialist-fill difficulty) elevates supplier leverage and contractor costs. Cloud concentration (AWS 32%, Azure 23%, GCP 11%) and tool licensing (Atlassian FY24 revenue $3.83B) compress margins. Subcontractors supply 25–40% peak capacity and API token costs (~$0.0001–$0.03/1K tokens) create variable-cost pressure.
| Metric | 2024 Value |
|---|---|
| Senior fill difficulty | >60% |
| AWS/Azure/GCP share | 32%/23%/11% |
| Atlassian rev | $3.83B |
| Subcontractor peak | 25–40% |
| API token cost | $0.0001–$0.03/1K |
What is included in the product
Detailed Word Document
Comprehensive Porter's Five Forces analysis tailored for Knowit, uncovering competitive drivers, buyer/supplier power, entry barriers, substitutes and disruptive threats; includes strategic commentary, industry data, editable Word format and ready-to-use insights for investor decks, business plans and strategy work.
Customizable Excel Spreadsheet
A clear, one-sheet summary of all five forces—perfect for quick decision-making, with customizable pressure levels and an instant spider chart to visualize strategic pressure and relieve analysis bottlenecks.
Customers Bargaining Power
Procurement maturity
Large enterprises and public entities run competitive RFPs with strict SLAs and rate cards, driving strong price sensitivity; EU public procurement represented about 12% of GDP in 2024, underscoring the scale of tendered spend. These RFP processes commonly elongate sales cycles to 6–9 months. Differentiation via measurable outcomes, client references and domain IP counters pure price comparisons, while framework contracts and MSP relationships stabilize recurring volume.
Switching ease in services
Consulting outputs are often modular, so vendor switching is feasible and 2024 industry surveys indicate over 50% of buyers rate switching ease as a key procurement factor. Strong documentation and agile delivery paradoxically lower barriers to replacement by making handovers smoother. Deep technical integration, managed services and productized accelerators increase client stickiness. Value-based pricing tied to KPIs demonstrably reduces churn risk.
Budget cyclicality
IT spend flexes with macro cycles: Gartner estimated global IT spending at about $5.1 trillion in 2024, highlighting modest ~3% growth and shifting buyer leverage as budgets tighten. In downturns insourcing and project deferrals increase, intensifying discount pressure on vendors. Emphasizing cost-to-value narratives and efficiency programs helps preserve demand, while a balanced industry mix (public, finance, healthcare, manufacturing) diversifies exposure.
Demand for sustainability
Clients increasingly demand measurable sustainability impacts and reporting; the EU CSRD now extends mandatory sustainability disclosure to roughly 50,000 companies, raising buyer expectations. Vendors lacking credible ESG delivery lose negotiating ground while Knowit’s sustainability positioning can command a premium in green transformation. Embedding carbon analytics into delivery strengthens value and defensibility.
- Clients: mandatory disclosures (~50,000 firms under CSRD)
- Vendors: ESG credibility = negotiating power
- Knowit: premium for green transformation; carbon analytics = higher value
Outcome transparency
Outcome transparency lets clients benchmark vendors on velocity, quality and ROI; Gartner 2024 reported 66% of procurement leaders now use analytics for vendor benchmarking, boosting renegotiation leverage and average contract savings. Establishing joint success metrics and a continuous improvement cadence builds trust and reduces churn. Publishing case studies with quantified outcomes raises win rates and shortens sales cycles.
- Benchmarking: velocity, quality, ROI
- Contract leverage: renegotiation with analytics
- Trust: joint metrics + continuous improvement
- Proof: quantified case studies raise win rates
RFP power, long cycles and >50% switching ease force IT vendors toward ESG services
Buyers wield strong price leverage via RFPs (EU public procurement ~12% of GDP in 2024) and lengthy 6–9 month cycles; differentiation and framework contracts mitigate this. Over 50% of buyers rate switching ease high; deeper integration, managed services and KPI-based pricing raise stickiness. Global IT spend ~$5.1T (2024) and CSRD covering ~50,000 firms shift procurement toward measurable ESG outcomes.
| Metric | 2024 | Impact |
|---|---|---|
| EU public procurement | ~12% GDP | High tendered volume |
| Global IT spend | $5.1T | Moderate growth, buyer leverage |
| Buyer switching ease | >50% | Higher churn risk |
| CSRD scope | ~50,000 firms | ESG as procurement factor |
| Procurement analytics use | 66% | Renegotiation leverage |
What You See Is What You Get
Knowit Porter's Five Forces Analysis
This preview shows the exact Knowit Porter’s Five Forces Analysis you'll receive immediately after purchase—no surprises, no placeholders. The document displayed is the full, professionally written analysis and is ready for download and use the moment you buy. You’re viewing the actual file; instant access follows payment.











