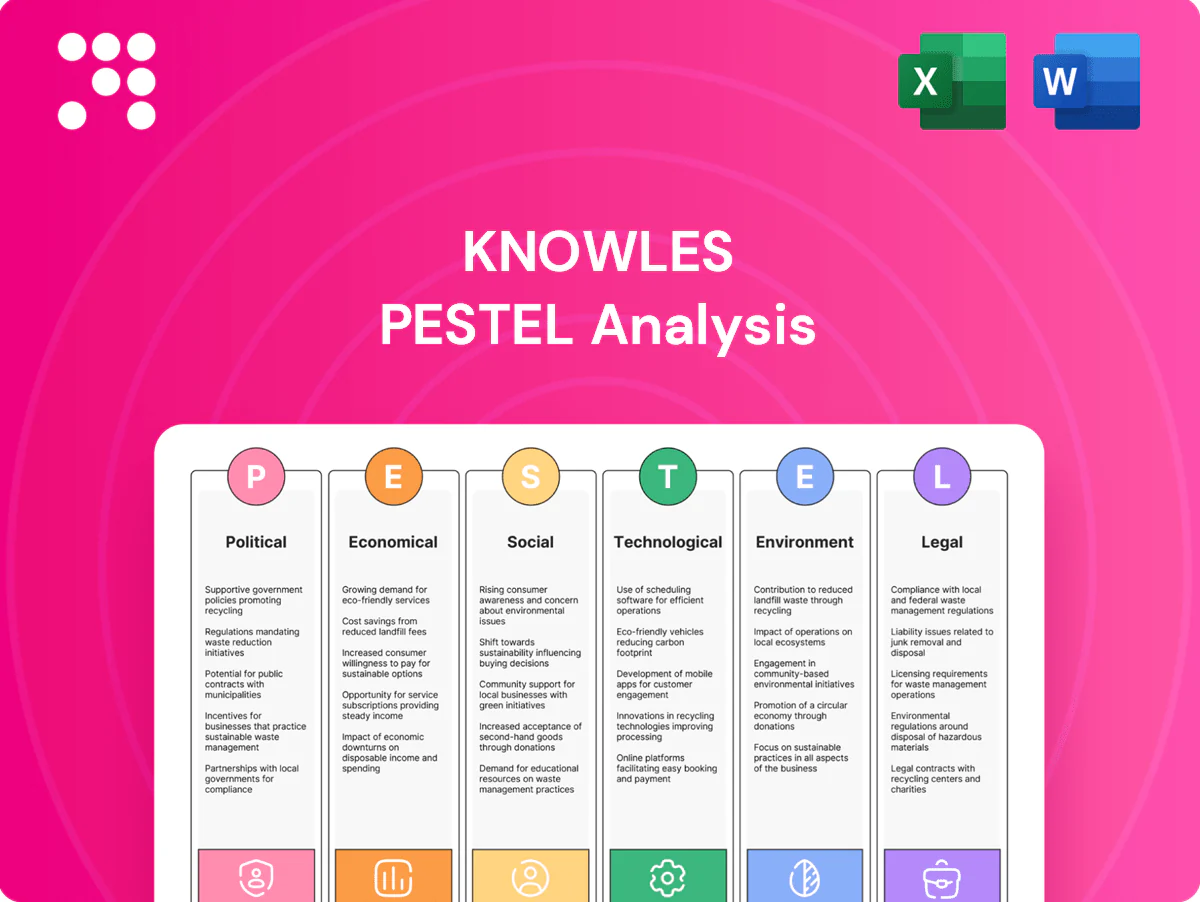
Knowles PESTLE Analysis

Make Smarter Strategic Decisions with a Complete PESTEL View
Unlock strategic clarity with our Knowles PESTLE Analysis—concise, data-driven insights into political, economic, social, technological, legal, and environmental forces shaping the company. Ideal for investors and strategists seeking actionable foresight. Purchase the full report to access the complete breakdown and immediately apply expert intelligence to your decisions.
Political factors

Trade policy volatility
Shifts in US-China and EU trade policy, including US Section 301 tariffs up to 25%, can raise costs on Knowles’ components and finished goods. Knowles’ globally distributed supply chain faces heightened cost and lead-time uncertainty, with 2023–24 shipping delays up to 20% in some regions. Relocations or dual-sourcing may be required to mitigate geopolitical shocks; CHIPS Act incentives of $52.7B and EU subsidies could offset relocation costs in select regions.
Export controls & defense
EAR/ITAR and allied regimes restrict defense and certain communications shipments, with licensing often taking 30–180 days and enforcement fines industry-wide exceeding $10m in recent cases. Complex licensing delays revenue recognition and raises compliance spend. Prioritizing non-restricted SKUs and keeping restricted revenue under 20% lowers concentration risk. Robust screening and audit trails are essential for traceability and defense against penalties.

Industrial policy subsidies
CHIPS-like subsidies (US CHIPS Act $52.7B) and regional incentives shift cost curves, lowering effective capex and OPEX for MEMS and packaging. Participation can finance significant capex—grants/credits often covering up to 30% of plant costs—while competitor access can mute relative pricing power. Site selection should prioritize jurisdictions offering the largest grant stacks.

Government procurement cycles
Defense, medical, and infrastructure programs are budget-driven and cyclical; U.S. defense discretionary spending was about 858 billion USD in FY2024 and the 1.2 trillion USD IIJA (2021) continues to pace infrastructure outlays through 2026, shifting demand timing for specialized audio and sensing with elections every 2–4 years altering fiscal priorities. Multi-year contracts (typically 3–5 years) improve visibility but require stringent qualification and compliance; diversifying end-markets smooths budget shocks.
- Budget-driven cycles: defense 858B (FY2024)
- Election timing: 2–4 year shifts
- Contracts: 3–5 year multi-year visibility
- Strategy: diversify end-markets to reduce volatility
Sanctions & geopolitical risk
Sanctions and export controls (eg 2024 US restrictions on advanced semiconductors to China) can abruptly cut Knowles sales channels and technology transfers, forcing revenue reallocation. Geopolitical tensions raise logistics disruption risk and push carrier/war-risk insurance premiums markedly higher, increasing COGS. Scenario planning for regional outages and inventory/supplier buffers reduces downtime and mitigates lost production.
- Sanctions risk: abrupt market loss
- Insurance: higher premiums on high-risk routes
- Action: scenario planning
- Mitigation: inventory & supplier buffers
Tariffs, export controls and CHIPS aid reshape supply chains; defense spend fuels timing risk
Geopolitical trade shifts (US tariffs up to 25%) and 2024 semiconductor export controls raise costs and channel risk for Knowles, forcing dual-sourcing and inventory buffers. CHIPS Act $52.7B and grants often covering ~30% of capex lower relocation costs but increase competitor subsidy access. Defense cycles (US defense $858B FY2024) and 3–5yr contracts drive demand timing and compliance burdens.
| Risk | Key figure |
|---|---|
| CHIPS subsidies | $52.7B / ~30% capex |
| Defense spend | $858B FY2024 |
| Tariffs/controls | Tariffs up to 25% / licensing 30–180 days |
What is included in the product
 Detailed Word Document
Explores how external macro-environmental factors uniquely affect Knowles across Political, Economic, Social, Technological, Environmental, and Legal dimensions, with data-backed trends, actionable insights for executives and investors, and forward-looking implications tailored to Knowles's industry and region.

 Customizable Excel Spreadsheet
Condenses Knowles' full PESTLE into a clean, visually segmented summary for quick reference in meetings or slides, with editable notes to tailor risks and opportunities to specific regions or product lines.
Economic factors

Consumer device cycles
Smartphone and ear-wear cycles drive most microphone and audio demand: global smartphone shipments were about 1.18 billion in 2024 (IDC) and true-wireless earbud shipments ~420 million in 2024 (Canalys), underpinning Knowles’ TAM. Weak macro conditions have compressed premium device mix and ASPs, pressuring revenue per unit. Design wins create multi-year tailwinds but are highly sensitive to OEM launch timing, so forecasts must integrate OEM build plans and channel inventories.
FX and cost inflation
Knowles reports revenue in USD (≈$1.0B annual run-rate) while significant portions of wages, wafers, substrates and logistics are paid in non-USD currencies, exposing margins to FX swings. Ongoing wage and materials inflation has compressed gross margin by several percentage points year-over-year. Active hedging and multi-year supplier agreements have stabilized COGS. Pricing clauses with key OEM customers help share inflationary pressure.

Customer concentration
Large mobile and hearables OEMs can represent significant revenue share (top customers often exceed 20%); Knowles has historically faced high customer concentration. Their bargaining power drives pricing pressure and stringent qualification hurdles, compressing margins. Winning sockets across multiple OEM tiers reduces dependence and can lower top-customer share. Growth in aftermarket and industrial niches—aligned with a ~460 million TWS shipment market in 2024—boosts mix resilience.

Inventory & supply cycles
Silicon and MEMS lead times commonly range 12–26 weeks while OEM demand visibility often spans only 6–12 weeks, producing bullwhip effects that magnify order swings across the supply chain. Overbuilds historically force discounting and inventory write-downs, while shortages result in lost socket opportunities and revenue; flexible capacity contracts reduce downside exposure. Strong S&OP discipline and VMI with key customers smooth variability and improve turns.
- Lead times: 12–26 weeks
- OEM visibility: 6–12 weeks
- Mitigants: S&OP, VMI, flexible capacity
Interest rates & capital access
- Higher rates: feds 5.25–5.50%
- 10‑yr ~4.0%
- Multiples: mid‑single‑digit EV/EBITDA (2024)
- Practical stance: prioritize FCF, low leverage, selective returns
Tariffs, export controls and CHIPS aid reshape supply chains; defense spend fuels timing risk
Smartphone shipments ~1.18B and TWS ~420M in 2024 underpin Knowles’ TAM but weak premium mix/ASPs pressure revenue per unit. FX, wage and materials inflation cut gross margin; revenue ≈$1.0B run‑rate. High customer concentration, 12–26 week silicon/MEMS lead times and 6–12 week OEM visibility amplify volatility; higher rates (fed 5.25–5.50%, 10y ~4.0%) make FCF and low leverage critical.
| Metric | 2024/25 |
|---|---|
| Smartphones | ~1.18B (2024) |
| TWS | ~420M (2024) |
| Knowles rev | ~$1.0B run‑rate |
| Lead times / OEM vis | 12–26wk / 6–12wk |
| Rates | Fed 5.25–5.50%, 10y ~4.0% |
| Multiples | Mid‑single‑digit EV/EBITDA (2024) |
Preview Before You Purchase
Knowles PESTLE Analysis
The preview shown here is the exact Knowles PESTLE Analysis you’ll receive after purchase—fully formatted, professionally structured, and ready to use. This screenshot reflects the complete content and layout with no placeholders or edits. After payment you’ll instantly download the same final document pictured here.

Make Smarter Strategic Decisions with a Complete PESTEL View
Unlock strategic clarity with our Knowles PESTLE Analysis—concise, data-driven insights into political, economic, social, technological, legal, and environmental forces shaping the company. Ideal for investors and strategists seeking actionable foresight. Purchase the full report to access the complete breakdown and immediately apply expert intelligence to your decisions.
Political factors
Trade policy volatility
Shifts in US-China and EU trade policy, including US Section 301 tariffs up to 25%, can raise costs on Knowles’ components and finished goods. Knowles’ globally distributed supply chain faces heightened cost and lead-time uncertainty, with 2023–24 shipping delays up to 20% in some regions. Relocations or dual-sourcing may be required to mitigate geopolitical shocks; CHIPS Act incentives of $52.7B and EU subsidies could offset relocation costs in select regions.
Export controls & defense
EAR/ITAR and allied regimes restrict defense and certain communications shipments, with licensing often taking 30–180 days and enforcement fines industry-wide exceeding $10m in recent cases. Complex licensing delays revenue recognition and raises compliance spend. Prioritizing non-restricted SKUs and keeping restricted revenue under 20% lowers concentration risk. Robust screening and audit trails are essential for traceability and defense against penalties.
Industrial policy subsidies
CHIPS-like subsidies (US CHIPS Act $52.7B) and regional incentives shift cost curves, lowering effective capex and OPEX for MEMS and packaging. Participation can finance significant capex—grants/credits often covering up to 30% of plant costs—while competitor access can mute relative pricing power. Site selection should prioritize jurisdictions offering the largest grant stacks.
Government procurement cycles
Defense, medical, and infrastructure programs are budget-driven and cyclical; U.S. defense discretionary spending was about 858 billion USD in FY2024 and the 1.2 trillion USD IIJA (2021) continues to pace infrastructure outlays through 2026, shifting demand timing for specialized audio and sensing with elections every 2–4 years altering fiscal priorities. Multi-year contracts (typically 3–5 years) improve visibility but require stringent qualification and compliance; diversifying end-markets smooths budget shocks.
- Budget-driven cycles: defense 858B (FY2024)
- Election timing: 2–4 year shifts
- Contracts: 3–5 year multi-year visibility
- Strategy: diversify end-markets to reduce volatility
Sanctions & geopolitical risk
Sanctions and export controls (eg 2024 US restrictions on advanced semiconductors to China) can abruptly cut Knowles sales channels and technology transfers, forcing revenue reallocation. Geopolitical tensions raise logistics disruption risk and push carrier/war-risk insurance premiums markedly higher, increasing COGS. Scenario planning for regional outages and inventory/supplier buffers reduces downtime and mitigates lost production.
- Sanctions risk: abrupt market loss
- Insurance: higher premiums on high-risk routes
- Action: scenario planning
- Mitigation: inventory & supplier buffers
Tariffs, export controls and CHIPS aid reshape supply chains; defense spend fuels timing risk
Geopolitical trade shifts (US tariffs up to 25%) and 2024 semiconductor export controls raise costs and channel risk for Knowles, forcing dual-sourcing and inventory buffers. CHIPS Act $52.7B and grants often covering ~30% of capex lower relocation costs but increase competitor subsidy access. Defense cycles (US defense $858B FY2024) and 3–5yr contracts drive demand timing and compliance burdens.
| Risk | Key figure |
|---|---|
| CHIPS subsidies | $52.7B / ~30% capex |
| Defense spend | $858B FY2024 |
| Tariffs/controls | Tariffs up to 25% / licensing 30–180 days |
What is included in the product
Detailed Word Document
Explores how external macro-environmental factors uniquely affect Knowles across Political, Economic, Social, Technological, Environmental, and Legal dimensions, with data-backed trends, actionable insights for executives and investors, and forward-looking implications tailored to Knowles's industry and region.
Customizable Excel Spreadsheet
Condenses Knowles' full PESTLE into a clean, visually segmented summary for quick reference in meetings or slides, with editable notes to tailor risks and opportunities to specific regions or product lines.
Economic factors
Consumer device cycles
Smartphone and ear-wear cycles drive most microphone and audio demand: global smartphone shipments were about 1.18 billion in 2024 (IDC) and true-wireless earbud shipments ~420 million in 2024 (Canalys), underpinning Knowles’ TAM. Weak macro conditions have compressed premium device mix and ASPs, pressuring revenue per unit. Design wins create multi-year tailwinds but are highly sensitive to OEM launch timing, so forecasts must integrate OEM build plans and channel inventories.
FX and cost inflation
Knowles reports revenue in USD (≈$1.0B annual run-rate) while significant portions of wages, wafers, substrates and logistics are paid in non-USD currencies, exposing margins to FX swings. Ongoing wage and materials inflation has compressed gross margin by several percentage points year-over-year. Active hedging and multi-year supplier agreements have stabilized COGS. Pricing clauses with key OEM customers help share inflationary pressure.
Customer concentration
Large mobile and hearables OEMs can represent significant revenue share (top customers often exceed 20%); Knowles has historically faced high customer concentration. Their bargaining power drives pricing pressure and stringent qualification hurdles, compressing margins. Winning sockets across multiple OEM tiers reduces dependence and can lower top-customer share. Growth in aftermarket and industrial niches—aligned with a ~460 million TWS shipment market in 2024—boosts mix resilience.
Inventory & supply cycles
Silicon and MEMS lead times commonly range 12–26 weeks while OEM demand visibility often spans only 6–12 weeks, producing bullwhip effects that magnify order swings across the supply chain. Overbuilds historically force discounting and inventory write-downs, while shortages result in lost socket opportunities and revenue; flexible capacity contracts reduce downside exposure. Strong S&OP discipline and VMI with key customers smooth variability and improve turns.
- Lead times: 12–26 weeks
- OEM visibility: 6–12 weeks
- Mitigants: S&OP, VMI, flexible capacity
Interest rates & capital access
- Higher rates: feds 5.25–5.50%
- 10‑yr ~4.0%
- Multiples: mid‑single‑digit EV/EBITDA (2024)
- Practical stance: prioritize FCF, low leverage, selective returns
Tariffs, export controls and CHIPS aid reshape supply chains; defense spend fuels timing risk
Smartphone shipments ~1.18B and TWS ~420M in 2024 underpin Knowles’ TAM but weak premium mix/ASPs pressure revenue per unit. FX, wage and materials inflation cut gross margin; revenue ≈$1.0B run‑rate. High customer concentration, 12–26 week silicon/MEMS lead times and 6–12 week OEM visibility amplify volatility; higher rates (fed 5.25–5.50%, 10y ~4.0%) make FCF and low leverage critical.
| Metric | 2024/25 |
|---|---|
| Smartphones | ~1.18B (2024) |
| TWS | ~420M (2024) |
| Knowles rev | ~$1.0B run‑rate |
| Lead times / OEM vis | 12–26wk / 6–12wk |
| Rates | Fed 5.25–5.50%, 10y ~4.0% |
| Multiples | Mid‑single‑digit EV/EBITDA (2024) |
Preview Before You Purchase
Knowles PESTLE Analysis
The preview shown here is the exact Knowles PESTLE Analysis you’ll receive after purchase—fully formatted, professionally structured, and ready to use. This screenshot reflects the complete content and layout with no placeholders or edits. After payment you’ll instantly download the same final document pictured here.
Original: $10.00
-65%$10.00
$3.50Description
Make Smarter Strategic Decisions with a Complete PESTEL View
Unlock strategic clarity with our Knowles PESTLE Analysis—concise, data-driven insights into political, economic, social, technological, legal, and environmental forces shaping the company. Ideal for investors and strategists seeking actionable foresight. Purchase the full report to access the complete breakdown and immediately apply expert intelligence to your decisions.
Political factors
Trade policy volatility
Shifts in US-China and EU trade policy, including US Section 301 tariffs up to 25%, can raise costs on Knowles’ components and finished goods. Knowles’ globally distributed supply chain faces heightened cost and lead-time uncertainty, with 2023–24 shipping delays up to 20% in some regions. Relocations or dual-sourcing may be required to mitigate geopolitical shocks; CHIPS Act incentives of $52.7B and EU subsidies could offset relocation costs in select regions.
Export controls & defense
EAR/ITAR and allied regimes restrict defense and certain communications shipments, with licensing often taking 30–180 days and enforcement fines industry-wide exceeding $10m in recent cases. Complex licensing delays revenue recognition and raises compliance spend. Prioritizing non-restricted SKUs and keeping restricted revenue under 20% lowers concentration risk. Robust screening and audit trails are essential for traceability and defense against penalties.
Industrial policy subsidies
CHIPS-like subsidies (US CHIPS Act $52.7B) and regional incentives shift cost curves, lowering effective capex and OPEX for MEMS and packaging. Participation can finance significant capex—grants/credits often covering up to 30% of plant costs—while competitor access can mute relative pricing power. Site selection should prioritize jurisdictions offering the largest grant stacks.
Government procurement cycles
Defense, medical, and infrastructure programs are budget-driven and cyclical; U.S. defense discretionary spending was about 858 billion USD in FY2024 and the 1.2 trillion USD IIJA (2021) continues to pace infrastructure outlays through 2026, shifting demand timing for specialized audio and sensing with elections every 2–4 years altering fiscal priorities. Multi-year contracts (typically 3–5 years) improve visibility but require stringent qualification and compliance; diversifying end-markets smooths budget shocks.
- Budget-driven cycles: defense 858B (FY2024)
- Election timing: 2–4 year shifts
- Contracts: 3–5 year multi-year visibility
- Strategy: diversify end-markets to reduce volatility
Sanctions & geopolitical risk
Sanctions and export controls (eg 2024 US restrictions on advanced semiconductors to China) can abruptly cut Knowles sales channels and technology transfers, forcing revenue reallocation. Geopolitical tensions raise logistics disruption risk and push carrier/war-risk insurance premiums markedly higher, increasing COGS. Scenario planning for regional outages and inventory/supplier buffers reduces downtime and mitigates lost production.
- Sanctions risk: abrupt market loss
- Insurance: higher premiums on high-risk routes
- Action: scenario planning
- Mitigation: inventory & supplier buffers
Tariffs, export controls and CHIPS aid reshape supply chains; defense spend fuels timing risk
Geopolitical trade shifts (US tariffs up to 25%) and 2024 semiconductor export controls raise costs and channel risk for Knowles, forcing dual-sourcing and inventory buffers. CHIPS Act $52.7B and grants often covering ~30% of capex lower relocation costs but increase competitor subsidy access. Defense cycles (US defense $858B FY2024) and 3–5yr contracts drive demand timing and compliance burdens.
| Risk | Key figure |
|---|---|
| CHIPS subsidies | $52.7B / ~30% capex |
| Defense spend | $858B FY2024 |
| Tariffs/controls | Tariffs up to 25% / licensing 30–180 days |
What is included in the product
Detailed Word Document
Explores how external macro-environmental factors uniquely affect Knowles across Political, Economic, Social, Technological, Environmental, and Legal dimensions, with data-backed trends, actionable insights for executives and investors, and forward-looking implications tailored to Knowles's industry and region.
Customizable Excel Spreadsheet
Condenses Knowles' full PESTLE into a clean, visually segmented summary for quick reference in meetings or slides, with editable notes to tailor risks and opportunities to specific regions or product lines.
Economic factors
Consumer device cycles
Smartphone and ear-wear cycles drive most microphone and audio demand: global smartphone shipments were about 1.18 billion in 2024 (IDC) and true-wireless earbud shipments ~420 million in 2024 (Canalys), underpinning Knowles’ TAM. Weak macro conditions have compressed premium device mix and ASPs, pressuring revenue per unit. Design wins create multi-year tailwinds but are highly sensitive to OEM launch timing, so forecasts must integrate OEM build plans and channel inventories.
FX and cost inflation
Knowles reports revenue in USD (≈$1.0B annual run-rate) while significant portions of wages, wafers, substrates and logistics are paid in non-USD currencies, exposing margins to FX swings. Ongoing wage and materials inflation has compressed gross margin by several percentage points year-over-year. Active hedging and multi-year supplier agreements have stabilized COGS. Pricing clauses with key OEM customers help share inflationary pressure.
Customer concentration
Large mobile and hearables OEMs can represent significant revenue share (top customers often exceed 20%); Knowles has historically faced high customer concentration. Their bargaining power drives pricing pressure and stringent qualification hurdles, compressing margins. Winning sockets across multiple OEM tiers reduces dependence and can lower top-customer share. Growth in aftermarket and industrial niches—aligned with a ~460 million TWS shipment market in 2024—boosts mix resilience.
Inventory & supply cycles
Silicon and MEMS lead times commonly range 12–26 weeks while OEM demand visibility often spans only 6–12 weeks, producing bullwhip effects that magnify order swings across the supply chain. Overbuilds historically force discounting and inventory write-downs, while shortages result in lost socket opportunities and revenue; flexible capacity contracts reduce downside exposure. Strong S&OP discipline and VMI with key customers smooth variability and improve turns.
- Lead times: 12–26 weeks
- OEM visibility: 6–12 weeks
- Mitigants: S&OP, VMI, flexible capacity
Interest rates & capital access
- Higher rates: feds 5.25–5.50%
- 10‑yr ~4.0%
- Multiples: mid‑single‑digit EV/EBITDA (2024)
- Practical stance: prioritize FCF, low leverage, selective returns
Tariffs, export controls and CHIPS aid reshape supply chains; defense spend fuels timing risk
Smartphone shipments ~1.18B and TWS ~420M in 2024 underpin Knowles’ TAM but weak premium mix/ASPs pressure revenue per unit. FX, wage and materials inflation cut gross margin; revenue ≈$1.0B run‑rate. High customer concentration, 12–26 week silicon/MEMS lead times and 6–12 week OEM visibility amplify volatility; higher rates (fed 5.25–5.50%, 10y ~4.0%) make FCF and low leverage critical.
| Metric | 2024/25 |
|---|---|
| Smartphones | ~1.18B (2024) |
| TWS | ~420M (2024) |
| Knowles rev | ~$1.0B run‑rate |
| Lead times / OEM vis | 12–26wk / 6–12wk |
| Rates | Fed 5.25–5.50%, 10y ~4.0% |
| Multiples | Mid‑single‑digit EV/EBITDA (2024) |
Preview Before You Purchase
Knowles PESTLE Analysis
The preview shown here is the exact Knowles PESTLE Analysis you’ll receive after purchase—fully formatted, professionally structured, and ready to use. This screenshot reflects the complete content and layout with no placeholders or edits. After payment you’ll instantly download the same final document pictured here.











