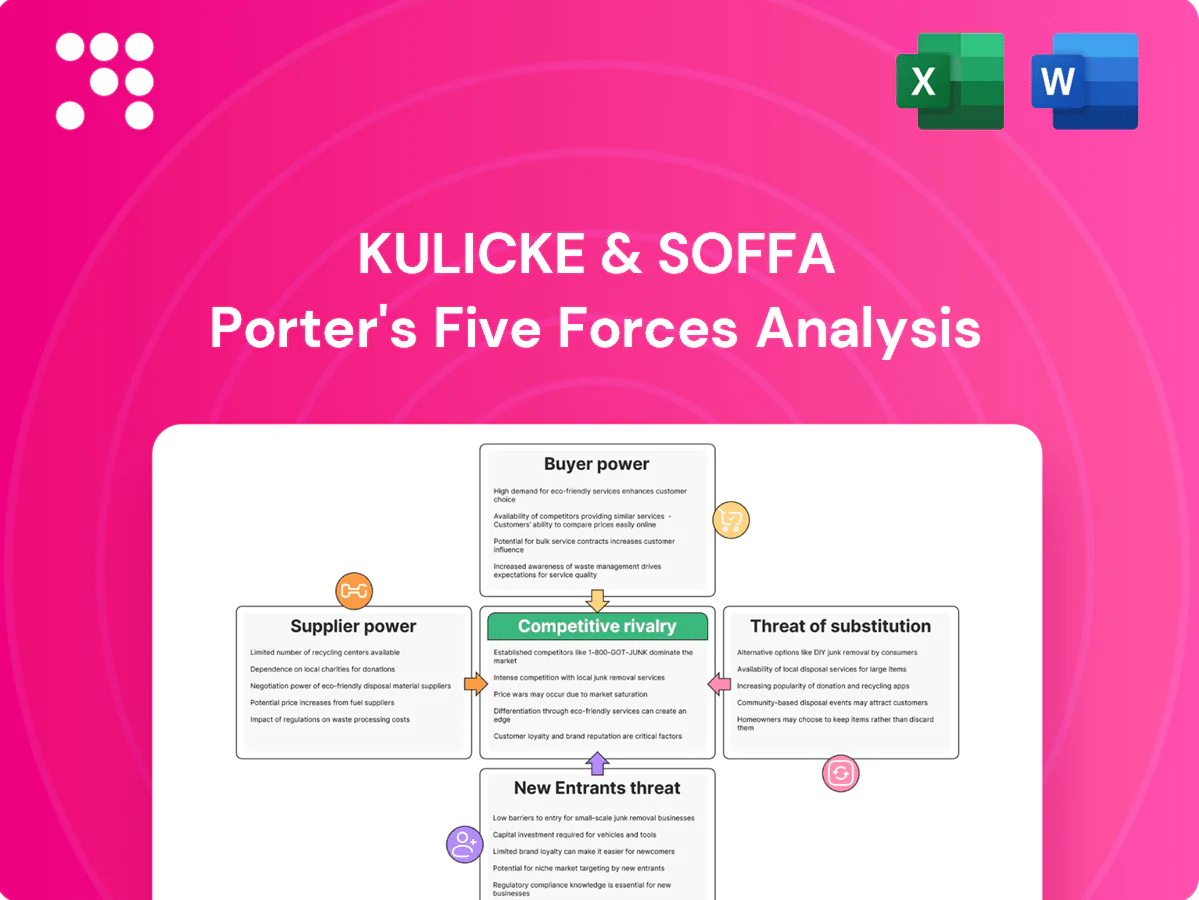
Kulicke & Soffa Porter's Five Forces Analysis

Don't Miss the Bigger Picture
Kulicke & Soffa faces intense supplier and buyer dynamics, evolving substitute threats from advanced packaging technologies, and moderate entry barriers driven by capital and IP. This snapshot highlights competitive rivalry, pricing pressure, and strategic levers management can deploy to protect margins. This brief snapshot only scratches the surface. Unlock the full Porter's Five Forces Analysis to explore Kulicke & Soffa’s competitive dynamics, market pressures, and strategic advantages in detail.
Suppliers Bargaining Power

Specialized components concentration
Precision motion systems, lasers, high-speed vision and vacuum parts come from a narrow vendor pool, giving key suppliers elevated leverage over K&S. Lengthy qualification cycles and tight tolerances increase switching friction, so K&S uses multi-sourcing where feasible and holds inventory buffers to reduce disruption. Single-sourced critical items still compress lead times and raise pricing power during upcycles, impacting margins and delivery.
Materials and consumables dependency
Expendables such as capillaries, bonding tools and specialty alloys are niche, quality-critical inputs that create supplier stickiness; Kulicke & Soffa reported fiscal 2024 revenue of about $1.06 billion, underscoring reliance on consistent tool performance. Supplier know-how and proprietary formulations limit switching, so long-term agreements are used to stabilize cost and supply. Any disruption can ripple into tool uptime and wafer yields, amplifying customer risk.

Technology co-development
Next-gen packaging like fine-pitch and hybrid processes often requires co-development with upstream component vendors, and Kulicke & Soffa reported fiscal 2024 revenue of about $1.07 billion, reflecting heavy exposure to advanced-packaging ramps. Shared roadmaps can lock in preferred suppliers and embed their IP, accelerating innovation but increasing supplier dependence. Bargaining power tilts toward differentiated suppliers during node transitions, where unique process IP and limited capacity create leverage.

Logistics and geopolitical exposure
Global export controls, tariffs and regionalization in 2024 have tightened access to high-spec components, raising supplier bargaining power as lead-time volatility—reported up roughly 30% versus 2019 baselines—amplifies leverage in tight markets. K&S must expand diversified manufacturing footprints and strengthen compliance to mitigate disruptions, while localization pressures favor entrenched regional suppliers with faster delivery and regulatory alignment.
- Higher lead times ~+30% vs 2019
- Concentration of advanced components in APAC increases supplier power
- Compliance and footprint diversification = strategic priority for K&S
- Localization benefits incumbent regional suppliers
Switching costs and qualification
Requalifying critical parts risks delays, performance drift, and customer requalification, often requiring 6–12 months in semiconductor assembly, which inflates effective switching costs and gives incumbents pricing latitude; framework agreements and design-for-dual-sourcing mitigate this, but time-to-qualify remains a supplier bargaining chip.
- 6–12 months typical qualification window
- Initial yield drops can be 5–10%
- Frameworks reduce but do not eliminate risk
Precision suppliers gain leverage as qualification takes 6–12 months
Suppliers of precision motion, optics and consumables hold elevated leverage due to narrow sources, long 6–12 month qualification windows and tight tolerances, pressuring margins during upcycles; K&S reported fiscal 2024 revenue ~$1.06B. Lead times rose ~30% vs 2019, boosting supplier bargaining during node shifts and localization. Framework agreements and multi-sourcing mitigate but do not remove supplier power.
| Metric | Value |
|---|---|
| FY2024 Revenue | $1.06B |
| Lead time change vs 2019 | +30% |
| Qualification time | 6–12 months |
| Initial yield drop | 5–10% |
What is included in the product
 Detailed Word Document
Tailored Porter's Five Forces analysis for Kulicke & Soffa that uncovers key drivers of competition, buyer and supplier power, and barriers to entry while identifying disruptive threats, substitutes, and strategic levers to protect market share and profitability.

 Customizable Excel Spreadsheet
Clear one-sheet Porter's Five Forces for Kulicke & Soffa — instantly visualize supplier, buyer, rivalry, new entrant, and substitute pressures with editable scores and a radar chart to simplify strategic decisions and create slide-ready reporting.
Customers Bargaining Power

Customer concentration
Large IDMs, OSATs, foundries, and EMS customers concentrate buying power for Kulicke & Soffa, enabling demands for volume discounts, extended payment terms, and bespoke tool customization.
Such concentration means losing a single top account can materially impact quarterly revenue and capacity utilization for K&S.
Additionally, the referenceability of marquee customers materially influences pipeline wins, as endorsement by leading IDMs and foundries accelerates adoption among prospects.
High switching and integration costs
Equipment integration with factory MES, recipes and yield baselines creates high switching costs—advanced tool changes and MES rework can run into millions and deter swaps. Process requalification commonly requires 6–12 months and operator retraining further raises time and expense, tempering buyer leverage after installation. During new line build-outs, however, competitive bake-offs and multi-vendor bids—common when fabs cost >$5 billion—restore bargaining power.

Cyclical capex timing
Semi/electronics cycles drive batch purchasing and timing leverage; SEMI reported global equipment spending rebounded to about $94B in 2024, amplifying buyer timing power. In downturns buyers demand price concessions and service bundling, while 2024 upcycles put premium on shorter lead times and delivery priority over price. Kulicke & Soffa must flex pricing and backlog management to match these swings, given ~ $1.11B 2024 revenue scale.

Performance and SLA sensitivity
Uptime, throughput and yield drive TCO in semiconductor equipment, with buyers routinely demanding three to five nines of availability (99.9–99.99%) and tying penalties to SLA breaches; proven process capability lets Kulicke & Soffa justify premium pricing. Poor field support quickly erodes negotiating power, while high service quality is often the decisive lever in renewals and add-on sales.
- Uptime expectation: 99.9–99.99%
- Process capability: supports premium pricing
- Field support: major determinant of negotiation strength
- Service quality: key for renewals/add-ons
Customization and roadmap influence
Strategic accounts shape Kulicke & Soffa product features and roadmaps, extracting tailored solutions and driving product direction; in 2024 this co-development emphasis strengthened OEM lock-in. Such customization often requires NRE concessions and scope-flexible pricing. Joint development deals trade margin for footprint expansion, while early engagement secures spec wins and long-term pull-through.
- Strategic accounts: roadmap influence
- NRE: concession risk
- JVs: margin for footprint
- Early engagement: spec wins
Buyers can dent $1.11B revenue; uptime and service command premiums
Buyers (large IDMs, OSATs, foundries, EMS) concentrate purchasing power, demanding discounts, extended terms and customization; losing one top account can dent K&S's ~$1.11B 2024 revenue. High switching costs (6–12 month requalification, MES integration) limit post-install leverage, but new fab multi-vendor bids and 2024 $94B equipment spend restore buyer timing power. Uptime (99.9–99.99%) and service quality drive negotiation outcomes and premium pricing.
| Metric | 2024 Value |
|---|---|
| K&S Revenue | $1.11B |
| Global Equipment Spend (SEMI) | $94B |
| Uptime Expectation | 99.9–99.99% |
| Requalification Time | 6–12 months |
Same Document Delivered
Kulicke & Soffa Porter's Five Forces Analysis
This preview shows the exact Kulicke & Soffa Porter’s Five Forces analysis you’ll receive immediately after purchase—no surprises or placeholders. The file is the full, professionally formatted document, ready for download and use the moment you buy, covering competitive rivalry, supplier and buyer power, and threats of entry and substitutes.

Don't Miss the Bigger Picture
Kulicke & Soffa faces intense supplier and buyer dynamics, evolving substitute threats from advanced packaging technologies, and moderate entry barriers driven by capital and IP. This snapshot highlights competitive rivalry, pricing pressure, and strategic levers management can deploy to protect margins. This brief snapshot only scratches the surface. Unlock the full Porter's Five Forces Analysis to explore Kulicke & Soffa’s competitive dynamics, market pressures, and strategic advantages in detail.
Suppliers Bargaining Power
Specialized components concentration
Precision motion systems, lasers, high-speed vision and vacuum parts come from a narrow vendor pool, giving key suppliers elevated leverage over K&S. Lengthy qualification cycles and tight tolerances increase switching friction, so K&S uses multi-sourcing where feasible and holds inventory buffers to reduce disruption. Single-sourced critical items still compress lead times and raise pricing power during upcycles, impacting margins and delivery.
Materials and consumables dependency
Expendables such as capillaries, bonding tools and specialty alloys are niche, quality-critical inputs that create supplier stickiness; Kulicke & Soffa reported fiscal 2024 revenue of about $1.06 billion, underscoring reliance on consistent tool performance. Supplier know-how and proprietary formulations limit switching, so long-term agreements are used to stabilize cost and supply. Any disruption can ripple into tool uptime and wafer yields, amplifying customer risk.
Technology co-development
Next-gen packaging like fine-pitch and hybrid processes often requires co-development with upstream component vendors, and Kulicke & Soffa reported fiscal 2024 revenue of about $1.07 billion, reflecting heavy exposure to advanced-packaging ramps. Shared roadmaps can lock in preferred suppliers and embed their IP, accelerating innovation but increasing supplier dependence. Bargaining power tilts toward differentiated suppliers during node transitions, where unique process IP and limited capacity create leverage.
Logistics and geopolitical exposure
Global export controls, tariffs and regionalization in 2024 have tightened access to high-spec components, raising supplier bargaining power as lead-time volatility—reported up roughly 30% versus 2019 baselines—amplifies leverage in tight markets. K&S must expand diversified manufacturing footprints and strengthen compliance to mitigate disruptions, while localization pressures favor entrenched regional suppliers with faster delivery and regulatory alignment.
- Higher lead times ~+30% vs 2019
- Concentration of advanced components in APAC increases supplier power
- Compliance and footprint diversification = strategic priority for K&S
- Localization benefits incumbent regional suppliers
Switching costs and qualification
Requalifying critical parts risks delays, performance drift, and customer requalification, often requiring 6–12 months in semiconductor assembly, which inflates effective switching costs and gives incumbents pricing latitude; framework agreements and design-for-dual-sourcing mitigate this, but time-to-qualify remains a supplier bargaining chip.
- 6–12 months typical qualification window
- Initial yield drops can be 5–10%
- Frameworks reduce but do not eliminate risk
Precision suppliers gain leverage as qualification takes 6–12 months
Suppliers of precision motion, optics and consumables hold elevated leverage due to narrow sources, long 6–12 month qualification windows and tight tolerances, pressuring margins during upcycles; K&S reported fiscal 2024 revenue ~$1.06B. Lead times rose ~30% vs 2019, boosting supplier bargaining during node shifts and localization. Framework agreements and multi-sourcing mitigate but do not remove supplier power.
| Metric | Value |
|---|---|
| FY2024 Revenue | $1.06B |
| Lead time change vs 2019 | +30% |
| Qualification time | 6–12 months |
| Initial yield drop | 5–10% |
What is included in the product
Detailed Word Document
Tailored Porter's Five Forces analysis for Kulicke & Soffa that uncovers key drivers of competition, buyer and supplier power, and barriers to entry while identifying disruptive threats, substitutes, and strategic levers to protect market share and profitability.
Customizable Excel Spreadsheet
Clear one-sheet Porter's Five Forces for Kulicke & Soffa — instantly visualize supplier, buyer, rivalry, new entrant, and substitute pressures with editable scores and a radar chart to simplify strategic decisions and create slide-ready reporting.
Customers Bargaining Power
Customer concentration
Large IDMs, OSATs, foundries, and EMS customers concentrate buying power for Kulicke & Soffa, enabling demands for volume discounts, extended payment terms, and bespoke tool customization.
Such concentration means losing a single top account can materially impact quarterly revenue and capacity utilization for K&S.
Additionally, the referenceability of marquee customers materially influences pipeline wins, as endorsement by leading IDMs and foundries accelerates adoption among prospects.
High switching and integration costs
Equipment integration with factory MES, recipes and yield baselines creates high switching costs—advanced tool changes and MES rework can run into millions and deter swaps. Process requalification commonly requires 6–12 months and operator retraining further raises time and expense, tempering buyer leverage after installation. During new line build-outs, however, competitive bake-offs and multi-vendor bids—common when fabs cost >$5 billion—restore bargaining power.
Cyclical capex timing
Semi/electronics cycles drive batch purchasing and timing leverage; SEMI reported global equipment spending rebounded to about $94B in 2024, amplifying buyer timing power. In downturns buyers demand price concessions and service bundling, while 2024 upcycles put premium on shorter lead times and delivery priority over price. Kulicke & Soffa must flex pricing and backlog management to match these swings, given ~ $1.11B 2024 revenue scale.
Performance and SLA sensitivity
Uptime, throughput and yield drive TCO in semiconductor equipment, with buyers routinely demanding three to five nines of availability (99.9–99.99%) and tying penalties to SLA breaches; proven process capability lets Kulicke & Soffa justify premium pricing. Poor field support quickly erodes negotiating power, while high service quality is often the decisive lever in renewals and add-on sales.
- Uptime expectation: 99.9–99.99%
- Process capability: supports premium pricing
- Field support: major determinant of negotiation strength
- Service quality: key for renewals/add-ons
Customization and roadmap influence
Strategic accounts shape Kulicke & Soffa product features and roadmaps, extracting tailored solutions and driving product direction; in 2024 this co-development emphasis strengthened OEM lock-in. Such customization often requires NRE concessions and scope-flexible pricing. Joint development deals trade margin for footprint expansion, while early engagement secures spec wins and long-term pull-through.
- Strategic accounts: roadmap influence
- NRE: concession risk
- JVs: margin for footprint
- Early engagement: spec wins
Buyers can dent $1.11B revenue; uptime and service command premiums
Buyers (large IDMs, OSATs, foundries, EMS) concentrate purchasing power, demanding discounts, extended terms and customization; losing one top account can dent K&S's ~$1.11B 2024 revenue. High switching costs (6–12 month requalification, MES integration) limit post-install leverage, but new fab multi-vendor bids and 2024 $94B equipment spend restore buyer timing power. Uptime (99.9–99.99%) and service quality drive negotiation outcomes and premium pricing.
| Metric | 2024 Value |
|---|---|
| K&S Revenue | $1.11B |
| Global Equipment Spend (SEMI) | $94B |
| Uptime Expectation | 99.9–99.99% |
| Requalification Time | 6–12 months |
Same Document Delivered
Kulicke & Soffa Porter's Five Forces Analysis
This preview shows the exact Kulicke & Soffa Porter’s Five Forces analysis you’ll receive immediately after purchase—no surprises or placeholders. The file is the full, professionally formatted document, ready for download and use the moment you buy, covering competitive rivalry, supplier and buyer power, and threats of entry and substitutes.
Description
Don't Miss the Bigger Picture
Kulicke & Soffa faces intense supplier and buyer dynamics, evolving substitute threats from advanced packaging technologies, and moderate entry barriers driven by capital and IP. This snapshot highlights competitive rivalry, pricing pressure, and strategic levers management can deploy to protect margins. This brief snapshot only scratches the surface. Unlock the full Porter's Five Forces Analysis to explore Kulicke & Soffa’s competitive dynamics, market pressures, and strategic advantages in detail.
Suppliers Bargaining Power
Specialized components concentration
Precision motion systems, lasers, high-speed vision and vacuum parts come from a narrow vendor pool, giving key suppliers elevated leverage over K&S. Lengthy qualification cycles and tight tolerances increase switching friction, so K&S uses multi-sourcing where feasible and holds inventory buffers to reduce disruption. Single-sourced critical items still compress lead times and raise pricing power during upcycles, impacting margins and delivery.
Materials and consumables dependency
Expendables such as capillaries, bonding tools and specialty alloys are niche, quality-critical inputs that create supplier stickiness; Kulicke & Soffa reported fiscal 2024 revenue of about $1.06 billion, underscoring reliance on consistent tool performance. Supplier know-how and proprietary formulations limit switching, so long-term agreements are used to stabilize cost and supply. Any disruption can ripple into tool uptime and wafer yields, amplifying customer risk.
Technology co-development
Next-gen packaging like fine-pitch and hybrid processes often requires co-development with upstream component vendors, and Kulicke & Soffa reported fiscal 2024 revenue of about $1.07 billion, reflecting heavy exposure to advanced-packaging ramps. Shared roadmaps can lock in preferred suppliers and embed their IP, accelerating innovation but increasing supplier dependence. Bargaining power tilts toward differentiated suppliers during node transitions, where unique process IP and limited capacity create leverage.
Logistics and geopolitical exposure
Global export controls, tariffs and regionalization in 2024 have tightened access to high-spec components, raising supplier bargaining power as lead-time volatility—reported up roughly 30% versus 2019 baselines—amplifies leverage in tight markets. K&S must expand diversified manufacturing footprints and strengthen compliance to mitigate disruptions, while localization pressures favor entrenched regional suppliers with faster delivery and regulatory alignment.
- Higher lead times ~+30% vs 2019
- Concentration of advanced components in APAC increases supplier power
- Compliance and footprint diversification = strategic priority for K&S
- Localization benefits incumbent regional suppliers
Switching costs and qualification
Requalifying critical parts risks delays, performance drift, and customer requalification, often requiring 6–12 months in semiconductor assembly, which inflates effective switching costs and gives incumbents pricing latitude; framework agreements and design-for-dual-sourcing mitigate this, but time-to-qualify remains a supplier bargaining chip.
- 6–12 months typical qualification window
- Initial yield drops can be 5–10%
- Frameworks reduce but do not eliminate risk
Precision suppliers gain leverage as qualification takes 6–12 months
Suppliers of precision motion, optics and consumables hold elevated leverage due to narrow sources, long 6–12 month qualification windows and tight tolerances, pressuring margins during upcycles; K&S reported fiscal 2024 revenue ~$1.06B. Lead times rose ~30% vs 2019, boosting supplier bargaining during node shifts and localization. Framework agreements and multi-sourcing mitigate but do not remove supplier power.
| Metric | Value |
|---|---|
| FY2024 Revenue | $1.06B |
| Lead time change vs 2019 | +30% |
| Qualification time | 6–12 months |
| Initial yield drop | 5–10% |
What is included in the product
Detailed Word Document
Tailored Porter's Five Forces analysis for Kulicke & Soffa that uncovers key drivers of competition, buyer and supplier power, and barriers to entry while identifying disruptive threats, substitutes, and strategic levers to protect market share and profitability.
Customizable Excel Spreadsheet
Clear one-sheet Porter's Five Forces for Kulicke & Soffa — instantly visualize supplier, buyer, rivalry, new entrant, and substitute pressures with editable scores and a radar chart to simplify strategic decisions and create slide-ready reporting.
Customers Bargaining Power
Customer concentration
Large IDMs, OSATs, foundries, and EMS customers concentrate buying power for Kulicke & Soffa, enabling demands for volume discounts, extended payment terms, and bespoke tool customization.
Such concentration means losing a single top account can materially impact quarterly revenue and capacity utilization for K&S.
Additionally, the referenceability of marquee customers materially influences pipeline wins, as endorsement by leading IDMs and foundries accelerates adoption among prospects.
High switching and integration costs
Equipment integration with factory MES, recipes and yield baselines creates high switching costs—advanced tool changes and MES rework can run into millions and deter swaps. Process requalification commonly requires 6–12 months and operator retraining further raises time and expense, tempering buyer leverage after installation. During new line build-outs, however, competitive bake-offs and multi-vendor bids—common when fabs cost >$5 billion—restore bargaining power.
Cyclical capex timing
Semi/electronics cycles drive batch purchasing and timing leverage; SEMI reported global equipment spending rebounded to about $94B in 2024, amplifying buyer timing power. In downturns buyers demand price concessions and service bundling, while 2024 upcycles put premium on shorter lead times and delivery priority over price. Kulicke & Soffa must flex pricing and backlog management to match these swings, given ~ $1.11B 2024 revenue scale.
Performance and SLA sensitivity
Uptime, throughput and yield drive TCO in semiconductor equipment, with buyers routinely demanding three to five nines of availability (99.9–99.99%) and tying penalties to SLA breaches; proven process capability lets Kulicke & Soffa justify premium pricing. Poor field support quickly erodes negotiating power, while high service quality is often the decisive lever in renewals and add-on sales.
- Uptime expectation: 99.9–99.99%
- Process capability: supports premium pricing
- Field support: major determinant of negotiation strength
- Service quality: key for renewals/add-ons
Customization and roadmap influence
Strategic accounts shape Kulicke & Soffa product features and roadmaps, extracting tailored solutions and driving product direction; in 2024 this co-development emphasis strengthened OEM lock-in. Such customization often requires NRE concessions and scope-flexible pricing. Joint development deals trade margin for footprint expansion, while early engagement secures spec wins and long-term pull-through.
- Strategic accounts: roadmap influence
- NRE: concession risk
- JVs: margin for footprint
- Early engagement: spec wins
Buyers can dent $1.11B revenue; uptime and service command premiums
Buyers (large IDMs, OSATs, foundries, EMS) concentrate purchasing power, demanding discounts, extended terms and customization; losing one top account can dent K&S's ~$1.11B 2024 revenue. High switching costs (6–12 month requalification, MES integration) limit post-install leverage, but new fab multi-vendor bids and 2024 $94B equipment spend restore buyer timing power. Uptime (99.9–99.99%) and service quality drive negotiation outcomes and premium pricing.
| Metric | 2024 Value |
|---|---|
| K&S Revenue | $1.11B |
| Global Equipment Spend (SEMI) | $94B |
| Uptime Expectation | 99.9–99.99% |
| Requalification Time | 6–12 months |
Same Document Delivered
Kulicke & Soffa Porter's Five Forces Analysis
This preview shows the exact Kulicke & Soffa Porter’s Five Forces analysis you’ll receive immediately after purchase—no surprises or placeholders. The file is the full, professionally formatted document, ready for download and use the moment you buy, covering competitive rivalry, supplier and buyer power, and threats of entry and substitutes.











