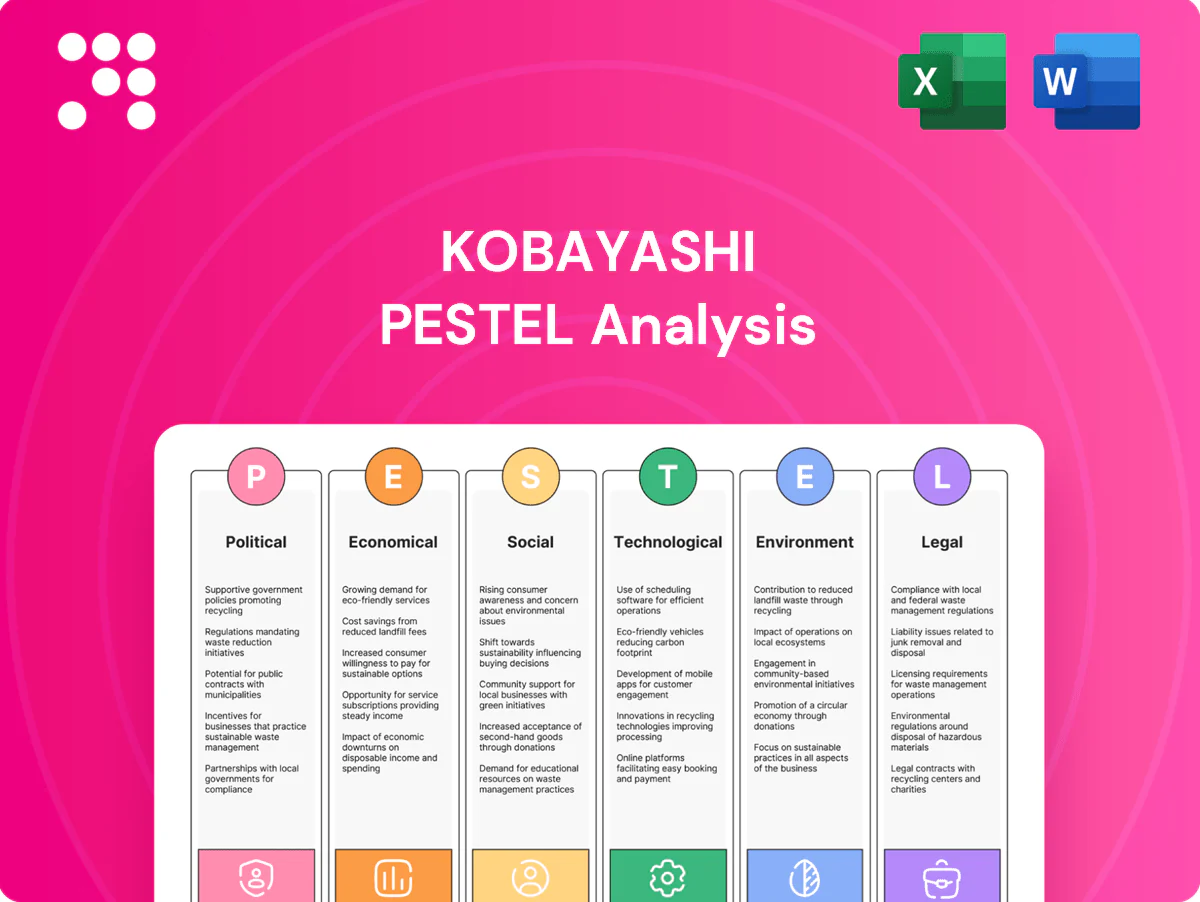
Kobayashi PESTLE Analysis

Plan Smarter. Present Sharper. Compete Stronger.
Gain competitive clarity with our PESTLE Analysis of Kobayashi, revealing political, economic, social, technological, legal and environmental forces shaping strategy. Actionable insights identify risks and growth levers across markets. Ready-made and editable for analysts and planners. Purchase the full report to access the complete, data-driven breakdown instantly.
Political factors

Healthcare policy shifts (Japan/EU/US)
Changes in MHLW/PMDA, FDA, and EMA policies can alter approval timelines and post-market obligations for OTC and medical devices. FDA PDUFA standard review target is 10 months (priority 6 months), FDA 510(k) goal ~90 days, EMA centralized assessment ~210 active days, PMDA commonly targets ~12 months with Sakigake/expedited paths faster. Pricing and reimbursement reforms may shift demand for quasi-drugs and self-care while preventive-health emphasis supports OTC categories. Coordination across jurisdictions raises compliance complexity for global launches.
Post-recall government scrutiny
Following high-profile supplement recalls in Japan, government inspections intensified (inspections reported up about 25% in 2024) and transparency/traceability mandates were strengthened. Enhanced reporting and traceability requirements raise operating costs (estimated 2–4% of revenue for manufacturers) but can rebuild consumer trust. Political pressure is driving stricter labeling and contamination controls, and short-term disruption can yield long-term standards advantages for compliant firms.

Geopolitical supply-chain risks
Trade tensions and export controls have tightened access to APIs, excipients and packaging, with China/India accounting for roughly 60–70% of some API supply lines. Diversifying away from single-country dependence cuts political shock exposure. Sanctions and customs can add 2–8 weeks to lead times, increasing inventory needs. Government onshoring incentives worth several billion USD across US/EU/Japan are shifting procurement economics.

Public health priorities
Government campaigns on hygiene, infection control and eldercare are expanding demand for masks, disinfectants and home-care devices; the global PPE market was estimated at about 61 billion USD in 2023, supporting sustained category growth. Pandemic preparedness stockpiles and guidelines create cyclical procurement spikes for masks, disinfectants and thermometers. Political focus on antimicrobial resistance, linked to 1.27 million deaths in 2019 per WHO, tightens allowable product claims and ingredient choices; formal partnerships with public agencies can ease procurement and market access.
- Campaigns boost hygiene/eldercare categories
- Stockpiles drive procurement cycles for PPE/thermometers
- AMR pressure (1.27M deaths, 2019 WHO) restricts claims/ingredients
- Agency partnerships improve market access
Industrial policy and subsidies
Japan’s industrial policy offers R&D tax credits (up to 25%) and targeted grants that lower capex for pharma innovation, digital health and manufacturing modernization; FY2024 public support for digital health rose ~15% year-on-year. Eligibility commonly requires localization and regulatory compliance, and many manufacturing subsidies favor supply-chain localization thresholds. Policy volatility means Kobayashi must keep agile investment timelines and contingency buffers.
- R&D tax credit: up to 25%
- Digital health funding: +15% YoY in FY2024
- Localization/compliance required
- Plan for policy volatility
Inspections +25% and API exposure 60–70% raise approval costs
Regulatory shifts (FDA PDUFA 10/6m, 510(k) ~90d; EMA ~210d; PMDA ~12m) and stricter inspections (up ~25% in 2024) raise approval and compliance costs. Supply risks from China/India APIs (60–70% exposure) and trade controls lengthen lead times. Policy support (R&D tax credit up to 25%, digital-health funding +15% YoY) and PPE market $61B (2023) shape demand and investment.
| Factor | Key metric | Impact |
|---|---|---|
| Approval timelines | PDUFA 10/6m; 510(k) ~90d; EMA 210d; PMDA ~12m | Longer time-to-market |
| Inspections | +25% (2024) | Higher compliance costs |
| Supply | APIs 60–70% from CN/IN | Lead-time risk |
| Incentives | R&D tax cred ≤25%; digital +15% YoY | Lowers capex |
| Demand | PPE $61B (2023) | Stable growth |
What is included in the product
 Detailed Word Document
Explores how external macro-environmental factors uniquely affect the Kobayashi across six dimensions—Political, Economic, Social, Technological, Environmental, and Legal—combining data-driven trends, region- and industry-specific examples, and forward-looking insights to help executives, consultants, and investors identify threats, opportunities, and strategic actions.

 Customizable Excel Spreadsheet
A concise, visually segmented Kobayashi PESTLE summary that’s editable and shareable—enabling quick alignment across teams, easy insertion into presentations, and clear language for all stakeholders to streamline meetings, planning sessions, and consultant reports.
Economic factors

Yen volatility and FX exposure
Yen volatility — about a 15% depreciation vs USD since 2021, with USD/JPY near 150 in 2024 — raises import costs for raw materials and squeezes margins on overseas sales. Hedging (forwards/options) stabilizes earnings but typically adds visible financing costs and rolled-forward premiums. Persistent yen weakness improves export competitiveness yet fuels input inflation; pricing discipline and SKU mix optimization become critical to protect margins.
Consumer spending cycles
OTC and hygiene show partial defensiveness but premium segments remain cyclical, with premium volumes falling 5–10% in downturns. Japan CPI rose about 3.2% in 2024 while Shunto wage gains averaged ~2.6%, shaping trade-down behavior across key export markets. Promotional intensity increases in recessions, squeezing margins by roughly 200 basis points. Elasticity-informed pricing (price elasticity ~-0.8) helps protect share and profitability.

Aging demographics tailwinds
Japan’s 65+ population reached about 29% in 2024, expanding demand for self-care, pain relief, gastrointestinal and home-use devices. Chronic condition management and multimorbidity drive recurring purchases and subscription models. High healthcare spending (~11.7% of GDP) and fiscal strain favor cost-effective OTC adoption; Japan’s OTC market is roughly ¥1.1 trillion (2023–24). Product design must prioritize accessibility and adherence for older users.

Recall and litigation cost overhang
Large-scale recalls drive one-off charges that for major manufacturers often exceed $100m, push up insurance premiums and force sustained quality CAPEX; retailers commonly demand temporary discounts or return support, as seen in recent FMCG and auto incidents in 2023–24. Working capital tightens from rework and slower sell-through, and restored growth hinges on brand recovery pace.
- One-off charges: >100m for major recalls
- Higher insurance/ongoing CAPEX
- Retailer concessions: discounts/returns
- Working capital: inventory rework, slower sell-through
E-commerce and channel mix
Online marketplaces and DTC expand reach and behavioral data but intensify price compression via transparency; global e-commerce penetration hit about 21.8% in 2024 while marketplaces drove much of the volume. Cross-border e-commerce lowers fixed-cost barriers and lifted international online sales growth, and last-mile logistics—up to 50%+ of delivery costs—require contribution-margin tracking; omnichannel execution raises resilience and average spend by roughly 10–25%.
- Market share: e‑commerce 21.8% (2024)
- Last‑mile cost: up to 50%+ of delivery expense
- Omnichannel lift: ~10–25% higher spend
Inspections +25% and API exposure 60–70% raise approval costs
Yen ~15% weaker vs USD since 2021 (USD/JPY ~150 in 2024), raising import costs and margin pressure; hedging reduces volatility but adds finance costs. Japan CPI ~3.2% (2024) with Shunto wages ~2.6% drives trade-downs and higher promotional intensity (~200bp margin hit). Aging population (65+ ~29% in 2024) and ¥1.1T OTC market shift demand to self-care and recurring models.
| Metric | Value |
|---|---|
| USD/JPY (2024) | ~150 |
| Japan CPI (2024) | 3.2% |
| Shunto wages (avg 2024) | ~2.6% |
| 65+ population (2024) | ~29% |
| OTC market (2023–24) | ¥1.1T |
| E‑commerce penetration (2024) | 21.8% |
Preview the Actual Deliverable
Kobayashi PESTLE Analysis
The Kobayashi PESTLE Analysis preview shown here is the exact document you’ll receive after purchase—fully formatted, professionally structured, and ready to use. It contains the complete political, economic, social, technological, legal and environmental assessment with clear headings, data and actionable insights. No placeholders or teasers—what you see is the final file you’ll download immediately after payment.

Plan Smarter. Present Sharper. Compete Stronger.
Gain competitive clarity with our PESTLE Analysis of Kobayashi, revealing political, economic, social, technological, legal and environmental forces shaping strategy. Actionable insights identify risks and growth levers across markets. Ready-made and editable for analysts and planners. Purchase the full report to access the complete, data-driven breakdown instantly.
Political factors
Healthcare policy shifts (Japan/EU/US)
Changes in MHLW/PMDA, FDA, and EMA policies can alter approval timelines and post-market obligations for OTC and medical devices. FDA PDUFA standard review target is 10 months (priority 6 months), FDA 510(k) goal ~90 days, EMA centralized assessment ~210 active days, PMDA commonly targets ~12 months with Sakigake/expedited paths faster. Pricing and reimbursement reforms may shift demand for quasi-drugs and self-care while preventive-health emphasis supports OTC categories. Coordination across jurisdictions raises compliance complexity for global launches.
Post-recall government scrutiny
Following high-profile supplement recalls in Japan, government inspections intensified (inspections reported up about 25% in 2024) and transparency/traceability mandates were strengthened. Enhanced reporting and traceability requirements raise operating costs (estimated 2–4% of revenue for manufacturers) but can rebuild consumer trust. Political pressure is driving stricter labeling and contamination controls, and short-term disruption can yield long-term standards advantages for compliant firms.
Geopolitical supply-chain risks
Trade tensions and export controls have tightened access to APIs, excipients and packaging, with China/India accounting for roughly 60–70% of some API supply lines. Diversifying away from single-country dependence cuts political shock exposure. Sanctions and customs can add 2–8 weeks to lead times, increasing inventory needs. Government onshoring incentives worth several billion USD across US/EU/Japan are shifting procurement economics.
Public health priorities
Government campaigns on hygiene, infection control and eldercare are expanding demand for masks, disinfectants and home-care devices; the global PPE market was estimated at about 61 billion USD in 2023, supporting sustained category growth. Pandemic preparedness stockpiles and guidelines create cyclical procurement spikes for masks, disinfectants and thermometers. Political focus on antimicrobial resistance, linked to 1.27 million deaths in 2019 per WHO, tightens allowable product claims and ingredient choices; formal partnerships with public agencies can ease procurement and market access.
- Campaigns boost hygiene/eldercare categories
- Stockpiles drive procurement cycles for PPE/thermometers
- AMR pressure (1.27M deaths, 2019 WHO) restricts claims/ingredients
- Agency partnerships improve market access
Industrial policy and subsidies
Japan’s industrial policy offers R&D tax credits (up to 25%) and targeted grants that lower capex for pharma innovation, digital health and manufacturing modernization; FY2024 public support for digital health rose ~15% year-on-year. Eligibility commonly requires localization and regulatory compliance, and many manufacturing subsidies favor supply-chain localization thresholds. Policy volatility means Kobayashi must keep agile investment timelines and contingency buffers.
- R&D tax credit: up to 25%
- Digital health funding: +15% YoY in FY2024
- Localization/compliance required
- Plan for policy volatility
Inspections +25% and API exposure 60–70% raise approval costs
Regulatory shifts (FDA PDUFA 10/6m, 510(k) ~90d; EMA ~210d; PMDA ~12m) and stricter inspections (up ~25% in 2024) raise approval and compliance costs. Supply risks from China/India APIs (60–70% exposure) and trade controls lengthen lead times. Policy support (R&D tax credit up to 25%, digital-health funding +15% YoY) and PPE market $61B (2023) shape demand and investment.
| Factor | Key metric | Impact |
|---|---|---|
| Approval timelines | PDUFA 10/6m; 510(k) ~90d; EMA 210d; PMDA ~12m | Longer time-to-market |
| Inspections | +25% (2024) | Higher compliance costs |
| Supply | APIs 60–70% from CN/IN | Lead-time risk |
| Incentives | R&D tax cred ≤25%; digital +15% YoY | Lowers capex |
| Demand | PPE $61B (2023) | Stable growth |
What is included in the product
Detailed Word Document
Explores how external macro-environmental factors uniquely affect the Kobayashi across six dimensions—Political, Economic, Social, Technological, Environmental, and Legal—combining data-driven trends, region- and industry-specific examples, and forward-looking insights to help executives, consultants, and investors identify threats, opportunities, and strategic actions.
Customizable Excel Spreadsheet
A concise, visually segmented Kobayashi PESTLE summary that’s editable and shareable—enabling quick alignment across teams, easy insertion into presentations, and clear language for all stakeholders to streamline meetings, planning sessions, and consultant reports.
Economic factors
Yen volatility and FX exposure
Yen volatility — about a 15% depreciation vs USD since 2021, with USD/JPY near 150 in 2024 — raises import costs for raw materials and squeezes margins on overseas sales. Hedging (forwards/options) stabilizes earnings but typically adds visible financing costs and rolled-forward premiums. Persistent yen weakness improves export competitiveness yet fuels input inflation; pricing discipline and SKU mix optimization become critical to protect margins.
Consumer spending cycles
OTC and hygiene show partial defensiveness but premium segments remain cyclical, with premium volumes falling 5–10% in downturns. Japan CPI rose about 3.2% in 2024 while Shunto wage gains averaged ~2.6%, shaping trade-down behavior across key export markets. Promotional intensity increases in recessions, squeezing margins by roughly 200 basis points. Elasticity-informed pricing (price elasticity ~-0.8) helps protect share and profitability.
Aging demographics tailwinds
Japan’s 65+ population reached about 29% in 2024, expanding demand for self-care, pain relief, gastrointestinal and home-use devices. Chronic condition management and multimorbidity drive recurring purchases and subscription models. High healthcare spending (~11.7% of GDP) and fiscal strain favor cost-effective OTC adoption; Japan’s OTC market is roughly ¥1.1 trillion (2023–24). Product design must prioritize accessibility and adherence for older users.
Recall and litigation cost overhang
Large-scale recalls drive one-off charges that for major manufacturers often exceed $100m, push up insurance premiums and force sustained quality CAPEX; retailers commonly demand temporary discounts or return support, as seen in recent FMCG and auto incidents in 2023–24. Working capital tightens from rework and slower sell-through, and restored growth hinges on brand recovery pace.
- One-off charges: >100m for major recalls
- Higher insurance/ongoing CAPEX
- Retailer concessions: discounts/returns
- Working capital: inventory rework, slower sell-through
E-commerce and channel mix
Online marketplaces and DTC expand reach and behavioral data but intensify price compression via transparency; global e-commerce penetration hit about 21.8% in 2024 while marketplaces drove much of the volume. Cross-border e-commerce lowers fixed-cost barriers and lifted international online sales growth, and last-mile logistics—up to 50%+ of delivery costs—require contribution-margin tracking; omnichannel execution raises resilience and average spend by roughly 10–25%.
- Market share: e‑commerce 21.8% (2024)
- Last‑mile cost: up to 50%+ of delivery expense
- Omnichannel lift: ~10–25% higher spend
Inspections +25% and API exposure 60–70% raise approval costs
Yen ~15% weaker vs USD since 2021 (USD/JPY ~150 in 2024), raising import costs and margin pressure; hedging reduces volatility but adds finance costs. Japan CPI ~3.2% (2024) with Shunto wages ~2.6% drives trade-downs and higher promotional intensity (~200bp margin hit). Aging population (65+ ~29% in 2024) and ¥1.1T OTC market shift demand to self-care and recurring models.
| Metric | Value |
|---|---|
| USD/JPY (2024) | ~150 |
| Japan CPI (2024) | 3.2% |
| Shunto wages (avg 2024) | ~2.6% |
| 65+ population (2024) | ~29% |
| OTC market (2023–24) | ¥1.1T |
| E‑commerce penetration (2024) | 21.8% |
Preview the Actual Deliverable
Kobayashi PESTLE Analysis
The Kobayashi PESTLE Analysis preview shown here is the exact document you’ll receive after purchase—fully formatted, professionally structured, and ready to use. It contains the complete political, economic, social, technological, legal and environmental assessment with clear headings, data and actionable insights. No placeholders or teasers—what you see is the final file you’ll download immediately after payment.
Original: $10.00
-65%$10.00
$3.50Description
Plan Smarter. Present Sharper. Compete Stronger.
Gain competitive clarity with our PESTLE Analysis of Kobayashi, revealing political, economic, social, technological, legal and environmental forces shaping strategy. Actionable insights identify risks and growth levers across markets. Ready-made and editable for analysts and planners. Purchase the full report to access the complete, data-driven breakdown instantly.
Political factors
Healthcare policy shifts (Japan/EU/US)
Changes in MHLW/PMDA, FDA, and EMA policies can alter approval timelines and post-market obligations for OTC and medical devices. FDA PDUFA standard review target is 10 months (priority 6 months), FDA 510(k) goal ~90 days, EMA centralized assessment ~210 active days, PMDA commonly targets ~12 months with Sakigake/expedited paths faster. Pricing and reimbursement reforms may shift demand for quasi-drugs and self-care while preventive-health emphasis supports OTC categories. Coordination across jurisdictions raises compliance complexity for global launches.
Post-recall government scrutiny
Following high-profile supplement recalls in Japan, government inspections intensified (inspections reported up about 25% in 2024) and transparency/traceability mandates were strengthened. Enhanced reporting and traceability requirements raise operating costs (estimated 2–4% of revenue for manufacturers) but can rebuild consumer trust. Political pressure is driving stricter labeling and contamination controls, and short-term disruption can yield long-term standards advantages for compliant firms.
Geopolitical supply-chain risks
Trade tensions and export controls have tightened access to APIs, excipients and packaging, with China/India accounting for roughly 60–70% of some API supply lines. Diversifying away from single-country dependence cuts political shock exposure. Sanctions and customs can add 2–8 weeks to lead times, increasing inventory needs. Government onshoring incentives worth several billion USD across US/EU/Japan are shifting procurement economics.
Public health priorities
Government campaigns on hygiene, infection control and eldercare are expanding demand for masks, disinfectants and home-care devices; the global PPE market was estimated at about 61 billion USD in 2023, supporting sustained category growth. Pandemic preparedness stockpiles and guidelines create cyclical procurement spikes for masks, disinfectants and thermometers. Political focus on antimicrobial resistance, linked to 1.27 million deaths in 2019 per WHO, tightens allowable product claims and ingredient choices; formal partnerships with public agencies can ease procurement and market access.
- Campaigns boost hygiene/eldercare categories
- Stockpiles drive procurement cycles for PPE/thermometers
- AMR pressure (1.27M deaths, 2019 WHO) restricts claims/ingredients
- Agency partnerships improve market access
Industrial policy and subsidies
Japan’s industrial policy offers R&D tax credits (up to 25%) and targeted grants that lower capex for pharma innovation, digital health and manufacturing modernization; FY2024 public support for digital health rose ~15% year-on-year. Eligibility commonly requires localization and regulatory compliance, and many manufacturing subsidies favor supply-chain localization thresholds. Policy volatility means Kobayashi must keep agile investment timelines and contingency buffers.
- R&D tax credit: up to 25%
- Digital health funding: +15% YoY in FY2024
- Localization/compliance required
- Plan for policy volatility
Inspections +25% and API exposure 60–70% raise approval costs
Regulatory shifts (FDA PDUFA 10/6m, 510(k) ~90d; EMA ~210d; PMDA ~12m) and stricter inspections (up ~25% in 2024) raise approval and compliance costs. Supply risks from China/India APIs (60–70% exposure) and trade controls lengthen lead times. Policy support (R&D tax credit up to 25%, digital-health funding +15% YoY) and PPE market $61B (2023) shape demand and investment.
| Factor | Key metric | Impact |
|---|---|---|
| Approval timelines | PDUFA 10/6m; 510(k) ~90d; EMA 210d; PMDA ~12m | Longer time-to-market |
| Inspections | +25% (2024) | Higher compliance costs |
| Supply | APIs 60–70% from CN/IN | Lead-time risk |
| Incentives | R&D tax cred ≤25%; digital +15% YoY | Lowers capex |
| Demand | PPE $61B (2023) | Stable growth |
What is included in the product
Detailed Word Document
Explores how external macro-environmental factors uniquely affect the Kobayashi across six dimensions—Political, Economic, Social, Technological, Environmental, and Legal—combining data-driven trends, region- and industry-specific examples, and forward-looking insights to help executives, consultants, and investors identify threats, opportunities, and strategic actions.
Customizable Excel Spreadsheet
A concise, visually segmented Kobayashi PESTLE summary that’s editable and shareable—enabling quick alignment across teams, easy insertion into presentations, and clear language for all stakeholders to streamline meetings, planning sessions, and consultant reports.
Economic factors
Yen volatility and FX exposure
Yen volatility — about a 15% depreciation vs USD since 2021, with USD/JPY near 150 in 2024 — raises import costs for raw materials and squeezes margins on overseas sales. Hedging (forwards/options) stabilizes earnings but typically adds visible financing costs and rolled-forward premiums. Persistent yen weakness improves export competitiveness yet fuels input inflation; pricing discipline and SKU mix optimization become critical to protect margins.
Consumer spending cycles
OTC and hygiene show partial defensiveness but premium segments remain cyclical, with premium volumes falling 5–10% in downturns. Japan CPI rose about 3.2% in 2024 while Shunto wage gains averaged ~2.6%, shaping trade-down behavior across key export markets. Promotional intensity increases in recessions, squeezing margins by roughly 200 basis points. Elasticity-informed pricing (price elasticity ~-0.8) helps protect share and profitability.
Aging demographics tailwinds
Japan’s 65+ population reached about 29% in 2024, expanding demand for self-care, pain relief, gastrointestinal and home-use devices. Chronic condition management and multimorbidity drive recurring purchases and subscription models. High healthcare spending (~11.7% of GDP) and fiscal strain favor cost-effective OTC adoption; Japan’s OTC market is roughly ¥1.1 trillion (2023–24). Product design must prioritize accessibility and adherence for older users.
Recall and litigation cost overhang
Large-scale recalls drive one-off charges that for major manufacturers often exceed $100m, push up insurance premiums and force sustained quality CAPEX; retailers commonly demand temporary discounts or return support, as seen in recent FMCG and auto incidents in 2023–24. Working capital tightens from rework and slower sell-through, and restored growth hinges on brand recovery pace.
- One-off charges: >100m for major recalls
- Higher insurance/ongoing CAPEX
- Retailer concessions: discounts/returns
- Working capital: inventory rework, slower sell-through
E-commerce and channel mix
Online marketplaces and DTC expand reach and behavioral data but intensify price compression via transparency; global e-commerce penetration hit about 21.8% in 2024 while marketplaces drove much of the volume. Cross-border e-commerce lowers fixed-cost barriers and lifted international online sales growth, and last-mile logistics—up to 50%+ of delivery costs—require contribution-margin tracking; omnichannel execution raises resilience and average spend by roughly 10–25%.
- Market share: e‑commerce 21.8% (2024)
- Last‑mile cost: up to 50%+ of delivery expense
- Omnichannel lift: ~10–25% higher spend
Inspections +25% and API exposure 60–70% raise approval costs
Yen ~15% weaker vs USD since 2021 (USD/JPY ~150 in 2024), raising import costs and margin pressure; hedging reduces volatility but adds finance costs. Japan CPI ~3.2% (2024) with Shunto wages ~2.6% drives trade-downs and higher promotional intensity (~200bp margin hit). Aging population (65+ ~29% in 2024) and ¥1.1T OTC market shift demand to self-care and recurring models.
| Metric | Value |
|---|---|
| USD/JPY (2024) | ~150 |
| Japan CPI (2024) | 3.2% |
| Shunto wages (avg 2024) | ~2.6% |
| 65+ population (2024) | ~29% |
| OTC market (2023–24) | ¥1.1T |
| E‑commerce penetration (2024) | 21.8% |
Preview the Actual Deliverable
Kobayashi PESTLE Analysis
The Kobayashi PESTLE Analysis preview shown here is the exact document you’ll receive after purchase—fully formatted, professionally structured, and ready to use. It contains the complete political, economic, social, technological, legal and environmental assessment with clear headings, data and actionable insights. No placeholders or teasers—what you see is the final file you’ll download immediately after payment.











