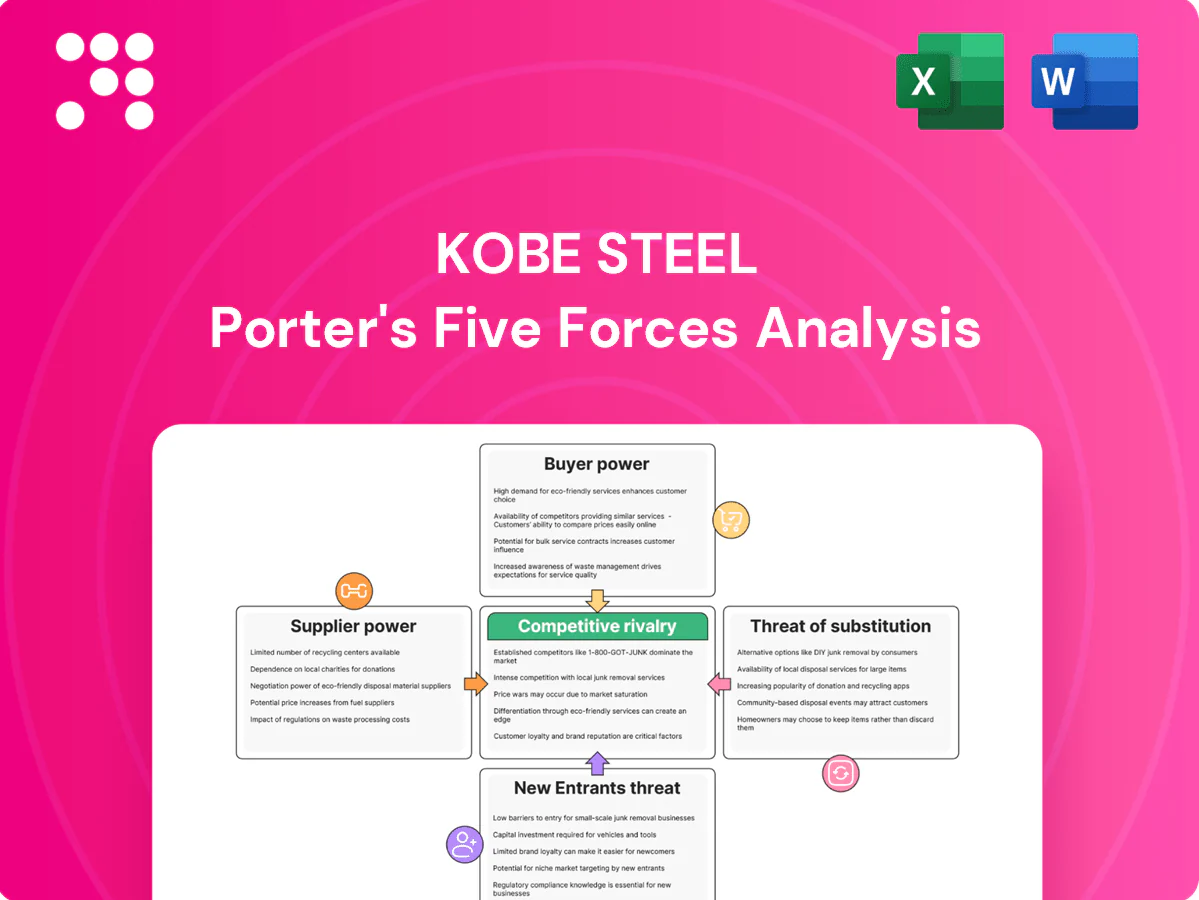
Kobe Steel Porter's Five Forces Analysis

Go Beyond the Preview—Access the Full Strategic Report
Kobe Steel faces moderate rivalry with cyclical demand and differentiated product lines, while supplier and buyer power vary across steel, machinery, and aluminum segments. Regulatory and environmental pressures heighten competitive risk, and substitutes threaten niche markets. This brief snapshot only scratches the surface—unlock the full Porter's Five Forces Analysis to explore Kobe Steel’s competitive dynamics in detail.
Suppliers Bargaining Power

Raw materials concentration
Iron ore, coking coal, alumina and copper concentrates are supplied by a few global miners (top three miners account for roughly 60% of seaborne iron ore), concentrating supplier power. Index‑linked pricing and long‑term contracts temper spot volatility, but Japan imports >99% of its iron ore/coking coal, raising exposure to freight and JPY swings. Kobe Steel uses hedging and multi‑sourcing to balance supplier leverage.
Energy and logistics
High electricity and LNG costs in Japan — with JKM LNG averaging about $12/MMBtu in 2024 — give utilities and shippers negotiating leverage over Kobe Steel. Steelmaking's energy intensity amplifies cost pass-through, making fuel and power a material share of unit costs. Port congestion and elevated bulk freight rates during 2024 compressed margins. Efficiency projects and captive power reduce but do not eliminate exposure.

Specialized inputs
Alloying elements, electrodes and advanced consumables for Kobe Steel come from niche suppliers with limited substitutes, giving suppliers heightened bargaining power. Qualification and approval often exceed 3 months, so dual-sourcing is possible but costly and slow, raising effective switching costs. Kobe Steel maintains strategic inventories typically covering 3–6 months to mitigate disruption risk.

Machinery components
Machinery components—hydraulics, engines, controls and semiconductors—depend on tier-1 suppliers, and 2024 industrial reports show sustained tightness in industrial-grade chips with lead times often exceeding 20 weeks, boosting vendor leverage. Design lock-in raises mid-cycle switching costs; long-term co-development deals mitigate risk by securing capacity and price stability.
Quality and compliance
Automotive-grade inputs require strict specs and traceability under IATF 16949 and ISO 9001; only certified suppliers routinely qualify for OEM contracts. Certification and audit capability narrow vendor pools and raise dependence on compliant suppliers. High-profile failures (Takata recalls cost over $25 billion) push buyers to use audits and collaborative QA to rebalance bargaining power.
- Traceability: IATF 16949 required
- Dependence: fewer certified vendors
- Risk: recalls can exceed $25B
- Mitigation: supplier audits, joint QA
Top miners hold ~60% seaborne ore; JKM $12 and >20-week lead times raise input leverage
Supplier power is high: top three miners account for ~60% of seaborne iron ore (2024), forcing Kobe Steel into long‑term/ index contracts and multi‑sourcing. Energy costs (JKM ~ $12/MMBtu in 2024) and freight/JPY exposure raise input leverage despite captive power. Niche alloys, electrodes and chips (lead times >20 weeks) create elevated switching costs; inventories of 3–6 months partly mitigate risk.
| Metric | 2024 value |
|---|---|
| Iron ore top3 share | ~60% |
| JKM LNG | $12/MMBtu |
| Chip lead times | >20 weeks |
| Inventory cover | 3–6 months |
What is included in the product
 Detailed Word Document
Tailored Porter's Five Forces for Kobe Steel, uncovering key competitive drivers, supplier and buyer power, substitutes, and entry barriers that shape pricing and profitability; highlights emerging disruptions and strategic risks to market share.

 Customizable Excel Spreadsheet
A concise Porter's Five Forces one-sheet for Kobe Steel that visualizes competitive pressures, lets you adjust force intensity for market changes, and exports clean slides—ideal for quick strategic decisions and board-level communication.
Customers Bargaining Power

Buyer concentration
Auto OEMs, shipbuilders and construction machinery makers are highly concentrated buyers—top 10 OEMs account for roughly two-thirds of global vehicle output, China/South Korea/Japan take over 90% of large ship orders, and the five largest construction-equipment makers hold about 60% of global market share; their volume and scheduling leverage forces down prices and tightens payment terms, amplified by vendor-reduction programs, while Kobe Steel offsets pressure via multi-product bundles and technical support.
Price sensitivity
Price sensitivity is high for commoditized steel and nonferrous base grades, with buyers benchmarking offers against regional indices and import quotes, pressuring Kobe Steel on headline margins. Cost-pass-through clauses exist in contracts but face execution lag and customer resistance, compressing near-term cash margins. Premiums are achieved through grade differentiation and value-added service offerings rather than base-price competition.

Switching costs
For commodity grades switching is relatively easy via qualified vendor lists, keeping buyer bargaining power high and price sensitivity elevated. For high-strength, automotive and precision alloys requalification often requires 6–12 months and can add significant cost, materially raising switching costs. JIT requirements and tooling compatibility create operational friction and inventory risk for buyers. Joint R&D partnerships further increase buyer stickiness and long-term dependency.

Demand cyclicality
Service expectations
Kobe Steel reported consolidated revenue of about JPY 1.04 trillion for FY2023; buyers now insist on stable quality, on-time delivery and ongoing technical assistance, pushing suppliers to provide customized slitting, heat treatment and welding support as differentiators. Failure penalties and warranty risks increase buyer leverage, while bundled integrated solutions can command meaningful premiums.
- Stable quality, delivery, technical support
- Customized slitting, heat treatment, welding
- Failure penalties and warranty exposure
- Integrated solutions justify pricing premiums
Concentrated OEM/ship buying power squeezes steel margins; specialty-alloys raise switching costs
Auto OEMs, shipbuilders and construction-equipment giants concentrate buying power (top-10 OEMs ~66% vehicle output; China/SK/Japan >90% large ship orders), pressuring Kobe Steel on price, terms and payment; commodity grades face easy switching while specialty alloys require 6–12 month requalification, raising switching costs. Downturns amplify buyer leverage; Kobe offsets via bundles, technical support and flexible contracts.
| Metric | Value |
|---|---|
| FY2023 Rev | JPY 1.04T |
| Top-10 OEM share | ~66% |
| Ship orders (CN/KR/JP) | >90% |
| Requalify time | 6–12 months |
Preview the Actual Deliverable
Kobe Steel Porter's Five Forces Analysis
This preview shows the exact document you'll receive immediately after purchase—no surprises, no placeholders. The Kobe Steel Porter's Five Forces Analysis assesses competitive rivalry, supplier and buyer power, threat of new entrants and substitutes, and regulatory impacts. It includes concise strategic implications and action-oriented recommendations, fully formatted and ready to download.

Go Beyond the Preview—Access the Full Strategic Report
Kobe Steel faces moderate rivalry with cyclical demand and differentiated product lines, while supplier and buyer power vary across steel, machinery, and aluminum segments. Regulatory and environmental pressures heighten competitive risk, and substitutes threaten niche markets. This brief snapshot only scratches the surface—unlock the full Porter's Five Forces Analysis to explore Kobe Steel’s competitive dynamics in detail.
Suppliers Bargaining Power
Raw materials concentration
Iron ore, coking coal, alumina and copper concentrates are supplied by a few global miners (top three miners account for roughly 60% of seaborne iron ore), concentrating supplier power. Index‑linked pricing and long‑term contracts temper spot volatility, but Japan imports >99% of its iron ore/coking coal, raising exposure to freight and JPY swings. Kobe Steel uses hedging and multi‑sourcing to balance supplier leverage.
Energy and logistics
High electricity and LNG costs in Japan — with JKM LNG averaging about $12/MMBtu in 2024 — give utilities and shippers negotiating leverage over Kobe Steel. Steelmaking's energy intensity amplifies cost pass-through, making fuel and power a material share of unit costs. Port congestion and elevated bulk freight rates during 2024 compressed margins. Efficiency projects and captive power reduce but do not eliminate exposure.
Specialized inputs
Alloying elements, electrodes and advanced consumables for Kobe Steel come from niche suppliers with limited substitutes, giving suppliers heightened bargaining power. Qualification and approval often exceed 3 months, so dual-sourcing is possible but costly and slow, raising effective switching costs. Kobe Steel maintains strategic inventories typically covering 3–6 months to mitigate disruption risk.
Machinery components
Machinery components—hydraulics, engines, controls and semiconductors—depend on tier-1 suppliers, and 2024 industrial reports show sustained tightness in industrial-grade chips with lead times often exceeding 20 weeks, boosting vendor leverage. Design lock-in raises mid-cycle switching costs; long-term co-development deals mitigate risk by securing capacity and price stability.
Quality and compliance
Automotive-grade inputs require strict specs and traceability under IATF 16949 and ISO 9001; only certified suppliers routinely qualify for OEM contracts. Certification and audit capability narrow vendor pools and raise dependence on compliant suppliers. High-profile failures (Takata recalls cost over $25 billion) push buyers to use audits and collaborative QA to rebalance bargaining power.
- Traceability: IATF 16949 required
- Dependence: fewer certified vendors
- Risk: recalls can exceed $25B
- Mitigation: supplier audits, joint QA
Top miners hold ~60% seaborne ore; JKM $12 and >20-week lead times raise input leverage
Supplier power is high: top three miners account for ~60% of seaborne iron ore (2024), forcing Kobe Steel into long‑term/ index contracts and multi‑sourcing. Energy costs (JKM ~ $12/MMBtu in 2024) and freight/JPY exposure raise input leverage despite captive power. Niche alloys, electrodes and chips (lead times >20 weeks) create elevated switching costs; inventories of 3–6 months partly mitigate risk.
| Metric | 2024 value |
|---|---|
| Iron ore top3 share | ~60% |
| JKM LNG | $12/MMBtu |
| Chip lead times | >20 weeks |
| Inventory cover | 3–6 months |
What is included in the product
Detailed Word Document
Tailored Porter's Five Forces for Kobe Steel, uncovering key competitive drivers, supplier and buyer power, substitutes, and entry barriers that shape pricing and profitability; highlights emerging disruptions and strategic risks to market share.
Customizable Excel Spreadsheet
A concise Porter's Five Forces one-sheet for Kobe Steel that visualizes competitive pressures, lets you adjust force intensity for market changes, and exports clean slides—ideal for quick strategic decisions and board-level communication.
Customers Bargaining Power
Buyer concentration
Auto OEMs, shipbuilders and construction machinery makers are highly concentrated buyers—top 10 OEMs account for roughly two-thirds of global vehicle output, China/South Korea/Japan take over 90% of large ship orders, and the five largest construction-equipment makers hold about 60% of global market share; their volume and scheduling leverage forces down prices and tightens payment terms, amplified by vendor-reduction programs, while Kobe Steel offsets pressure via multi-product bundles and technical support.
Price sensitivity
Price sensitivity is high for commoditized steel and nonferrous base grades, with buyers benchmarking offers against regional indices and import quotes, pressuring Kobe Steel on headline margins. Cost-pass-through clauses exist in contracts but face execution lag and customer resistance, compressing near-term cash margins. Premiums are achieved through grade differentiation and value-added service offerings rather than base-price competition.
Switching costs
For commodity grades switching is relatively easy via qualified vendor lists, keeping buyer bargaining power high and price sensitivity elevated. For high-strength, automotive and precision alloys requalification often requires 6–12 months and can add significant cost, materially raising switching costs. JIT requirements and tooling compatibility create operational friction and inventory risk for buyers. Joint R&D partnerships further increase buyer stickiness and long-term dependency.
Demand cyclicality
Service expectations
Kobe Steel reported consolidated revenue of about JPY 1.04 trillion for FY2023; buyers now insist on stable quality, on-time delivery and ongoing technical assistance, pushing suppliers to provide customized slitting, heat treatment and welding support as differentiators. Failure penalties and warranty risks increase buyer leverage, while bundled integrated solutions can command meaningful premiums.
- Stable quality, delivery, technical support
- Customized slitting, heat treatment, welding
- Failure penalties and warranty exposure
- Integrated solutions justify pricing premiums
Concentrated OEM/ship buying power squeezes steel margins; specialty-alloys raise switching costs
Auto OEMs, shipbuilders and construction-equipment giants concentrate buying power (top-10 OEMs ~66% vehicle output; China/SK/Japan >90% large ship orders), pressuring Kobe Steel on price, terms and payment; commodity grades face easy switching while specialty alloys require 6–12 month requalification, raising switching costs. Downturns amplify buyer leverage; Kobe offsets via bundles, technical support and flexible contracts.
| Metric | Value |
|---|---|
| FY2023 Rev | JPY 1.04T |
| Top-10 OEM share | ~66% |
| Ship orders (CN/KR/JP) | >90% |
| Requalify time | 6–12 months |
Preview the Actual Deliverable
Kobe Steel Porter's Five Forces Analysis
This preview shows the exact document you'll receive immediately after purchase—no surprises, no placeholders. The Kobe Steel Porter's Five Forces Analysis assesses competitive rivalry, supplier and buyer power, threat of new entrants and substitutes, and regulatory impacts. It includes concise strategic implications and action-oriented recommendations, fully formatted and ready to download.
Original: $10.00
-65%$10.00
$3.50Description
Go Beyond the Preview—Access the Full Strategic Report
Kobe Steel faces moderate rivalry with cyclical demand and differentiated product lines, while supplier and buyer power vary across steel, machinery, and aluminum segments. Regulatory and environmental pressures heighten competitive risk, and substitutes threaten niche markets. This brief snapshot only scratches the surface—unlock the full Porter's Five Forces Analysis to explore Kobe Steel’s competitive dynamics in detail.
Suppliers Bargaining Power
Raw materials concentration
Iron ore, coking coal, alumina and copper concentrates are supplied by a few global miners (top three miners account for roughly 60% of seaborne iron ore), concentrating supplier power. Index‑linked pricing and long‑term contracts temper spot volatility, but Japan imports >99% of its iron ore/coking coal, raising exposure to freight and JPY swings. Kobe Steel uses hedging and multi‑sourcing to balance supplier leverage.
Energy and logistics
High electricity and LNG costs in Japan — with JKM LNG averaging about $12/MMBtu in 2024 — give utilities and shippers negotiating leverage over Kobe Steel. Steelmaking's energy intensity amplifies cost pass-through, making fuel and power a material share of unit costs. Port congestion and elevated bulk freight rates during 2024 compressed margins. Efficiency projects and captive power reduce but do not eliminate exposure.
Specialized inputs
Alloying elements, electrodes and advanced consumables for Kobe Steel come from niche suppliers with limited substitutes, giving suppliers heightened bargaining power. Qualification and approval often exceed 3 months, so dual-sourcing is possible but costly and slow, raising effective switching costs. Kobe Steel maintains strategic inventories typically covering 3–6 months to mitigate disruption risk.
Machinery components
Machinery components—hydraulics, engines, controls and semiconductors—depend on tier-1 suppliers, and 2024 industrial reports show sustained tightness in industrial-grade chips with lead times often exceeding 20 weeks, boosting vendor leverage. Design lock-in raises mid-cycle switching costs; long-term co-development deals mitigate risk by securing capacity and price stability.
Quality and compliance
Automotive-grade inputs require strict specs and traceability under IATF 16949 and ISO 9001; only certified suppliers routinely qualify for OEM contracts. Certification and audit capability narrow vendor pools and raise dependence on compliant suppliers. High-profile failures (Takata recalls cost over $25 billion) push buyers to use audits and collaborative QA to rebalance bargaining power.
- Traceability: IATF 16949 required
- Dependence: fewer certified vendors
- Risk: recalls can exceed $25B
- Mitigation: supplier audits, joint QA
Top miners hold ~60% seaborne ore; JKM $12 and >20-week lead times raise input leverage
Supplier power is high: top three miners account for ~60% of seaborne iron ore (2024), forcing Kobe Steel into long‑term/ index contracts and multi‑sourcing. Energy costs (JKM ~ $12/MMBtu in 2024) and freight/JPY exposure raise input leverage despite captive power. Niche alloys, electrodes and chips (lead times >20 weeks) create elevated switching costs; inventories of 3–6 months partly mitigate risk.
| Metric | 2024 value |
|---|---|
| Iron ore top3 share | ~60% |
| JKM LNG | $12/MMBtu |
| Chip lead times | >20 weeks |
| Inventory cover | 3–6 months |
What is included in the product
Detailed Word Document
Tailored Porter's Five Forces for Kobe Steel, uncovering key competitive drivers, supplier and buyer power, substitutes, and entry barriers that shape pricing and profitability; highlights emerging disruptions and strategic risks to market share.
Customizable Excel Spreadsheet
A concise Porter's Five Forces one-sheet for Kobe Steel that visualizes competitive pressures, lets you adjust force intensity for market changes, and exports clean slides—ideal for quick strategic decisions and board-level communication.
Customers Bargaining Power
Buyer concentration
Auto OEMs, shipbuilders and construction machinery makers are highly concentrated buyers—top 10 OEMs account for roughly two-thirds of global vehicle output, China/South Korea/Japan take over 90% of large ship orders, and the five largest construction-equipment makers hold about 60% of global market share; their volume and scheduling leverage forces down prices and tightens payment terms, amplified by vendor-reduction programs, while Kobe Steel offsets pressure via multi-product bundles and technical support.
Price sensitivity
Price sensitivity is high for commoditized steel and nonferrous base grades, with buyers benchmarking offers against regional indices and import quotes, pressuring Kobe Steel on headline margins. Cost-pass-through clauses exist in contracts but face execution lag and customer resistance, compressing near-term cash margins. Premiums are achieved through grade differentiation and value-added service offerings rather than base-price competition.
Switching costs
For commodity grades switching is relatively easy via qualified vendor lists, keeping buyer bargaining power high and price sensitivity elevated. For high-strength, automotive and precision alloys requalification often requires 6–12 months and can add significant cost, materially raising switching costs. JIT requirements and tooling compatibility create operational friction and inventory risk for buyers. Joint R&D partnerships further increase buyer stickiness and long-term dependency.
Demand cyclicality
Service expectations
Kobe Steel reported consolidated revenue of about JPY 1.04 trillion for FY2023; buyers now insist on stable quality, on-time delivery and ongoing technical assistance, pushing suppliers to provide customized slitting, heat treatment and welding support as differentiators. Failure penalties and warranty risks increase buyer leverage, while bundled integrated solutions can command meaningful premiums.
- Stable quality, delivery, technical support
- Customized slitting, heat treatment, welding
- Failure penalties and warranty exposure
- Integrated solutions justify pricing premiums
Concentrated OEM/ship buying power squeezes steel margins; specialty-alloys raise switching costs
Auto OEMs, shipbuilders and construction-equipment giants concentrate buying power (top-10 OEMs ~66% vehicle output; China/SK/Japan >90% large ship orders), pressuring Kobe Steel on price, terms and payment; commodity grades face easy switching while specialty alloys require 6–12 month requalification, raising switching costs. Downturns amplify buyer leverage; Kobe offsets via bundles, technical support and flexible contracts.
| Metric | Value |
|---|---|
| FY2023 Rev | JPY 1.04T |
| Top-10 OEM share | ~66% |
| Ship orders (CN/KR/JP) | >90% |
| Requalify time | 6–12 months |
Preview the Actual Deliverable
Kobe Steel Porter's Five Forces Analysis
This preview shows the exact document you'll receive immediately after purchase—no surprises, no placeholders. The Kobe Steel Porter's Five Forces Analysis assesses competitive rivalry, supplier and buyer power, threat of new entrants and substitutes, and regulatory impacts. It includes concise strategic implications and action-oriented recommendations, fully formatted and ready to download.











