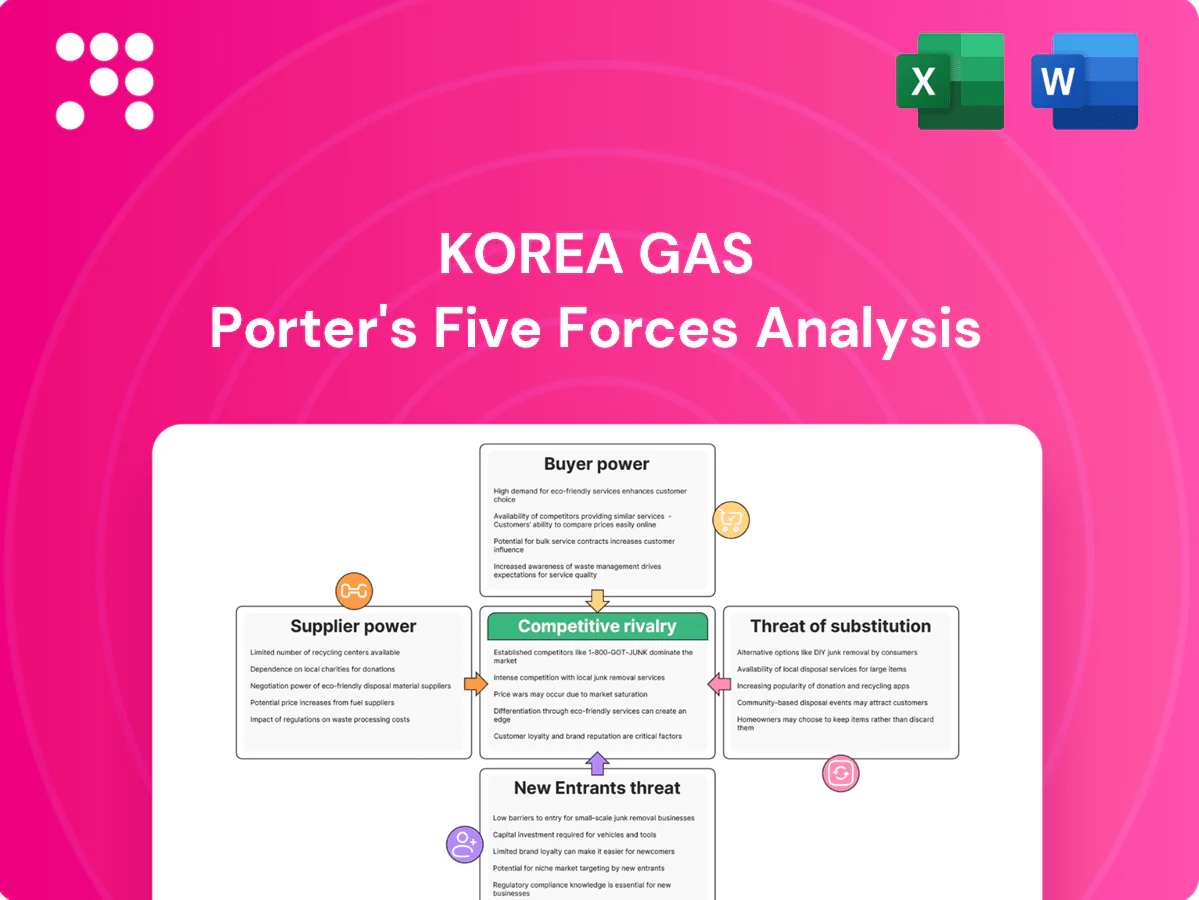
Korea Gas Porter's Five Forces Analysis

From Overview to Strategy Blueprint
Korea Gas faces intense industry rivalry, moderate supplier power, and growing substitute pressure from renewables, while high buyer expectations and significant infrastructure barriers keep new entrants limited. This snapshot highlights key strategic stress points and competitive levers for investors and managers. This brief snapshot only scratches the surface. Unlock the full Porter's Five Forces Analysis to explore Korea Gas’s competitive dynamics, market pressures, and strategic advantages in detail.
Suppliers Bargaining Power

Concentrated LNG supplier base
Global LNG supply remains concentrated among a handful of large producers—Qatar, Australia and the U.S.—giving suppliers leverage over contract terms, volume flexibility and destination clauses. KOGAS mitigates supplier power by diversifying origins and staggering contract maturities to smooth receipt risk. Nonetheless, 2024 geopolitical tensions and project delays have repeatedly shifted bargaining power back toward major producers, preserving supplier leverage.
Long‑term contracts vs spot exposure
KOGAS, the world’s largest LNG buyer in 2024, anchors its portfolio with long‑term take‑or‑pay contracts that stabilize supply but lock in purchase obligations. In tight market phases, spot cargo scarcity pushes supplier pricing power higher and raises marginal costs. During oversupplied cycles KOGAS leverages scale to renegotiate terms or add flexible volumes. Contract optionality and the mix of oil, Henry Hub and JKM indexing determine leverage in each cycle.

Liquefaction and shipping constraints
Limited liquefaction capacity and LNG carrier availability remained binding in 2024 as global export capacity stood near 570 mtpa, creating bottlenecks that let sellers demand premiums or limit flexibility when new trains were delayed. Spot and time-charter rates averaged about $80,000/day in 2024, while Panama/Suez congestion added days and incremental landed costs. KOGAS’s scale — handling roughly 40 mtpa — and multi-year fleet contracts partially offset these supplier pressures.

Currency and geopolitical risks
Deals are largely dollar‑denominated, so KOGAS bears FX swings that suppliers typically do not absorb; geopolitical shocks, sanctions or export curbs in producer states can instantly shift bargaining power to suppliers and tighten spot markets. Diversified sourcing lowers single‑country exposure but cannot prevent systemic shocks; active hedging and government support have been used to buffer volatility.
- Dollar pricing increases FX exposure
- Sanctions/export controls raise supplier leverage
- Diversification mitigates but not eliminates systemic risk
- Hedging and gov't support reduce downside
Upstream equity and partnerships
Equity stakes in overseas gas projects align incentives and secure offtake, with Korea Gas participation historically tying up to ~30–50% of project volumes into long‑term contracts; this improves visibility on landed costs and cuts reliance on spot sellers. Joint ventures have unlocked price flexibility and blended procurement economics, but execution risk—delays and cost overruns—can erode these bargaining gains.
- Secures offtake: ~30–50% project volumes
- Cost visibility: reduces spot exposure (JKM averaged ~9.4 USD/MMBtu in 2024)
- Risk: project delays/cost overruns offset benefits
Concentrated LNG capacity, geopolitics and charter stress elevate supplier pricing power
Suppliers hold high leverage due to concentrated LNG export capacity (~570 mtpa in 2024) and recurring geopolitical shocks, raising spot pricing power. KOGAS (≈40 mtpa demand) uses long‑term take‑or‑pay contracts, equity stakes (secures ~30–50% project volumes) and hedging to blunt supplier power. Vessel/time‑charter stress (avg ~$80,000/day in 2024) and dollar pricing sustain supplier bargaining strength.
| Metric | 2024 |
|---|---|
| Global export capacity | ~570 mtpa |
| KOGAS demand | ~40 mtpa |
| JKM avg | ~$9.4/MMBtu |
| Charter avg | ~$80,000/day |
What is included in the product
 Detailed Word Document
Concise Porter's Five Forces analysis of Korea Gas, detailing competitive rivalry, supplier and buyer power, threat of new entrants and substitutes, and highlighting regulatory, infrastructure, and LNG supply risks that shape pricing power and profitability.

 Customizable Excel Spreadsheet
A concise one-sheet Porter's Five Forces for Korea Gas with adjustable pressure levels and an instant radar chart—ready for slide decks, scenario tabs, and non-technical users to quickly identify strategic pain points and relief actions.
Customers Bargaining Power

Regulated domestic market
KOGAS, the world's largest LNG buyer, sells mainly to power generators and city gas companies under a regulated framework that caps buyer bargaining despite their centrality to domestic demand.
Government oversight constrains KOGAS pricing discretion and tariff adjustments typically lag international cost shifts, squeezing margins during periods of volatile global LNG prices.
Negotiations are driven more by policy goals—energy security and affordability—than by pure commercial leverage, with regulators prioritizing stable supply and consumer tariffs over spot-market alignment.
Large utility and industrial buyers
Major utilities and industrials in Korea purchase LNG in large volumes, with a handful of buyers accounting for the bulk of demand, giving them leverage on delivery profiles and contract terms. KOGAS’s control of pipeline and regasification infrastructure—roughly 70%+ of domestic access—limits buyers’ ability to switch suppliers. Strong seasonality concentrates demand peaks, weakening buyer negotiating power at those times.

Emerging direct‑import options
Gradual market liberalization lets industrials and power firms import LNG via FSRUs or third‑party terminals, giving a credible outside option for select buyers; Korea imported about 40 Mt LNG in 2024, so direct imports affect limited volumes. Network access, credit requirements and security‑of‑supply obligations keep most buyers tied to incumbents, so buyer power increases at the margin rather than system‑wide.

Demand elasticity and fuel switching
Korean power generators can switch among LNG, coal, nuclear and renewables, and when 2024 relative generation costs favored coal or nuclear (2024 mix approx coal 34%, LNG 30%, nuclear 28%, renewables 8%) buyers demand tougher gas pricing; industrial fuel switching is slower but feasible over years; elasticity rises in low‑demand or low power‑price periods, strengthening buyer leverage.
- 2024 mix: coal 34% / LNG 30% / nuclear 28% / renewables 8%
- Power sector: high short‑term switching -> stronger bargaining
- Industry: slower switching -> medium term pressure
- Low demand/prices -> increased elasticity, buyer power
Service quality and reliability needs
South Korea’s stringent reliability standards make supply security paramount; KOGAS supplies about 70% of domestic piped gas and supports national LNG needs, with South Korea importing roughly 43 million tonnes of LNG in 2023. KOGAS’s nationwide terminals and storage capacity create buyer dependence, reducing pure price-exit threats. The premium buyers place on reliability thus weakens their bargaining power during critical periods.
- KOGAS market share: ~70%
- SK LNG imports: ~43 Mt (2023)
- Reliability premium reduces exit threats
State buyer ~70% market power persists despite ~40 Mt LNG imports
KOGAS dominates (~70% market share) and serves regulated buyers, limiting pure price bargaining despite large-volume customers. Korea imported ~40 Mt LNG in 2024; power mix 2024: coal 34% / LNG 30% / nuclear 28% / renewables 8%, so switching fuels and liberalized imports provide marginal buyer leverage. Reliability needs reduce exit threats, tightening KOGAS position.
| Metric | 2024 |
|---|---|
| KOGAS share | ~70% |
| LNG imports | ~40 Mt |
| Power mix (coal/LNG/nuc/ren) | 34/30/28/8% |
Same Document Delivered
Korea Gas Porter's Five Forces Analysis
This preview shows the exact Korea Gas Porter’s Five Forces analysis you’ll receive instantly after purchase—no samples or placeholders. It assesses competitive rivalry, supplier and buyer power, and threats of new entrants and substitutes specific to Korea Gas. The document is fully formatted, ready for download and immediate use. Use it for strategic, investment, or academic decisions.

From Overview to Strategy Blueprint
Korea Gas faces intense industry rivalry, moderate supplier power, and growing substitute pressure from renewables, while high buyer expectations and significant infrastructure barriers keep new entrants limited. This snapshot highlights key strategic stress points and competitive levers for investors and managers. This brief snapshot only scratches the surface. Unlock the full Porter's Five Forces Analysis to explore Korea Gas’s competitive dynamics, market pressures, and strategic advantages in detail.
Suppliers Bargaining Power
Concentrated LNG supplier base
Global LNG supply remains concentrated among a handful of large producers—Qatar, Australia and the U.S.—giving suppliers leverage over contract terms, volume flexibility and destination clauses. KOGAS mitigates supplier power by diversifying origins and staggering contract maturities to smooth receipt risk. Nonetheless, 2024 geopolitical tensions and project delays have repeatedly shifted bargaining power back toward major producers, preserving supplier leverage.
Long‑term contracts vs spot exposure
KOGAS, the world’s largest LNG buyer in 2024, anchors its portfolio with long‑term take‑or‑pay contracts that stabilize supply but lock in purchase obligations. In tight market phases, spot cargo scarcity pushes supplier pricing power higher and raises marginal costs. During oversupplied cycles KOGAS leverages scale to renegotiate terms or add flexible volumes. Contract optionality and the mix of oil, Henry Hub and JKM indexing determine leverage in each cycle.
Liquefaction and shipping constraints
Limited liquefaction capacity and LNG carrier availability remained binding in 2024 as global export capacity stood near 570 mtpa, creating bottlenecks that let sellers demand premiums or limit flexibility when new trains were delayed. Spot and time-charter rates averaged about $80,000/day in 2024, while Panama/Suez congestion added days and incremental landed costs. KOGAS’s scale — handling roughly 40 mtpa — and multi-year fleet contracts partially offset these supplier pressures.
Currency and geopolitical risks
Deals are largely dollar‑denominated, so KOGAS bears FX swings that suppliers typically do not absorb; geopolitical shocks, sanctions or export curbs in producer states can instantly shift bargaining power to suppliers and tighten spot markets. Diversified sourcing lowers single‑country exposure but cannot prevent systemic shocks; active hedging and government support have been used to buffer volatility.
- Dollar pricing increases FX exposure
- Sanctions/export controls raise supplier leverage
- Diversification mitigates but not eliminates systemic risk
- Hedging and gov't support reduce downside
Upstream equity and partnerships
Equity stakes in overseas gas projects align incentives and secure offtake, with Korea Gas participation historically tying up to ~30–50% of project volumes into long‑term contracts; this improves visibility on landed costs and cuts reliance on spot sellers. Joint ventures have unlocked price flexibility and blended procurement economics, but execution risk—delays and cost overruns—can erode these bargaining gains.
- Secures offtake: ~30–50% project volumes
- Cost visibility: reduces spot exposure (JKM averaged ~9.4 USD/MMBtu in 2024)
- Risk: project delays/cost overruns offset benefits
Concentrated LNG capacity, geopolitics and charter stress elevate supplier pricing power
Suppliers hold high leverage due to concentrated LNG export capacity (~570 mtpa in 2024) and recurring geopolitical shocks, raising spot pricing power. KOGAS (≈40 mtpa demand) uses long‑term take‑or‑pay contracts, equity stakes (secures ~30–50% project volumes) and hedging to blunt supplier power. Vessel/time‑charter stress (avg ~$80,000/day in 2024) and dollar pricing sustain supplier bargaining strength.
| Metric | 2024 |
|---|---|
| Global export capacity | ~570 mtpa |
| KOGAS demand | ~40 mtpa |
| JKM avg | ~$9.4/MMBtu |
| Charter avg | ~$80,000/day |
What is included in the product
Detailed Word Document
Concise Porter's Five Forces analysis of Korea Gas, detailing competitive rivalry, supplier and buyer power, threat of new entrants and substitutes, and highlighting regulatory, infrastructure, and LNG supply risks that shape pricing power and profitability.
Customizable Excel Spreadsheet
A concise one-sheet Porter's Five Forces for Korea Gas with adjustable pressure levels and an instant radar chart—ready for slide decks, scenario tabs, and non-technical users to quickly identify strategic pain points and relief actions.
Customers Bargaining Power
Regulated domestic market
KOGAS, the world's largest LNG buyer, sells mainly to power generators and city gas companies under a regulated framework that caps buyer bargaining despite their centrality to domestic demand.
Government oversight constrains KOGAS pricing discretion and tariff adjustments typically lag international cost shifts, squeezing margins during periods of volatile global LNG prices.
Negotiations are driven more by policy goals—energy security and affordability—than by pure commercial leverage, with regulators prioritizing stable supply and consumer tariffs over spot-market alignment.
Large utility and industrial buyers
Major utilities and industrials in Korea purchase LNG in large volumes, with a handful of buyers accounting for the bulk of demand, giving them leverage on delivery profiles and contract terms. KOGAS’s control of pipeline and regasification infrastructure—roughly 70%+ of domestic access—limits buyers’ ability to switch suppliers. Strong seasonality concentrates demand peaks, weakening buyer negotiating power at those times.
Emerging direct‑import options
Gradual market liberalization lets industrials and power firms import LNG via FSRUs or third‑party terminals, giving a credible outside option for select buyers; Korea imported about 40 Mt LNG in 2024, so direct imports affect limited volumes. Network access, credit requirements and security‑of‑supply obligations keep most buyers tied to incumbents, so buyer power increases at the margin rather than system‑wide.
Demand elasticity and fuel switching
Korean power generators can switch among LNG, coal, nuclear and renewables, and when 2024 relative generation costs favored coal or nuclear (2024 mix approx coal 34%, LNG 30%, nuclear 28%, renewables 8%) buyers demand tougher gas pricing; industrial fuel switching is slower but feasible over years; elasticity rises in low‑demand or low power‑price periods, strengthening buyer leverage.
- 2024 mix: coal 34% / LNG 30% / nuclear 28% / renewables 8%
- Power sector: high short‑term switching -> stronger bargaining
- Industry: slower switching -> medium term pressure
- Low demand/prices -> increased elasticity, buyer power
Service quality and reliability needs
South Korea’s stringent reliability standards make supply security paramount; KOGAS supplies about 70% of domestic piped gas and supports national LNG needs, with South Korea importing roughly 43 million tonnes of LNG in 2023. KOGAS’s nationwide terminals and storage capacity create buyer dependence, reducing pure price-exit threats. The premium buyers place on reliability thus weakens their bargaining power during critical periods.
- KOGAS market share: ~70%
- SK LNG imports: ~43 Mt (2023)
- Reliability premium reduces exit threats
State buyer ~70% market power persists despite ~40 Mt LNG imports
KOGAS dominates (~70% market share) and serves regulated buyers, limiting pure price bargaining despite large-volume customers. Korea imported ~40 Mt LNG in 2024; power mix 2024: coal 34% / LNG 30% / nuclear 28% / renewables 8%, so switching fuels and liberalized imports provide marginal buyer leverage. Reliability needs reduce exit threats, tightening KOGAS position.
| Metric | 2024 |
|---|---|
| KOGAS share | ~70% |
| LNG imports | ~40 Mt |
| Power mix (coal/LNG/nuc/ren) | 34/30/28/8% |
Same Document Delivered
Korea Gas Porter's Five Forces Analysis
This preview shows the exact Korea Gas Porter’s Five Forces analysis you’ll receive instantly after purchase—no samples or placeholders. It assesses competitive rivalry, supplier and buyer power, and threats of new entrants and substitutes specific to Korea Gas. The document is fully formatted, ready for download and immediate use. Use it for strategic, investment, or academic decisions.
Original: $10.00
-65%$10.00
$3.50Description
From Overview to Strategy Blueprint
Korea Gas faces intense industry rivalry, moderate supplier power, and growing substitute pressure from renewables, while high buyer expectations and significant infrastructure barriers keep new entrants limited. This snapshot highlights key strategic stress points and competitive levers for investors and managers. This brief snapshot only scratches the surface. Unlock the full Porter's Five Forces Analysis to explore Korea Gas’s competitive dynamics, market pressures, and strategic advantages in detail.
Suppliers Bargaining Power
Concentrated LNG supplier base
Global LNG supply remains concentrated among a handful of large producers—Qatar, Australia and the U.S.—giving suppliers leverage over contract terms, volume flexibility and destination clauses. KOGAS mitigates supplier power by diversifying origins and staggering contract maturities to smooth receipt risk. Nonetheless, 2024 geopolitical tensions and project delays have repeatedly shifted bargaining power back toward major producers, preserving supplier leverage.
Long‑term contracts vs spot exposure
KOGAS, the world’s largest LNG buyer in 2024, anchors its portfolio with long‑term take‑or‑pay contracts that stabilize supply but lock in purchase obligations. In tight market phases, spot cargo scarcity pushes supplier pricing power higher and raises marginal costs. During oversupplied cycles KOGAS leverages scale to renegotiate terms or add flexible volumes. Contract optionality and the mix of oil, Henry Hub and JKM indexing determine leverage in each cycle.
Liquefaction and shipping constraints
Limited liquefaction capacity and LNG carrier availability remained binding in 2024 as global export capacity stood near 570 mtpa, creating bottlenecks that let sellers demand premiums or limit flexibility when new trains were delayed. Spot and time-charter rates averaged about $80,000/day in 2024, while Panama/Suez congestion added days and incremental landed costs. KOGAS’s scale — handling roughly 40 mtpa — and multi-year fleet contracts partially offset these supplier pressures.
Currency and geopolitical risks
Deals are largely dollar‑denominated, so KOGAS bears FX swings that suppliers typically do not absorb; geopolitical shocks, sanctions or export curbs in producer states can instantly shift bargaining power to suppliers and tighten spot markets. Diversified sourcing lowers single‑country exposure but cannot prevent systemic shocks; active hedging and government support have been used to buffer volatility.
- Dollar pricing increases FX exposure
- Sanctions/export controls raise supplier leverage
- Diversification mitigates but not eliminates systemic risk
- Hedging and gov't support reduce downside
Upstream equity and partnerships
Equity stakes in overseas gas projects align incentives and secure offtake, with Korea Gas participation historically tying up to ~30–50% of project volumes into long‑term contracts; this improves visibility on landed costs and cuts reliance on spot sellers. Joint ventures have unlocked price flexibility and blended procurement economics, but execution risk—delays and cost overruns—can erode these bargaining gains.
- Secures offtake: ~30–50% project volumes
- Cost visibility: reduces spot exposure (JKM averaged ~9.4 USD/MMBtu in 2024)
- Risk: project delays/cost overruns offset benefits
Concentrated LNG capacity, geopolitics and charter stress elevate supplier pricing power
Suppliers hold high leverage due to concentrated LNG export capacity (~570 mtpa in 2024) and recurring geopolitical shocks, raising spot pricing power. KOGAS (≈40 mtpa demand) uses long‑term take‑or‑pay contracts, equity stakes (secures ~30–50% project volumes) and hedging to blunt supplier power. Vessel/time‑charter stress (avg ~$80,000/day in 2024) and dollar pricing sustain supplier bargaining strength.
| Metric | 2024 |
|---|---|
| Global export capacity | ~570 mtpa |
| KOGAS demand | ~40 mtpa |
| JKM avg | ~$9.4/MMBtu |
| Charter avg | ~$80,000/day |
What is included in the product
Detailed Word Document
Concise Porter's Five Forces analysis of Korea Gas, detailing competitive rivalry, supplier and buyer power, threat of new entrants and substitutes, and highlighting regulatory, infrastructure, and LNG supply risks that shape pricing power and profitability.
Customizable Excel Spreadsheet
A concise one-sheet Porter's Five Forces for Korea Gas with adjustable pressure levels and an instant radar chart—ready for slide decks, scenario tabs, and non-technical users to quickly identify strategic pain points and relief actions.
Customers Bargaining Power
Regulated domestic market
KOGAS, the world's largest LNG buyer, sells mainly to power generators and city gas companies under a regulated framework that caps buyer bargaining despite their centrality to domestic demand.
Government oversight constrains KOGAS pricing discretion and tariff adjustments typically lag international cost shifts, squeezing margins during periods of volatile global LNG prices.
Negotiations are driven more by policy goals—energy security and affordability—than by pure commercial leverage, with regulators prioritizing stable supply and consumer tariffs over spot-market alignment.
Large utility and industrial buyers
Major utilities and industrials in Korea purchase LNG in large volumes, with a handful of buyers accounting for the bulk of demand, giving them leverage on delivery profiles and contract terms. KOGAS’s control of pipeline and regasification infrastructure—roughly 70%+ of domestic access—limits buyers’ ability to switch suppliers. Strong seasonality concentrates demand peaks, weakening buyer negotiating power at those times.
Emerging direct‑import options
Gradual market liberalization lets industrials and power firms import LNG via FSRUs or third‑party terminals, giving a credible outside option for select buyers; Korea imported about 40 Mt LNG in 2024, so direct imports affect limited volumes. Network access, credit requirements and security‑of‑supply obligations keep most buyers tied to incumbents, so buyer power increases at the margin rather than system‑wide.
Demand elasticity and fuel switching
Korean power generators can switch among LNG, coal, nuclear and renewables, and when 2024 relative generation costs favored coal or nuclear (2024 mix approx coal 34%, LNG 30%, nuclear 28%, renewables 8%) buyers demand tougher gas pricing; industrial fuel switching is slower but feasible over years; elasticity rises in low‑demand or low power‑price periods, strengthening buyer leverage.
- 2024 mix: coal 34% / LNG 30% / nuclear 28% / renewables 8%
- Power sector: high short‑term switching -> stronger bargaining
- Industry: slower switching -> medium term pressure
- Low demand/prices -> increased elasticity, buyer power
Service quality and reliability needs
South Korea’s stringent reliability standards make supply security paramount; KOGAS supplies about 70% of domestic piped gas and supports national LNG needs, with South Korea importing roughly 43 million tonnes of LNG in 2023. KOGAS’s nationwide terminals and storage capacity create buyer dependence, reducing pure price-exit threats. The premium buyers place on reliability thus weakens their bargaining power during critical periods.
- KOGAS market share: ~70%
- SK LNG imports: ~43 Mt (2023)
- Reliability premium reduces exit threats
State buyer ~70% market power persists despite ~40 Mt LNG imports
KOGAS dominates (~70% market share) and serves regulated buyers, limiting pure price bargaining despite large-volume customers. Korea imported ~40 Mt LNG in 2024; power mix 2024: coal 34% / LNG 30% / nuclear 28% / renewables 8%, so switching fuels and liberalized imports provide marginal buyer leverage. Reliability needs reduce exit threats, tightening KOGAS position.
| Metric | 2024 |
|---|---|
| KOGAS share | ~70% |
| LNG imports | ~40 Mt |
| Power mix (coal/LNG/nuc/ren) | 34/30/28/8% |
Same Document Delivered
Korea Gas Porter's Five Forces Analysis
This preview shows the exact Korea Gas Porter’s Five Forces analysis you’ll receive instantly after purchase—no samples or placeholders. It assesses competitive rivalry, supplier and buyer power, and threats of new entrants and substitutes specific to Korea Gas. The document is fully formatted, ready for download and immediate use. Use it for strategic, investment, or academic decisions.











