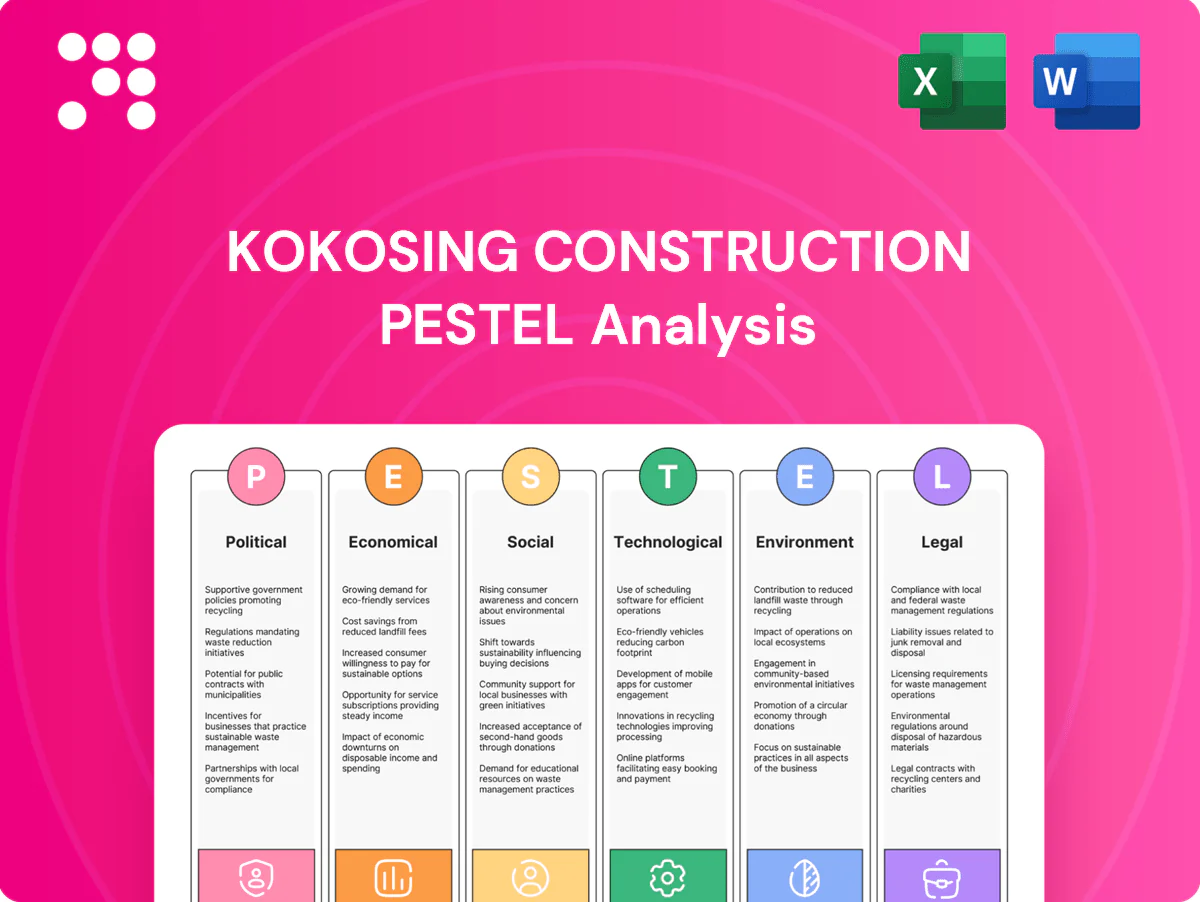
Kokosing Construction PESTLE Analysis

Your Shortcut to Market Insight Starts Here
Discover how political regulations, economic cycles, and technological advances are shaping Kokosing Construction's strategic outlook in our concise PESTLE snapshot. This analysis highlights regulatory risks, environmental trends, and market opportunities you can act on today. Purchase the full PESTLE for the complete, ready-to-use intelligence.
Political factors

Federal infrastructure funding cycles
The 2021 Infrastructure Investment and Jobs Act committed roughly 1.2 trillion dollars overall, including about 550 billion in new federal investment, underpinning Kokosing’s multi‑year project pipeline. Annual appropriations and reauthorizations — with roughly 50 billion per year in federal highway formula funding — drive bid volume and pricing power. Congressional shifts can reallocate funds among highways, bridges, dams and water/wastewater. Scenario planning is required for continuing resolutions and funding gaps.
State DOT and local policy priorities
State transportation commissions set capital plans that shape regional opportunities; the Bipartisan Infrastructure Law (IIJA) directs roughly $110 billion to roads and bridges through federal programs. Midwestern and Mid‑Atlantic DOTs routinely accelerate or delay projects via budget revisions, while political emphasis on bridge rehab (ASCE cited ~46,000 structurally deficient bridges), safety and congestion relief alters Kokosing’s bid mix. Coordination with MPOs and municipal bond issuance calendars is critical for timing and cash-flow.

Buy America and domestic content rules
Strengthened Buy America provisions under the 2021 Infrastructure Investment and Jobs Act (IIJA, ~$1.2 trillion) increase domestic sourcing mandates for steel, rebar and manufactured components on federal-funded projects. Compliance can constrain supply and extend lead times, risking schedule delays unless early supplier alignment and proactive waiver management are implemented. Cost impacts from domestic premium must be priced into bids to protect margins.

Permitting and environmental review reform
NEPA timelines can dictate project start dates: environmental impact statements historically take about 3–7 years, while the CEQ 2023 NEPA rule establishes presumptive limits of two years for EIS and one year for EAs; FAST-41 (2015) and IIJA (2021) include permitting/streamlining tools. Streamlining may shorten pre-construction, but litigation and administrative challenges still pose delay risks; proactive stakeholder engagement and thorough project documentation improve defensibility.
- NEPA: EIS 3–7 years; CEQ 2023: EIS 2y, EA 1y
- Policy drivers: FAST-41 (2015), IIJA (2021)
- Mitigation: stakeholder outreach + robust records reduce legal delay risk
Labor policy and public procurement rules
Prevailing wage rules such as Davis‑Bacon on federal work and project labor agreements (PLAs) plus apprenticeship requirements raise direct labor costs and shape crew planning; the Bipartisan Infrastructure Law committed roughly 550 billion dollars of new federal investment, increasing federally covered work. Low‑bid statutes and rising use of CM/GC, design‑build and P3 shift risk to contractors; political changes since 2021 have expanded alternative delivery in many states, so Kokosing must adapt contracting strategy by market.
- Prevailing wage: Davis‑Bacon applies to federal projects
- PLAs/apprenticeships: increase labor cost and staffing constraints
- Procurement: low‑bid vs CM/GC, DB, P3 alter risk allocation
- Policy risk: political shifts change market availability
IIJA $1.2T, $110B roads surge backlog; Buy America, NEPA timing, bond cycles reshape bids
Federal IIJA ~$1.2T (≈$550B new) and ~$110B for roads/bridges drive Kokosing backlog; Buy America, Davis‑Bacon and PLAs raise costs and procurement complexity. CEQ 2023 NEPA limits (EIS 2y, EA 1y) and FAST-41 streamline but litigation/CRs create timing risk. State DOT capital plans and municipal bond cycles shift regional opportunities and bid timing.
| Item | Value/Impact |
|---|---|
| IIJA | $1.2T total; $550B new |
| Roads/bridges | $110B |
| Structurally deficient bridges | ~46,000 (ASCE) |
| NEPA | EIS 2y/EA 1y (CEQ 2023) |
What is included in the product
 Detailed Word Document
Explores how macro-environmental factors uniquely affect Kokosing Construction across Political, Economic, Social, Technological, Environmental and Legal dimensions, with data-driven examples tied to its regional construction markets. Designed for executives and advisors, it highlights actionable risks, opportunities and forward-looking insights for strategic planning.

 Customizable Excel Spreadsheet
A concise, visually segmented PESTLE summary of Kokosing Construction that’s easily dropped into presentations or shared across teams, uses simple language for broad accessibility, and allows note-taking for region- or business-specific context—speeding alignment on external risks and strategic positioning.
Economic factors

Interest rates and financing conditions
Higher policy rates — federal funds near 5.25% and 10‑yr Treasuries ~4.3% in mid‑2025 — lift surety and borrowing costs, adding 100–200 bps to bonding and compressing private industrial and marine project starts. Municipal borrowing capacity and issuance timing hinge on these rate trends, slowing issuances when yields spike. PPP feasibility and concession bids are highly rate‑sensitive; hedging and flexible bid contingencies can preserve margins.
Materials cost volatility
Materials cost volatility—steel (HRC ~900 USD/ton in 2024), cement (~120 USD/ton) and asphalt (~400 USD/ton) plus diesel (~3.7 USD/gal end-2024) — materially alters Kokosing job economics and margins. Escalation clauses and index-linked contracts are used to shift market risk. Strategic bulk buys and preferred-supplier partnerships secure availability and pricing. Estimating must embed volatility bands and explicit contingencies in bids.

Skilled labor availability and wages
Tight craft labor markets have pushed U.S. construction employment to roughly 7.7 million in 2024, lifting trade wages and constraining capacity for Kokosing. Targeted productivity investments and apprenticeship pipelines have offset shortages, raising crew output per hour. Strong backlog enables pricing power when scarcity peaks. Strategic workforce planning aligns skilled crews to high‑margin segments to protect margins.

Public vs. private demand mix
Public infrastructure backed by the Bipartisan Infrastructure Law (about 550 billion USD of new investments) can counter‑cycle private industrial slowdowns, while private work in manufacturing, energy and rail adds margin diversity but higher demand volatility; balancing backlog across owners smooths revenue and preconstruction services increase sole‑source or negotiated wins.
- Public cushion: BIL ~550B
- Private: higher margin, higher risk
- Backlog balance = revenue smoothing
- Precon drives sole‑source opportunities
Supply chain reliability and logistics
- Lead times: 12–30 weeks
- Barge relevance: 629M tons (USACE 2023)
- Mitigants: dual‑sourcing, early buy
- Protection: inventory buffers on long‑lead items
IIJA $1.2T, $110B roads surge backlog; Buy America, NEPA timing, bond cycles reshape bids
Higher rates (fed funds ~5.25%, 10y ~4.3%) raise surety/borrowing costs; materials volatility (HRC ~900 USD/ton, diesel ~3.7 USD/gal) and tight labor (7.7M construction jobs) compress margins; BIL ~550B provides public backlog cushion while 12–30 week lead times and 629M tons inland barge traffic create supply‑chain critical paths.
| Metric | Value |
|---|---|
| Fed funds | ~5.25% |
| 10‑yr | ~4.3% |
| HRC steel | ~900 USD/ton |
| Diesel | ~3.7 USD/gal |
| Construction jobs | ~7.7M |
| BIL | ~550B USD |
| Lead times | 12–30 weeks |
| Barge tonnage | 629M tons (2023) |
What You See Is What You Get
Kokosing Construction PESTLE Analysis
The preview shown here is the exact Kokosing Construction PESTLE Analysis document you’ll receive after purchase—fully formatted and ready to use. It contains the same structure, insights, and data visible in this snapshot. No placeholders or teasers—this is the finished file. After payment you’ll download this identical, professionally structured report.

Your Shortcut to Market Insight Starts Here
Discover how political regulations, economic cycles, and technological advances are shaping Kokosing Construction's strategic outlook in our concise PESTLE snapshot. This analysis highlights regulatory risks, environmental trends, and market opportunities you can act on today. Purchase the full PESTLE for the complete, ready-to-use intelligence.
Political factors
Federal infrastructure funding cycles
The 2021 Infrastructure Investment and Jobs Act committed roughly 1.2 trillion dollars overall, including about 550 billion in new federal investment, underpinning Kokosing’s multi‑year project pipeline. Annual appropriations and reauthorizations — with roughly 50 billion per year in federal highway formula funding — drive bid volume and pricing power. Congressional shifts can reallocate funds among highways, bridges, dams and water/wastewater. Scenario planning is required for continuing resolutions and funding gaps.
State DOT and local policy priorities
State transportation commissions set capital plans that shape regional opportunities; the Bipartisan Infrastructure Law (IIJA) directs roughly $110 billion to roads and bridges through federal programs. Midwestern and Mid‑Atlantic DOTs routinely accelerate or delay projects via budget revisions, while political emphasis on bridge rehab (ASCE cited ~46,000 structurally deficient bridges), safety and congestion relief alters Kokosing’s bid mix. Coordination with MPOs and municipal bond issuance calendars is critical for timing and cash-flow.
Buy America and domestic content rules
Strengthened Buy America provisions under the 2021 Infrastructure Investment and Jobs Act (IIJA, ~$1.2 trillion) increase domestic sourcing mandates for steel, rebar and manufactured components on federal-funded projects. Compliance can constrain supply and extend lead times, risking schedule delays unless early supplier alignment and proactive waiver management are implemented. Cost impacts from domestic premium must be priced into bids to protect margins.
Permitting and environmental review reform
NEPA timelines can dictate project start dates: environmental impact statements historically take about 3–7 years, while the CEQ 2023 NEPA rule establishes presumptive limits of two years for EIS and one year for EAs; FAST-41 (2015) and IIJA (2021) include permitting/streamlining tools. Streamlining may shorten pre-construction, but litigation and administrative challenges still pose delay risks; proactive stakeholder engagement and thorough project documentation improve defensibility.
- NEPA: EIS 3–7 years; CEQ 2023: EIS 2y, EA 1y
- Policy drivers: FAST-41 (2015), IIJA (2021)
- Mitigation: stakeholder outreach + robust records reduce legal delay risk
Labor policy and public procurement rules
Prevailing wage rules such as Davis‑Bacon on federal work and project labor agreements (PLAs) plus apprenticeship requirements raise direct labor costs and shape crew planning; the Bipartisan Infrastructure Law committed roughly 550 billion dollars of new federal investment, increasing federally covered work. Low‑bid statutes and rising use of CM/GC, design‑build and P3 shift risk to contractors; political changes since 2021 have expanded alternative delivery in many states, so Kokosing must adapt contracting strategy by market.
- Prevailing wage: Davis‑Bacon applies to federal projects
- PLAs/apprenticeships: increase labor cost and staffing constraints
- Procurement: low‑bid vs CM/GC, DB, P3 alter risk allocation
- Policy risk: political shifts change market availability
IIJA $1.2T, $110B roads surge backlog; Buy America, NEPA timing, bond cycles reshape bids
Federal IIJA ~$1.2T (≈$550B new) and ~$110B for roads/bridges drive Kokosing backlog; Buy America, Davis‑Bacon and PLAs raise costs and procurement complexity. CEQ 2023 NEPA limits (EIS 2y, EA 1y) and FAST-41 streamline but litigation/CRs create timing risk. State DOT capital plans and municipal bond cycles shift regional opportunities and bid timing.
| Item | Value/Impact |
|---|---|
| IIJA | $1.2T total; $550B new |
| Roads/bridges | $110B |
| Structurally deficient bridges | ~46,000 (ASCE) |
| NEPA | EIS 2y/EA 1y (CEQ 2023) |
What is included in the product
Detailed Word Document
Explores how macro-environmental factors uniquely affect Kokosing Construction across Political, Economic, Social, Technological, Environmental and Legal dimensions, with data-driven examples tied to its regional construction markets. Designed for executives and advisors, it highlights actionable risks, opportunities and forward-looking insights for strategic planning.
Customizable Excel Spreadsheet
A concise, visually segmented PESTLE summary of Kokosing Construction that’s easily dropped into presentations or shared across teams, uses simple language for broad accessibility, and allows note-taking for region- or business-specific context—speeding alignment on external risks and strategic positioning.
Economic factors
Interest rates and financing conditions
Higher policy rates — federal funds near 5.25% and 10‑yr Treasuries ~4.3% in mid‑2025 — lift surety and borrowing costs, adding 100–200 bps to bonding and compressing private industrial and marine project starts. Municipal borrowing capacity and issuance timing hinge on these rate trends, slowing issuances when yields spike. PPP feasibility and concession bids are highly rate‑sensitive; hedging and flexible bid contingencies can preserve margins.
Materials cost volatility
Materials cost volatility—steel (HRC ~900 USD/ton in 2024), cement (~120 USD/ton) and asphalt (~400 USD/ton) plus diesel (~3.7 USD/gal end-2024) — materially alters Kokosing job economics and margins. Escalation clauses and index-linked contracts are used to shift market risk. Strategic bulk buys and preferred-supplier partnerships secure availability and pricing. Estimating must embed volatility bands and explicit contingencies in bids.
Skilled labor availability and wages
Tight craft labor markets have pushed U.S. construction employment to roughly 7.7 million in 2024, lifting trade wages and constraining capacity for Kokosing. Targeted productivity investments and apprenticeship pipelines have offset shortages, raising crew output per hour. Strong backlog enables pricing power when scarcity peaks. Strategic workforce planning aligns skilled crews to high‑margin segments to protect margins.
Public vs. private demand mix
Public infrastructure backed by the Bipartisan Infrastructure Law (about 550 billion USD of new investments) can counter‑cycle private industrial slowdowns, while private work in manufacturing, energy and rail adds margin diversity but higher demand volatility; balancing backlog across owners smooths revenue and preconstruction services increase sole‑source or negotiated wins.
- Public cushion: BIL ~550B
- Private: higher margin, higher risk
- Backlog balance = revenue smoothing
- Precon drives sole‑source opportunities
Supply chain reliability and logistics
- Lead times: 12–30 weeks
- Barge relevance: 629M tons (USACE 2023)
- Mitigants: dual‑sourcing, early buy
- Protection: inventory buffers on long‑lead items
IIJA $1.2T, $110B roads surge backlog; Buy America, NEPA timing, bond cycles reshape bids
Higher rates (fed funds ~5.25%, 10y ~4.3%) raise surety/borrowing costs; materials volatility (HRC ~900 USD/ton, diesel ~3.7 USD/gal) and tight labor (7.7M construction jobs) compress margins; BIL ~550B provides public backlog cushion while 12–30 week lead times and 629M tons inland barge traffic create supply‑chain critical paths.
| Metric | Value |
|---|---|
| Fed funds | ~5.25% |
| 10‑yr | ~4.3% |
| HRC steel | ~900 USD/ton |
| Diesel | ~3.7 USD/gal |
| Construction jobs | ~7.7M |
| BIL | ~550B USD |
| Lead times | 12–30 weeks |
| Barge tonnage | 629M tons (2023) |
What You See Is What You Get
Kokosing Construction PESTLE Analysis
The preview shown here is the exact Kokosing Construction PESTLE Analysis document you’ll receive after purchase—fully formatted and ready to use. It contains the same structure, insights, and data visible in this snapshot. No placeholders or teasers—this is the finished file. After payment you’ll download this identical, professionally structured report.
Description
Your Shortcut to Market Insight Starts Here
Discover how political regulations, economic cycles, and technological advances are shaping Kokosing Construction's strategic outlook in our concise PESTLE snapshot. This analysis highlights regulatory risks, environmental trends, and market opportunities you can act on today. Purchase the full PESTLE for the complete, ready-to-use intelligence.
Political factors
Federal infrastructure funding cycles
The 2021 Infrastructure Investment and Jobs Act committed roughly 1.2 trillion dollars overall, including about 550 billion in new federal investment, underpinning Kokosing’s multi‑year project pipeline. Annual appropriations and reauthorizations — with roughly 50 billion per year in federal highway formula funding — drive bid volume and pricing power. Congressional shifts can reallocate funds among highways, bridges, dams and water/wastewater. Scenario planning is required for continuing resolutions and funding gaps.
State DOT and local policy priorities
State transportation commissions set capital plans that shape regional opportunities; the Bipartisan Infrastructure Law (IIJA) directs roughly $110 billion to roads and bridges through federal programs. Midwestern and Mid‑Atlantic DOTs routinely accelerate or delay projects via budget revisions, while political emphasis on bridge rehab (ASCE cited ~46,000 structurally deficient bridges), safety and congestion relief alters Kokosing’s bid mix. Coordination with MPOs and municipal bond issuance calendars is critical for timing and cash-flow.
Buy America and domestic content rules
Strengthened Buy America provisions under the 2021 Infrastructure Investment and Jobs Act (IIJA, ~$1.2 trillion) increase domestic sourcing mandates for steel, rebar and manufactured components on federal-funded projects. Compliance can constrain supply and extend lead times, risking schedule delays unless early supplier alignment and proactive waiver management are implemented. Cost impacts from domestic premium must be priced into bids to protect margins.
Permitting and environmental review reform
NEPA timelines can dictate project start dates: environmental impact statements historically take about 3–7 years, while the CEQ 2023 NEPA rule establishes presumptive limits of two years for EIS and one year for EAs; FAST-41 (2015) and IIJA (2021) include permitting/streamlining tools. Streamlining may shorten pre-construction, but litigation and administrative challenges still pose delay risks; proactive stakeholder engagement and thorough project documentation improve defensibility.
- NEPA: EIS 3–7 years; CEQ 2023: EIS 2y, EA 1y
- Policy drivers: FAST-41 (2015), IIJA (2021)
- Mitigation: stakeholder outreach + robust records reduce legal delay risk
Labor policy and public procurement rules
Prevailing wage rules such as Davis‑Bacon on federal work and project labor agreements (PLAs) plus apprenticeship requirements raise direct labor costs and shape crew planning; the Bipartisan Infrastructure Law committed roughly 550 billion dollars of new federal investment, increasing federally covered work. Low‑bid statutes and rising use of CM/GC, design‑build and P3 shift risk to contractors; political changes since 2021 have expanded alternative delivery in many states, so Kokosing must adapt contracting strategy by market.
- Prevailing wage: Davis‑Bacon applies to federal projects
- PLAs/apprenticeships: increase labor cost and staffing constraints
- Procurement: low‑bid vs CM/GC, DB, P3 alter risk allocation
- Policy risk: political shifts change market availability
IIJA $1.2T, $110B roads surge backlog; Buy America, NEPA timing, bond cycles reshape bids
Federal IIJA ~$1.2T (≈$550B new) and ~$110B for roads/bridges drive Kokosing backlog; Buy America, Davis‑Bacon and PLAs raise costs and procurement complexity. CEQ 2023 NEPA limits (EIS 2y, EA 1y) and FAST-41 streamline but litigation/CRs create timing risk. State DOT capital plans and municipal bond cycles shift regional opportunities and bid timing.
| Item | Value/Impact |
|---|---|
| IIJA | $1.2T total; $550B new |
| Roads/bridges | $110B |
| Structurally deficient bridges | ~46,000 (ASCE) |
| NEPA | EIS 2y/EA 1y (CEQ 2023) |
What is included in the product
Detailed Word Document
Explores how macro-environmental factors uniquely affect Kokosing Construction across Political, Economic, Social, Technological, Environmental and Legal dimensions, with data-driven examples tied to its regional construction markets. Designed for executives and advisors, it highlights actionable risks, opportunities and forward-looking insights for strategic planning.
Customizable Excel Spreadsheet
A concise, visually segmented PESTLE summary of Kokosing Construction that’s easily dropped into presentations or shared across teams, uses simple language for broad accessibility, and allows note-taking for region- or business-specific context—speeding alignment on external risks and strategic positioning.
Economic factors
Interest rates and financing conditions
Higher policy rates — federal funds near 5.25% and 10‑yr Treasuries ~4.3% in mid‑2025 — lift surety and borrowing costs, adding 100–200 bps to bonding and compressing private industrial and marine project starts. Municipal borrowing capacity and issuance timing hinge on these rate trends, slowing issuances when yields spike. PPP feasibility and concession bids are highly rate‑sensitive; hedging and flexible bid contingencies can preserve margins.
Materials cost volatility
Materials cost volatility—steel (HRC ~900 USD/ton in 2024), cement (~120 USD/ton) and asphalt (~400 USD/ton) plus diesel (~3.7 USD/gal end-2024) — materially alters Kokosing job economics and margins. Escalation clauses and index-linked contracts are used to shift market risk. Strategic bulk buys and preferred-supplier partnerships secure availability and pricing. Estimating must embed volatility bands and explicit contingencies in bids.
Skilled labor availability and wages
Tight craft labor markets have pushed U.S. construction employment to roughly 7.7 million in 2024, lifting trade wages and constraining capacity for Kokosing. Targeted productivity investments and apprenticeship pipelines have offset shortages, raising crew output per hour. Strong backlog enables pricing power when scarcity peaks. Strategic workforce planning aligns skilled crews to high‑margin segments to protect margins.
Public vs. private demand mix
Public infrastructure backed by the Bipartisan Infrastructure Law (about 550 billion USD of new investments) can counter‑cycle private industrial slowdowns, while private work in manufacturing, energy and rail adds margin diversity but higher demand volatility; balancing backlog across owners smooths revenue and preconstruction services increase sole‑source or negotiated wins.
- Public cushion: BIL ~550B
- Private: higher margin, higher risk
- Backlog balance = revenue smoothing
- Precon drives sole‑source opportunities
Supply chain reliability and logistics
- Lead times: 12–30 weeks
- Barge relevance: 629M tons (USACE 2023)
- Mitigants: dual‑sourcing, early buy
- Protection: inventory buffers on long‑lead items
IIJA $1.2T, $110B roads surge backlog; Buy America, NEPA timing, bond cycles reshape bids
Higher rates (fed funds ~5.25%, 10y ~4.3%) raise surety/borrowing costs; materials volatility (HRC ~900 USD/ton, diesel ~3.7 USD/gal) and tight labor (7.7M construction jobs) compress margins; BIL ~550B provides public backlog cushion while 12–30 week lead times and 629M tons inland barge traffic create supply‑chain critical paths.
| Metric | Value |
|---|---|
| Fed funds | ~5.25% |
| 10‑yr | ~4.3% |
| HRC steel | ~900 USD/ton |
| Diesel | ~3.7 USD/gal |
| Construction jobs | ~7.7M |
| BIL | ~550B USD |
| Lead times | 12–30 weeks |
| Barge tonnage | 629M tons (2023) |
What You See Is What You Get
Kokosing Construction PESTLE Analysis
The preview shown here is the exact Kokosing Construction PESTLE Analysis document you’ll receive after purchase—fully formatted and ready to use. It contains the same structure, insights, and data visible in this snapshot. No placeholders or teasers—this is the finished file. After payment you’ll download this identical, professionally structured report.











