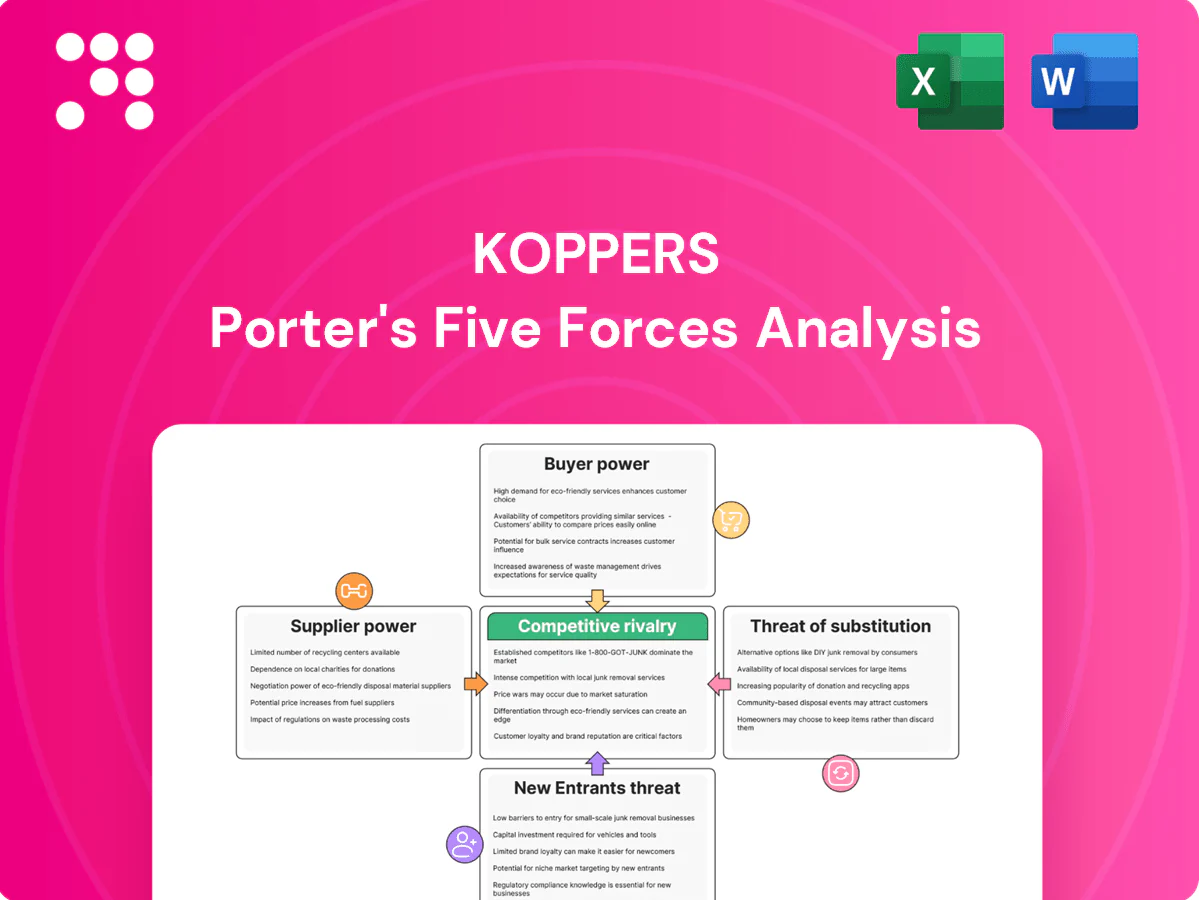
Koppers Porter's Five Forces Analysis

Don't Miss the Bigger Picture
Koppers faces moderate supplier power and substitution risk, while buyer concentration and regulatory hurdles shape competitive intensity—this snapshot highlights key tensions and strategic levers. The full Porter's Five Forces Analysis unpacks each force with force-by-force ratings, visuals, and actionable implications for investors and strategists. Unlock the complete report to make informed, data-driven decisions about Koppers’s market position.
Suppliers Bargaining Power

Concentrated raw material sources
Coal tar, copper-based biocides and certified timber come from concentrated upstreams—coal tar is a cokemaking byproduct tied to steel output (global crude steel was about 1,883 Mt in 2023 per World Steel Association), while specialty chemical and certified forest suppliers are limited, boosting supplier pricing leverage. Steel-cycle slowdowns can sharply curtail coal tar flows; Koppers offsets risk with multi-year supply contracts and geographic supplier diversification.
Input price volatility
Commodity-linked inputs such as coal tar, energy and freight swing with industrial cycles — Brent crude averaged about $87/bbl in 2024 and the Baltic Dry Index averaged near 1,800, allowing suppliers to pass through cost increases and squeeze margins when contracts lag. Hedging and pass-through clauses mitigate but remain imperfect, leaving Koppers exposed to price spikes. Volatility raises working capital needs and planning complexity, forcing tighter cash and inventory management.

Switching and qualification costs
Preservatives and carbon compounds require performance certification and process tuning, with qualification cycles commonly taking 3–9 months and validation/testing costs often ranging from $20,000–$200,000 per SKU in 2024. Switching suppliers entails testing, compliance and potential production risk, raising supplier stickiness and giving suppliers incremental leverage on specs and 8–12 week lead times. Dual-qualification programs partially offset this by maintaining alternate certified sources and shortening disruption windows.

Regulatory and sustainability constraints
- Forestry certifications limit raw wood suppliers
- REACH/EPA compliance raises input costs
- Tighter rules = higher supplier leverage
- Long-term compliant vendors reduce disruption
Logistics and regional dependence
Inputs for Koppers are bulky and hazardous, so proximity and transport capacity are critical; port congestion or rail constraints can therefore give local suppliers leverage and delay feedstock deliveries. Freight surcharges and demurrage effectively raise delivered input prices, while regional inventory buffers reduce exposure to disruptions at the cost of higher carrying expenses. Suppliers near key terminals can extract premiums when rail or port throughput tightens.
Supplier power squeezes margins; 3–9 months qual cycles, commodity shocks
Supplier power is high due to concentrated specialty-chemical and certified-timber sources and long qualification cycles (3–9 months; $20k–$200k/SKU in 2024). Commodity volatility and transport (Brent ~$87/bbl; Baltic Dry ~1,800 in 2024) enable pass-throughs and margin pressure. Regulatory breadth (REACH ~22,000 substances in 2024) and hazardous handling raise entry costs; multi-year contracts and dual-qualification reduce but do not eliminate risk.
| Factor | 2024 metric | Impact |
|---|---|---|
| Commodity volatility | Brent ~$87/bbl | Cost pass-throughs |
| Freight | BDI ~1,800 | Delivered-price spikes |
| Certification | REACH ~22,000 subs | Fewer suppliers |
What is included in the product
 Detailed Word Document
Tailored exclusively for Koppers, this Porter's Five Forces analysis uncovers key competitive drivers, supplier and buyer power, entry barriers, substitutes, and disruptive threats to its market position.

 Customizable Excel Spreadsheet
Clear, one-sheet Porter's Five Forces for Koppers—customize pressure levels, swap in your own data, and visualize strategic risk instantly with a spider chart, ready to paste into decks or integrate with dashboards.
Customers Bargaining Power

High buyer concentration
Railroads, utilities and large industrials are sizable, sophisticated accounts; just 7 Class I railroads dominate U.S. freight and handle roughly 70% of rail tonnage, giving a few customers outsized leverage to dictate terms and service levels. Their volume drives negotiation power, and retention depends on measurable performance, reliability and total cost of ownership.
Long-term contracts and specs
Buyers often lock suppliers into multi-year agreements tied to AREMA standards, anchoring Koppers to rail-spec chemistry and testing protocols. These contracts stabilize demand but harden price and service expectations, with competitive tenders at 3–5 year renewal points periodically resetting pricing power. Meeting spec and delivery KPIs is essential for renewal and retention under these procurement cycles.

Price sensitivity vs life-cycle value
Customers trade upfront price for asset longevity and downtime risk; where failure costs are high—rail ties and poles—willingness to pay for premium treated products rises because downtime and replacement often exceed purchase cost by 5–10x, moderating price pressure in 2024 purchasing. In commoditized segments discounting intensifies, while demonstrated durability shifts procurement toward value-in-use metrics.

Limited backward integration
Railroads and utilities rarely bring chemical production or treatment in-house due to technical complexity and heavy regulation, keeping backward integration limited and capping disintermediation risk; US Class I railroads account for roughly 40% of freight ton-miles, reinforcing dependence on specialized suppliers like Koppers.
- Low backward integration risk
- Multi-sourcing possible, reallocates share
- Service, reliability defend margins
Substitution leverage
Customers can threaten to switch to concrete ties, steel or composite poles, or alternative chemical systems; even without large-scale adoption, credible alternatives in 2024 strengthen buyer leverage. Koppers defends with documented performance data and lifecycle-economics comparisons and leans on an active innovation pipeline to retain share.
- Substitution options raise bargaining power
- Koppers uses lifecycle economics evidence
- Innovation pipeline reduces churn
Class I concentration (~70% tonnage) drives 3-5yr tenders and premiums for durable, data-backed parts
Large accounts (7 Class I railroads) handle ~70% of U.S. rail tonnage, concentrating buyer leverage and driving strict KPIs and multi-year contracts (3–5 year tenders). High failure costs make buyers pay premiums for durability (replacement/downtime often 5–10x purchase). Substitutes (concrete/steel/composite) and multi-sourcing raise bargaining power; Koppers offsets with lifecycle data and innovation.
| Metric | 2024 Value |
|---|---|
| Class I railroads | 7 |
| Rail tonnage share | ~70% |
| Contract cadence | 3–5 yrs |
| Failure cost multiple | 5–10x |
What You See Is What You Get
Koppers Porter's Five Forces Analysis
This preview shows the exact Koppers Porter's Five Forces Analysis you'll receive—no samples or placeholders. It provides a full, professionally formatted assessment of competitive rivalry, supplier and buyer power, threats of entry and substitutes, and strategic implications. Purchase grants instant download of this identical file.

Don't Miss the Bigger Picture
Koppers faces moderate supplier power and substitution risk, while buyer concentration and regulatory hurdles shape competitive intensity—this snapshot highlights key tensions and strategic levers. The full Porter's Five Forces Analysis unpacks each force with force-by-force ratings, visuals, and actionable implications for investors and strategists. Unlock the complete report to make informed, data-driven decisions about Koppers’s market position.
Suppliers Bargaining Power
Concentrated raw material sources
Coal tar, copper-based biocides and certified timber come from concentrated upstreams—coal tar is a cokemaking byproduct tied to steel output (global crude steel was about 1,883 Mt in 2023 per World Steel Association), while specialty chemical and certified forest suppliers are limited, boosting supplier pricing leverage. Steel-cycle slowdowns can sharply curtail coal tar flows; Koppers offsets risk with multi-year supply contracts and geographic supplier diversification.
Input price volatility
Commodity-linked inputs such as coal tar, energy and freight swing with industrial cycles — Brent crude averaged about $87/bbl in 2024 and the Baltic Dry Index averaged near 1,800, allowing suppliers to pass through cost increases and squeeze margins when contracts lag. Hedging and pass-through clauses mitigate but remain imperfect, leaving Koppers exposed to price spikes. Volatility raises working capital needs and planning complexity, forcing tighter cash and inventory management.
Switching and qualification costs
Preservatives and carbon compounds require performance certification and process tuning, with qualification cycles commonly taking 3–9 months and validation/testing costs often ranging from $20,000–$200,000 per SKU in 2024. Switching suppliers entails testing, compliance and potential production risk, raising supplier stickiness and giving suppliers incremental leverage on specs and 8–12 week lead times. Dual-qualification programs partially offset this by maintaining alternate certified sources and shortening disruption windows.
Regulatory and sustainability constraints
- Forestry certifications limit raw wood suppliers
- REACH/EPA compliance raises input costs
- Tighter rules = higher supplier leverage
- Long-term compliant vendors reduce disruption
Logistics and regional dependence
Inputs for Koppers are bulky and hazardous, so proximity and transport capacity are critical; port congestion or rail constraints can therefore give local suppliers leverage and delay feedstock deliveries. Freight surcharges and demurrage effectively raise delivered input prices, while regional inventory buffers reduce exposure to disruptions at the cost of higher carrying expenses. Suppliers near key terminals can extract premiums when rail or port throughput tightens.
Supplier power squeezes margins; 3–9 months qual cycles, commodity shocks
Supplier power is high due to concentrated specialty-chemical and certified-timber sources and long qualification cycles (3–9 months; $20k–$200k/SKU in 2024). Commodity volatility and transport (Brent ~$87/bbl; Baltic Dry ~1,800 in 2024) enable pass-throughs and margin pressure. Regulatory breadth (REACH ~22,000 substances in 2024) and hazardous handling raise entry costs; multi-year contracts and dual-qualification reduce but do not eliminate risk.
| Factor | 2024 metric | Impact |
|---|---|---|
| Commodity volatility | Brent ~$87/bbl | Cost pass-throughs |
| Freight | BDI ~1,800 | Delivered-price spikes |
| Certification | REACH ~22,000 subs | Fewer suppliers |
What is included in the product
Detailed Word Document
Tailored exclusively for Koppers, this Porter's Five Forces analysis uncovers key competitive drivers, supplier and buyer power, entry barriers, substitutes, and disruptive threats to its market position.
Customizable Excel Spreadsheet
Clear, one-sheet Porter's Five Forces for Koppers—customize pressure levels, swap in your own data, and visualize strategic risk instantly with a spider chart, ready to paste into decks or integrate with dashboards.
Customers Bargaining Power
High buyer concentration
Railroads, utilities and large industrials are sizable, sophisticated accounts; just 7 Class I railroads dominate U.S. freight and handle roughly 70% of rail tonnage, giving a few customers outsized leverage to dictate terms and service levels. Their volume drives negotiation power, and retention depends on measurable performance, reliability and total cost of ownership.
Long-term contracts and specs
Buyers often lock suppliers into multi-year agreements tied to AREMA standards, anchoring Koppers to rail-spec chemistry and testing protocols. These contracts stabilize demand but harden price and service expectations, with competitive tenders at 3–5 year renewal points periodically resetting pricing power. Meeting spec and delivery KPIs is essential for renewal and retention under these procurement cycles.
Price sensitivity vs life-cycle value
Customers trade upfront price for asset longevity and downtime risk; where failure costs are high—rail ties and poles—willingness to pay for premium treated products rises because downtime and replacement often exceed purchase cost by 5–10x, moderating price pressure in 2024 purchasing. In commoditized segments discounting intensifies, while demonstrated durability shifts procurement toward value-in-use metrics.
Limited backward integration
Railroads and utilities rarely bring chemical production or treatment in-house due to technical complexity and heavy regulation, keeping backward integration limited and capping disintermediation risk; US Class I railroads account for roughly 40% of freight ton-miles, reinforcing dependence on specialized suppliers like Koppers.
- Low backward integration risk
- Multi-sourcing possible, reallocates share
- Service, reliability defend margins
Substitution leverage
Customers can threaten to switch to concrete ties, steel or composite poles, or alternative chemical systems; even without large-scale adoption, credible alternatives in 2024 strengthen buyer leverage. Koppers defends with documented performance data and lifecycle-economics comparisons and leans on an active innovation pipeline to retain share.
- Substitution options raise bargaining power
- Koppers uses lifecycle economics evidence
- Innovation pipeline reduces churn
Class I concentration (~70% tonnage) drives 3-5yr tenders and premiums for durable, data-backed parts
Large accounts (7 Class I railroads) handle ~70% of U.S. rail tonnage, concentrating buyer leverage and driving strict KPIs and multi-year contracts (3–5 year tenders). High failure costs make buyers pay premiums for durability (replacement/downtime often 5–10x purchase). Substitutes (concrete/steel/composite) and multi-sourcing raise bargaining power; Koppers offsets with lifecycle data and innovation.
| Metric | 2024 Value |
|---|---|
| Class I railroads | 7 |
| Rail tonnage share | ~70% |
| Contract cadence | 3–5 yrs |
| Failure cost multiple | 5–10x |
What You See Is What You Get
Koppers Porter's Five Forces Analysis
This preview shows the exact Koppers Porter's Five Forces Analysis you'll receive—no samples or placeholders. It provides a full, professionally formatted assessment of competitive rivalry, supplier and buyer power, threats of entry and substitutes, and strategic implications. Purchase grants instant download of this identical file.
Original: $10.00
-65%$10.00
$3.50Description
Don't Miss the Bigger Picture
Koppers faces moderate supplier power and substitution risk, while buyer concentration and regulatory hurdles shape competitive intensity—this snapshot highlights key tensions and strategic levers. The full Porter's Five Forces Analysis unpacks each force with force-by-force ratings, visuals, and actionable implications for investors and strategists. Unlock the complete report to make informed, data-driven decisions about Koppers’s market position.
Suppliers Bargaining Power
Concentrated raw material sources
Coal tar, copper-based biocides and certified timber come from concentrated upstreams—coal tar is a cokemaking byproduct tied to steel output (global crude steel was about 1,883 Mt in 2023 per World Steel Association), while specialty chemical and certified forest suppliers are limited, boosting supplier pricing leverage. Steel-cycle slowdowns can sharply curtail coal tar flows; Koppers offsets risk with multi-year supply contracts and geographic supplier diversification.
Input price volatility
Commodity-linked inputs such as coal tar, energy and freight swing with industrial cycles — Brent crude averaged about $87/bbl in 2024 and the Baltic Dry Index averaged near 1,800, allowing suppliers to pass through cost increases and squeeze margins when contracts lag. Hedging and pass-through clauses mitigate but remain imperfect, leaving Koppers exposed to price spikes. Volatility raises working capital needs and planning complexity, forcing tighter cash and inventory management.
Switching and qualification costs
Preservatives and carbon compounds require performance certification and process tuning, with qualification cycles commonly taking 3–9 months and validation/testing costs often ranging from $20,000–$200,000 per SKU in 2024. Switching suppliers entails testing, compliance and potential production risk, raising supplier stickiness and giving suppliers incremental leverage on specs and 8–12 week lead times. Dual-qualification programs partially offset this by maintaining alternate certified sources and shortening disruption windows.
Regulatory and sustainability constraints
- Forestry certifications limit raw wood suppliers
- REACH/EPA compliance raises input costs
- Tighter rules = higher supplier leverage
- Long-term compliant vendors reduce disruption
Logistics and regional dependence
Inputs for Koppers are bulky and hazardous, so proximity and transport capacity are critical; port congestion or rail constraints can therefore give local suppliers leverage and delay feedstock deliveries. Freight surcharges and demurrage effectively raise delivered input prices, while regional inventory buffers reduce exposure to disruptions at the cost of higher carrying expenses. Suppliers near key terminals can extract premiums when rail or port throughput tightens.
Supplier power squeezes margins; 3–9 months qual cycles, commodity shocks
Supplier power is high due to concentrated specialty-chemical and certified-timber sources and long qualification cycles (3–9 months; $20k–$200k/SKU in 2024). Commodity volatility and transport (Brent ~$87/bbl; Baltic Dry ~1,800 in 2024) enable pass-throughs and margin pressure. Regulatory breadth (REACH ~22,000 substances in 2024) and hazardous handling raise entry costs; multi-year contracts and dual-qualification reduce but do not eliminate risk.
| Factor | 2024 metric | Impact |
|---|---|---|
| Commodity volatility | Brent ~$87/bbl | Cost pass-throughs |
| Freight | BDI ~1,800 | Delivered-price spikes |
| Certification | REACH ~22,000 subs | Fewer suppliers |
What is included in the product
Detailed Word Document
Tailored exclusively for Koppers, this Porter's Five Forces analysis uncovers key competitive drivers, supplier and buyer power, entry barriers, substitutes, and disruptive threats to its market position.
Customizable Excel Spreadsheet
Clear, one-sheet Porter's Five Forces for Koppers—customize pressure levels, swap in your own data, and visualize strategic risk instantly with a spider chart, ready to paste into decks or integrate with dashboards.
Customers Bargaining Power
High buyer concentration
Railroads, utilities and large industrials are sizable, sophisticated accounts; just 7 Class I railroads dominate U.S. freight and handle roughly 70% of rail tonnage, giving a few customers outsized leverage to dictate terms and service levels. Their volume drives negotiation power, and retention depends on measurable performance, reliability and total cost of ownership.
Long-term contracts and specs
Buyers often lock suppliers into multi-year agreements tied to AREMA standards, anchoring Koppers to rail-spec chemistry and testing protocols. These contracts stabilize demand but harden price and service expectations, with competitive tenders at 3–5 year renewal points periodically resetting pricing power. Meeting spec and delivery KPIs is essential for renewal and retention under these procurement cycles.
Price sensitivity vs life-cycle value
Customers trade upfront price for asset longevity and downtime risk; where failure costs are high—rail ties and poles—willingness to pay for premium treated products rises because downtime and replacement often exceed purchase cost by 5–10x, moderating price pressure in 2024 purchasing. In commoditized segments discounting intensifies, while demonstrated durability shifts procurement toward value-in-use metrics.
Limited backward integration
Railroads and utilities rarely bring chemical production or treatment in-house due to technical complexity and heavy regulation, keeping backward integration limited and capping disintermediation risk; US Class I railroads account for roughly 40% of freight ton-miles, reinforcing dependence on specialized suppliers like Koppers.
- Low backward integration risk
- Multi-sourcing possible, reallocates share
- Service, reliability defend margins
Substitution leverage
Customers can threaten to switch to concrete ties, steel or composite poles, or alternative chemical systems; even without large-scale adoption, credible alternatives in 2024 strengthen buyer leverage. Koppers defends with documented performance data and lifecycle-economics comparisons and leans on an active innovation pipeline to retain share.
- Substitution options raise bargaining power
- Koppers uses lifecycle economics evidence
- Innovation pipeline reduces churn
Class I concentration (~70% tonnage) drives 3-5yr tenders and premiums for durable, data-backed parts
Large accounts (7 Class I railroads) handle ~70% of U.S. rail tonnage, concentrating buyer leverage and driving strict KPIs and multi-year contracts (3–5 year tenders). High failure costs make buyers pay premiums for durability (replacement/downtime often 5–10x purchase). Substitutes (concrete/steel/composite) and multi-sourcing raise bargaining power; Koppers offsets with lifecycle data and innovation.
| Metric | 2024 Value |
|---|---|
| Class I railroads | 7 |
| Rail tonnage share | ~70% |
| Contract cadence | 3–5 yrs |
| Failure cost multiple | 5–10x |
What You See Is What You Get
Koppers Porter's Five Forces Analysis
This preview shows the exact Koppers Porter's Five Forces Analysis you'll receive—no samples or placeholders. It provides a full, professionally formatted assessment of competitive rivalry, supplier and buyer power, threats of entry and substitutes, and strategic implications. Purchase grants instant download of this identical file.











