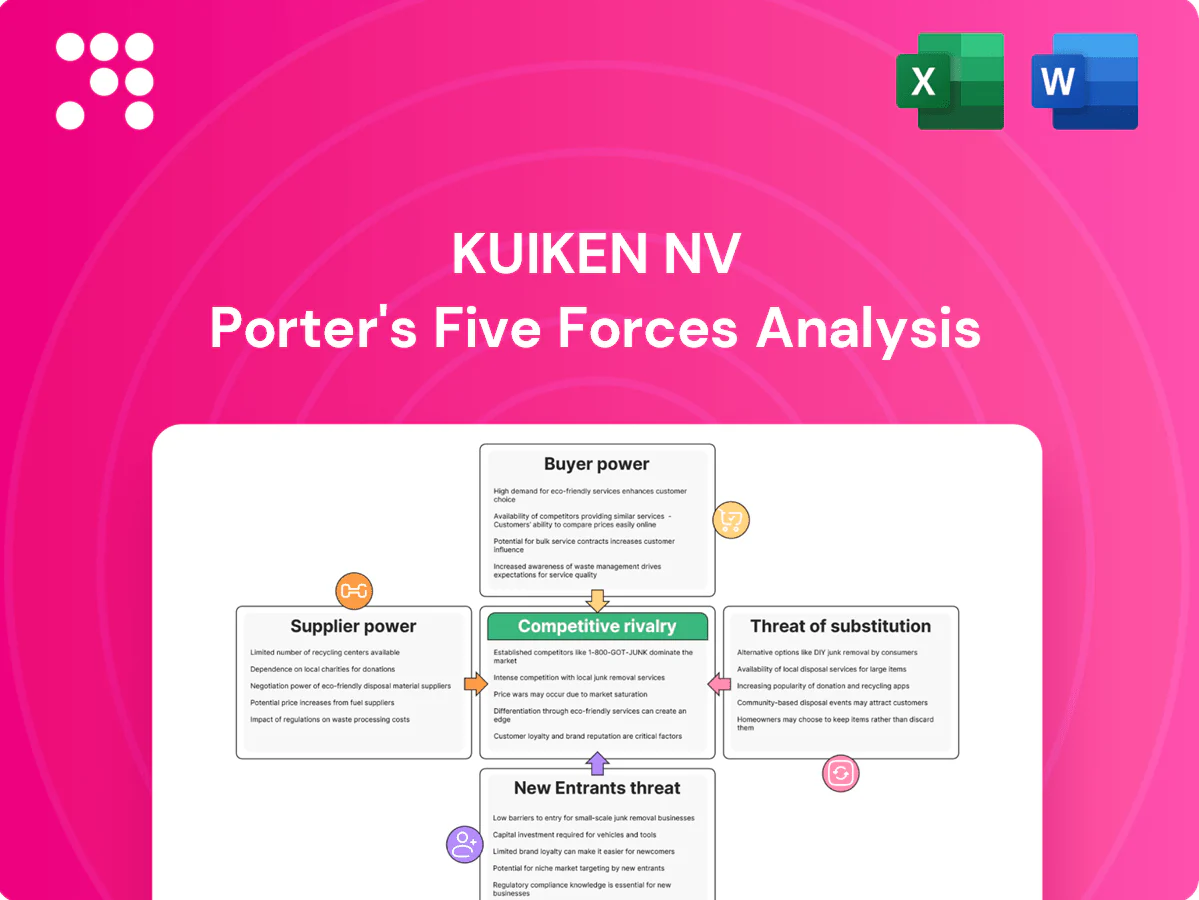
Kuiken NV Porter's Five Forces Analysis

From Overview to Strategy Blueprint
Kuiken NV faces a nuanced competitive landscape where supplier bargaining, buyer price sensitivity, and niche substitutes shape margins, while entry barriers and rival intensity determine growth prospects. This snapshot highlights key pressure points and strategic levers that management and investors should monitor. Unlock the full Porter's Five Forces Analysis to access force-by-force ratings, visuals, and actionable recommendations tailored to Kuiken NV.
Suppliers Bargaining Power

OEM exclusivity concentration
Kuiken relies on major OEMs such as Volvo CE and Sennebogen that grant territorial exclusivity, concentrating supplier power and limiting alternative sourcing for key equipment lines.
Exclusive dealer contracts typically impose volume commitments, branding and service standards that favor the OEM and constrain Kuiken’s pricing and aftersales strategies.
Any termination or reallocation of territories would materially reduce product breadth and margins and raises switching costs to alternative brands through retraining, parts inventory and customer re-entry barriers.
Limited equivalent alternatives
High-spec construction and material-handling lines have few like-for-like substitutes at scale in NL/BE, and in 2024 dealers maintain tight ties to top-tier OEMs due to superior quality, higher residual values, and fleet commonality. Limited alternative supply options increase supplier leverage over pricing and allocation. Niche manufacturers rarely replace flagship lines, keeping bargaining power concentrated with leading OEMs.

Parts, software, and telematics lock-in
OEM-controlled parts catalogs, diagnostics, and telematics platforms create post-sale dependence for Kuiken NV, with commercial fleet telematics penetration above 70% in 2024, reinforcing OEM leverage. Access fees, certification, and tooling requirements compress dealer margins and raise service costs. Restrictive IP and data-access terms further boost OEM bargaining power as customers demand OEM-backed uptime.

Allocation, lead times, and currency
Global supply swings let OEMs ration units, steering dealer mix and premiums; allocation prioritisation often links to compliance and dealer performance metrics. Long lead times remain above pre‑pandemic norms, forcing dealers into higher working‑capital and floor‑plan use. Euro exposure matters: EUR/USD averaged ~1.08 in H1 2024, shifting OEM cost bases and squeezing gross margins.
- Allocation tied to compliance/performance
- Long lead times → working-capital strain
- OEM rationing affects pricing/mix
- EUR/USD ~1.08 H1 2024 impacts margins
Co-op marketing and warranty terms
OEMs control co-op funding and warranty policy levers that shape dealer go-to-market economics; in 2024 co-op programs typically covered 50-75% of approved local advertising spend, while warranty reimbursement approval rates commonly ranged 70-90%, directly affecting service profitability. Program adherence and claim audits steer dealer behavior, creating soft power that raises supplier bargaining strength.
- Co-op funding: 50-75% of approved ad spend
- Warranty reimbursements: 70-90% approval range
- Adherence enforcement: used to influence dealer operations
- Net effect: increased supplier bargaining power
OEM exclusivity and >70% telematics penetration squeeze margins, raise working capital
Kuiken depends on OEMs (Volvo CE, Sennebogen) whose territorial exclusivity concentrates supplier power and limits alternative sourcing.
OEMs control parts, diagnostics and telematics; telematics penetration >70% in 2024, co-op funding covers 50-75% of approved ad spend and warranty approvals run 70-90%.
EUR/USD ~1.08 H1 2024 and OEM allocation/long lead times compress margins and raise working-capital needs.
| Metric | 2024 |
|---|---|
| Telematics penetration | >70% |
| Co-op funding | 50-75% of approved spend |
| Warranty approvals | 70-90% |
| EUR/USD H1 | ~1.08 |
What is included in the product
 Detailed Word Document
Tailored Porter's Five Forces analysis for Kuiken NV uncovering competitive rivalry, buyer and supplier power, substitution risks, and barriers to entry, with strategic commentary on disruptive threats and pricing leverage to inform investor materials and internal strategy.

 Customizable Excel Spreadsheet
One-sheet Porter's Five Forces for Kuiken NV that visualizes competitive pressure with an editable spider chart, lets you swap in current data, requires no macros, and drops straight into pitch decks or reports.
Customers Bargaining Power

Large fleet buyers and tenders
Construction majors, municipalities and ag co-ops aggregate volume into competitive tenders—contracts often exceed €1M—and drive price pressure via framework agreements that commonly compress margins by 5–12% in exchange for share. Buyers demand uptime SLAs of 98–99% and multi-year service terms; Kuiken must defend pricing through demonstrable uptime, preventive maintenance and 10–20% lifecycle cost savings to protect margins.
Rental as leverage
Buyers increasingly toggle between purchase and rental to conserve capex and extract better terms, with rental penetration rising to about 25% in Europe by 2024, boosting negotiating leverage. Wide availability from generalist renters amplifies price comparisons and short-term offers depress utilization and day rates. Short-term rental options force tighter margins on day rates and utilization assumptions. Kuiken’s own rental fleet cushions loss of sales but still strengthens buyer power.

High TCO sensitivity
Customers prioritize fuel (up to 40% of operating cost), maintenance (~25%), residual value and operator productivity when assessing TCO; transparent TCO tools make price differences fully visible and negotiable. Extended warranties and service contracts are table stakes, appearing in over 70% of fleet purchases. Buyers routinely use TCO to demand 5–15% price concessions or added services.

Switching costs yet multi-sourcing
Attachments, telematics, and operator familiarity create real switching frictions for Kuiken NV, increasing retention by tying equipment and workflows together in 2024.
However, many fleets dual-source across brands to hedge supply and price risk, preserving partial switching ability and sustaining customer bargaining leverage.
Kuiken must maintain parts availability and operator training to lock in usage and protect margins.
- Switching frictions: attachments, telematics, familiarity
- Dual-sourcing: fleets hedge across brands
- Defensive moves: parts availability, training, uptime focus
Seasonality and project cyclicality
Ag seasons and construction cycles drive demand spikes and lulls for Kuiken NV, with peak months concentrating >40% of annual project activity in spring/summer; during slow quarters buyers press for better pricing and deferred payments, and project delays often cause cancellations or renegotiations, raising buyer leverage on timing and price.
- Seasonal peaks concentrate demand
- Buyers seek deferred payments in slow quarters
- Delays → cancellations/renegotiations
- Volatility raises negotiating power
Buyers force 5-12% margin cuts; demand 98-99% uptime
Buyers (rental penetration ~25% in Europe 2024) exert strong price pressure via >€1M tenders and framework deals that cut margins 5–12% while demanding 98–99% uptime. TCO transparency (fuel ~40%, maintenance ~25%) drives 5–15% concessions; >70% purchases include service/warranty. Switching frictions (attachments, telematics) raise retention but dual-sourcing keeps buyer leverage.
| Metric | 2024 |
|---|---|
| Rental penetration | 25% |
| Uptime SLA | 98–99% |
| Margin pressure | 5–12% |
Preview Before You Purchase
Kuiken NV Porter's Five Forces Analysis
This preview shows the exact Kuiken NV Porter's Five Forces Analysis you'll receive immediately after purchase—no surprises, no placeholders. The document is professionally written and fully formatted, ready for download and use the moment you buy. You're viewing the final deliverable; purchase grants instant access to this same file.

From Overview to Strategy Blueprint
Kuiken NV faces a nuanced competitive landscape where supplier bargaining, buyer price sensitivity, and niche substitutes shape margins, while entry barriers and rival intensity determine growth prospects. This snapshot highlights key pressure points and strategic levers that management and investors should monitor. Unlock the full Porter's Five Forces Analysis to access force-by-force ratings, visuals, and actionable recommendations tailored to Kuiken NV.
Suppliers Bargaining Power
OEM exclusivity concentration
Kuiken relies on major OEMs such as Volvo CE and Sennebogen that grant territorial exclusivity, concentrating supplier power and limiting alternative sourcing for key equipment lines.
Exclusive dealer contracts typically impose volume commitments, branding and service standards that favor the OEM and constrain Kuiken’s pricing and aftersales strategies.
Any termination or reallocation of territories would materially reduce product breadth and margins and raises switching costs to alternative brands through retraining, parts inventory and customer re-entry barriers.
Limited equivalent alternatives
High-spec construction and material-handling lines have few like-for-like substitutes at scale in NL/BE, and in 2024 dealers maintain tight ties to top-tier OEMs due to superior quality, higher residual values, and fleet commonality. Limited alternative supply options increase supplier leverage over pricing and allocation. Niche manufacturers rarely replace flagship lines, keeping bargaining power concentrated with leading OEMs.
Parts, software, and telematics lock-in
OEM-controlled parts catalogs, diagnostics, and telematics platforms create post-sale dependence for Kuiken NV, with commercial fleet telematics penetration above 70% in 2024, reinforcing OEM leverage. Access fees, certification, and tooling requirements compress dealer margins and raise service costs. Restrictive IP and data-access terms further boost OEM bargaining power as customers demand OEM-backed uptime.
Allocation, lead times, and currency
Global supply swings let OEMs ration units, steering dealer mix and premiums; allocation prioritisation often links to compliance and dealer performance metrics. Long lead times remain above pre‑pandemic norms, forcing dealers into higher working‑capital and floor‑plan use. Euro exposure matters: EUR/USD averaged ~1.08 in H1 2024, shifting OEM cost bases and squeezing gross margins.
- Allocation tied to compliance/performance
- Long lead times → working-capital strain
- OEM rationing affects pricing/mix
- EUR/USD ~1.08 H1 2024 impacts margins
Co-op marketing and warranty terms
OEMs control co-op funding and warranty policy levers that shape dealer go-to-market economics; in 2024 co-op programs typically covered 50-75% of approved local advertising spend, while warranty reimbursement approval rates commonly ranged 70-90%, directly affecting service profitability. Program adherence and claim audits steer dealer behavior, creating soft power that raises supplier bargaining strength.
- Co-op funding: 50-75% of approved ad spend
- Warranty reimbursements: 70-90% approval range
- Adherence enforcement: used to influence dealer operations
- Net effect: increased supplier bargaining power
OEM exclusivity and >70% telematics penetration squeeze margins, raise working capital
Kuiken depends on OEMs (Volvo CE, Sennebogen) whose territorial exclusivity concentrates supplier power and limits alternative sourcing.
OEMs control parts, diagnostics and telematics; telematics penetration >70% in 2024, co-op funding covers 50-75% of approved ad spend and warranty approvals run 70-90%.
EUR/USD ~1.08 H1 2024 and OEM allocation/long lead times compress margins and raise working-capital needs.
| Metric | 2024 |
|---|---|
| Telematics penetration | >70% |
| Co-op funding | 50-75% of approved spend |
| Warranty approvals | 70-90% |
| EUR/USD H1 | ~1.08 |
What is included in the product
Detailed Word Document
Tailored Porter's Five Forces analysis for Kuiken NV uncovering competitive rivalry, buyer and supplier power, substitution risks, and barriers to entry, with strategic commentary on disruptive threats and pricing leverage to inform investor materials and internal strategy.
Customizable Excel Spreadsheet
One-sheet Porter's Five Forces for Kuiken NV that visualizes competitive pressure with an editable spider chart, lets you swap in current data, requires no macros, and drops straight into pitch decks or reports.
Customers Bargaining Power
Large fleet buyers and tenders
Construction majors, municipalities and ag co-ops aggregate volume into competitive tenders—contracts often exceed €1M—and drive price pressure via framework agreements that commonly compress margins by 5–12% in exchange for share. Buyers demand uptime SLAs of 98–99% and multi-year service terms; Kuiken must defend pricing through demonstrable uptime, preventive maintenance and 10–20% lifecycle cost savings to protect margins.
Rental as leverage
Buyers increasingly toggle between purchase and rental to conserve capex and extract better terms, with rental penetration rising to about 25% in Europe by 2024, boosting negotiating leverage. Wide availability from generalist renters amplifies price comparisons and short-term offers depress utilization and day rates. Short-term rental options force tighter margins on day rates and utilization assumptions. Kuiken’s own rental fleet cushions loss of sales but still strengthens buyer power.
High TCO sensitivity
Customers prioritize fuel (up to 40% of operating cost), maintenance (~25%), residual value and operator productivity when assessing TCO; transparent TCO tools make price differences fully visible and negotiable. Extended warranties and service contracts are table stakes, appearing in over 70% of fleet purchases. Buyers routinely use TCO to demand 5–15% price concessions or added services.
Switching costs yet multi-sourcing
Attachments, telematics, and operator familiarity create real switching frictions for Kuiken NV, increasing retention by tying equipment and workflows together in 2024.
However, many fleets dual-source across brands to hedge supply and price risk, preserving partial switching ability and sustaining customer bargaining leverage.
Kuiken must maintain parts availability and operator training to lock in usage and protect margins.
- Switching frictions: attachments, telematics, familiarity
- Dual-sourcing: fleets hedge across brands
- Defensive moves: parts availability, training, uptime focus
Seasonality and project cyclicality
Ag seasons and construction cycles drive demand spikes and lulls for Kuiken NV, with peak months concentrating >40% of annual project activity in spring/summer; during slow quarters buyers press for better pricing and deferred payments, and project delays often cause cancellations or renegotiations, raising buyer leverage on timing and price.
- Seasonal peaks concentrate demand
- Buyers seek deferred payments in slow quarters
- Delays → cancellations/renegotiations
- Volatility raises negotiating power
Buyers force 5-12% margin cuts; demand 98-99% uptime
Buyers (rental penetration ~25% in Europe 2024) exert strong price pressure via >€1M tenders and framework deals that cut margins 5–12% while demanding 98–99% uptime. TCO transparency (fuel ~40%, maintenance ~25%) drives 5–15% concessions; >70% purchases include service/warranty. Switching frictions (attachments, telematics) raise retention but dual-sourcing keeps buyer leverage.
| Metric | 2024 |
|---|---|
| Rental penetration | 25% |
| Uptime SLA | 98–99% |
| Margin pressure | 5–12% |
Preview Before You Purchase
Kuiken NV Porter's Five Forces Analysis
This preview shows the exact Kuiken NV Porter's Five Forces Analysis you'll receive immediately after purchase—no surprises, no placeholders. The document is professionally written and fully formatted, ready for download and use the moment you buy. You're viewing the final deliverable; purchase grants instant access to this same file.
Description
From Overview to Strategy Blueprint
Kuiken NV faces a nuanced competitive landscape where supplier bargaining, buyer price sensitivity, and niche substitutes shape margins, while entry barriers and rival intensity determine growth prospects. This snapshot highlights key pressure points and strategic levers that management and investors should monitor. Unlock the full Porter's Five Forces Analysis to access force-by-force ratings, visuals, and actionable recommendations tailored to Kuiken NV.
Suppliers Bargaining Power
OEM exclusivity concentration
Kuiken relies on major OEMs such as Volvo CE and Sennebogen that grant territorial exclusivity, concentrating supplier power and limiting alternative sourcing for key equipment lines.
Exclusive dealer contracts typically impose volume commitments, branding and service standards that favor the OEM and constrain Kuiken’s pricing and aftersales strategies.
Any termination or reallocation of territories would materially reduce product breadth and margins and raises switching costs to alternative brands through retraining, parts inventory and customer re-entry barriers.
Limited equivalent alternatives
High-spec construction and material-handling lines have few like-for-like substitutes at scale in NL/BE, and in 2024 dealers maintain tight ties to top-tier OEMs due to superior quality, higher residual values, and fleet commonality. Limited alternative supply options increase supplier leverage over pricing and allocation. Niche manufacturers rarely replace flagship lines, keeping bargaining power concentrated with leading OEMs.
Parts, software, and telematics lock-in
OEM-controlled parts catalogs, diagnostics, and telematics platforms create post-sale dependence for Kuiken NV, with commercial fleet telematics penetration above 70% in 2024, reinforcing OEM leverage. Access fees, certification, and tooling requirements compress dealer margins and raise service costs. Restrictive IP and data-access terms further boost OEM bargaining power as customers demand OEM-backed uptime.
Allocation, lead times, and currency
Global supply swings let OEMs ration units, steering dealer mix and premiums; allocation prioritisation often links to compliance and dealer performance metrics. Long lead times remain above pre‑pandemic norms, forcing dealers into higher working‑capital and floor‑plan use. Euro exposure matters: EUR/USD averaged ~1.08 in H1 2024, shifting OEM cost bases and squeezing gross margins.
- Allocation tied to compliance/performance
- Long lead times → working-capital strain
- OEM rationing affects pricing/mix
- EUR/USD ~1.08 H1 2024 impacts margins
Co-op marketing and warranty terms
OEMs control co-op funding and warranty policy levers that shape dealer go-to-market economics; in 2024 co-op programs typically covered 50-75% of approved local advertising spend, while warranty reimbursement approval rates commonly ranged 70-90%, directly affecting service profitability. Program adherence and claim audits steer dealer behavior, creating soft power that raises supplier bargaining strength.
- Co-op funding: 50-75% of approved ad spend
- Warranty reimbursements: 70-90% approval range
- Adherence enforcement: used to influence dealer operations
- Net effect: increased supplier bargaining power
OEM exclusivity and >70% telematics penetration squeeze margins, raise working capital
Kuiken depends on OEMs (Volvo CE, Sennebogen) whose territorial exclusivity concentrates supplier power and limits alternative sourcing.
OEMs control parts, diagnostics and telematics; telematics penetration >70% in 2024, co-op funding covers 50-75% of approved ad spend and warranty approvals run 70-90%.
EUR/USD ~1.08 H1 2024 and OEM allocation/long lead times compress margins and raise working-capital needs.
| Metric | 2024 |
|---|---|
| Telematics penetration | >70% |
| Co-op funding | 50-75% of approved spend |
| Warranty approvals | 70-90% |
| EUR/USD H1 | ~1.08 |
What is included in the product
Detailed Word Document
Tailored Porter's Five Forces analysis for Kuiken NV uncovering competitive rivalry, buyer and supplier power, substitution risks, and barriers to entry, with strategic commentary on disruptive threats and pricing leverage to inform investor materials and internal strategy.
Customizable Excel Spreadsheet
One-sheet Porter's Five Forces for Kuiken NV that visualizes competitive pressure with an editable spider chart, lets you swap in current data, requires no macros, and drops straight into pitch decks or reports.
Customers Bargaining Power
Large fleet buyers and tenders
Construction majors, municipalities and ag co-ops aggregate volume into competitive tenders—contracts often exceed €1M—and drive price pressure via framework agreements that commonly compress margins by 5–12% in exchange for share. Buyers demand uptime SLAs of 98–99% and multi-year service terms; Kuiken must defend pricing through demonstrable uptime, preventive maintenance and 10–20% lifecycle cost savings to protect margins.
Rental as leverage
Buyers increasingly toggle between purchase and rental to conserve capex and extract better terms, with rental penetration rising to about 25% in Europe by 2024, boosting negotiating leverage. Wide availability from generalist renters amplifies price comparisons and short-term offers depress utilization and day rates. Short-term rental options force tighter margins on day rates and utilization assumptions. Kuiken’s own rental fleet cushions loss of sales but still strengthens buyer power.
High TCO sensitivity
Customers prioritize fuel (up to 40% of operating cost), maintenance (~25%), residual value and operator productivity when assessing TCO; transparent TCO tools make price differences fully visible and negotiable. Extended warranties and service contracts are table stakes, appearing in over 70% of fleet purchases. Buyers routinely use TCO to demand 5–15% price concessions or added services.
Switching costs yet multi-sourcing
Attachments, telematics, and operator familiarity create real switching frictions for Kuiken NV, increasing retention by tying equipment and workflows together in 2024.
However, many fleets dual-source across brands to hedge supply and price risk, preserving partial switching ability and sustaining customer bargaining leverage.
Kuiken must maintain parts availability and operator training to lock in usage and protect margins.
- Switching frictions: attachments, telematics, familiarity
- Dual-sourcing: fleets hedge across brands
- Defensive moves: parts availability, training, uptime focus
Seasonality and project cyclicality
Ag seasons and construction cycles drive demand spikes and lulls for Kuiken NV, with peak months concentrating >40% of annual project activity in spring/summer; during slow quarters buyers press for better pricing and deferred payments, and project delays often cause cancellations or renegotiations, raising buyer leverage on timing and price.
- Seasonal peaks concentrate demand
- Buyers seek deferred payments in slow quarters
- Delays → cancellations/renegotiations
- Volatility raises negotiating power
Buyers force 5-12% margin cuts; demand 98-99% uptime
Buyers (rental penetration ~25% in Europe 2024) exert strong price pressure via >€1M tenders and framework deals that cut margins 5–12% while demanding 98–99% uptime. TCO transparency (fuel ~40%, maintenance ~25%) drives 5–15% concessions; >70% purchases include service/warranty. Switching frictions (attachments, telematics) raise retention but dual-sourcing keeps buyer leverage.
| Metric | 2024 |
|---|---|
| Rental penetration | 25% |
| Uptime SLA | 98–99% |
| Margin pressure | 5–12% |
Preview Before You Purchase
Kuiken NV Porter's Five Forces Analysis
This preview shows the exact Kuiken NV Porter's Five Forces Analysis you'll receive immediately after purchase—no surprises, no placeholders. The document is professionally written and fully formatted, ready for download and use the moment you buy. You're viewing the final deliverable; purchase grants instant access to this same file.











