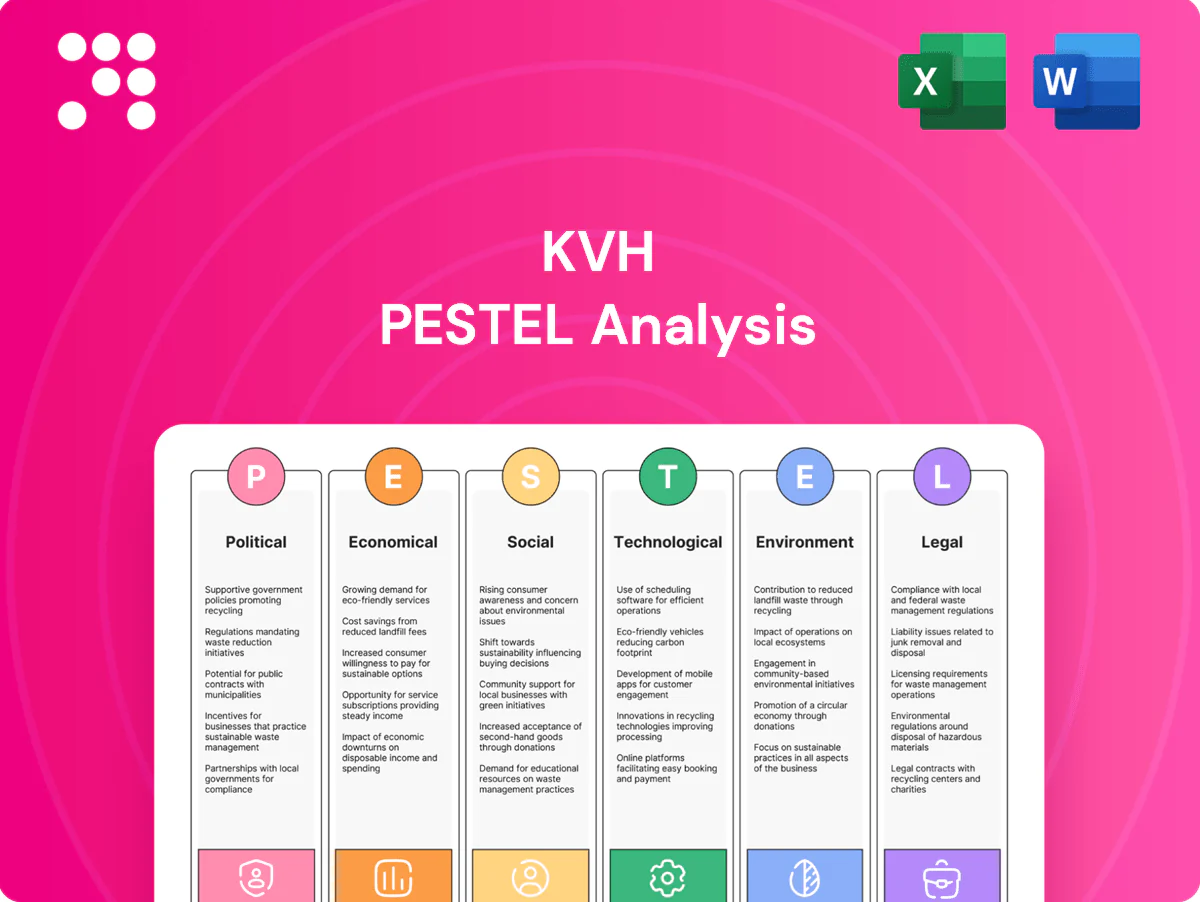
KVH PESTLE Analysis

Plan Smarter. Present Sharper. Compete Stronger.
Unlock strategic advantage with our PESTLE analysis of KVH—revealing how political, economic, social, technological, legal, and environmental forces shape its trajectory. Use these expert insights to forecast risks and spot growth opportunities. Purchase the full report for a detailed, actionable breakdown you can deploy immediately.
Political factors

Defense procurement and budget priorities
Defense spending cycles drive demand for navigation and satcom in military programs, with global military expenditure at $2.24 trillion in 2023 (SIPRI), influencing timing and scale of buys for suppliers like KVH.
Procurement preferences for domestic sourcing and industrial offsets can advantage local OEMs or exclude KVH from key bids unless partnerships or local production are in place.
Rising geopolitical risk can trigger urgent procurements or stall planned upgrades; stable multi-year contracts reduce revenue volatility but depend on policy continuity and budget commitments.
Spectrum allocation and satellite policy
National and international regulators, including 193 ITU members and 175 IMO members, allocate maritime satcom spectrum and license terminals, directly shaping KVH service footprints. Shifts in C/Ku/Ka band policy or interference rules force changes to equipment roadmaps and QoS commitments. Harmonized rules ease global deployment; fragmentation raises compliance and certification costs. Active advocacy at ITU/IMO safeguards long-term capacity access.

Geopolitical tensions and trade routes
Conflicts and piracy alter shipping lanes and connectivity demand profiles; about 80% of global trade by volume moves by sea, concentrating traffic through chokepoints. Port access restrictions and naval escorts shift KVH coverage priorities and raise OPEX. Elevated risk zones—the Strait of Hormuz transits roughly 20% of global oil—boost demand for resilient comms and ISR-grade navigation. Prolonged tensions can disrupt installations and logistics.

Sanctions and export controls
ITAR and EAR restrict exports of defense-grade gyros and maritime communications, constraining KVH sales to sanctioned entities; OFAC's SDN list exceeded 9,000 entries in 2024, increasing screening scope; licensing can add weeks to months to sales cycles and shrink addressable markets; re-export rules force global distributor compliance and controlled supply chains are essential.
- ITAR/EAR constraints
- OFAC SDN >9,000 (2024)
- Licensing delays extend sales cycles
- Re-export rules affect partners
- Robust screening and controlled supply chains
Public maritime and digital policies
Government pushes for maritime digitalization and safety—reinforced by IMO and regional e-navigation/GMDSS modernization efforts in 2024—can effectively mandate vessel connectivity, benefiting vendors like KVH as the global merchant fleet (~55,000 ships per UNCTAD 2024) upgrades systems.
- Mandates favor equipped vendors
- Public-private grants accelerate upgrades
- GMDSS/e-navigation focus boosts remote monitoring demand
- Policy reversals risk stalling procurement
Defense spending, export controls and maritime rules reshape resilient communications demand
Defense spending cycles (global military expenditure $2.24T in 2023) and procurement localization shape demand and access for KVH, while ITAR/EAR and OFAC (SDN >9,000 in 2024) constrain sales and lengthen licensing timelines. Maritime mandates (UNCTAD fleet ~55,000 ships; ~80% of global trade by volume moved by sea) and IMO/ITU rules drive equipment adoption but regulatory fragmentation raises compliance costs. Geopolitical hotspots (Strait of Hormuz ~20% of oil transits) shift coverage and OPEX toward resilient comms.
| Factor | Key Metric | Impact |
|---|---|---|
| Defense spend | $2.24T (2023) | Demand timing/scale |
| Regulation | OFAC SDN >9,000 (2024) | Export controls, delays |
| Maritime market | ~55,000 ships; ~80% trade | Fleet upgrades |
| Chokepoints | Hormuz ~20% oil | Resilient comms demand |
What is included in the product
 Detailed Word Document
Explores how Political, Economic, Social, Technological, Environmental and Legal factors uniquely impact KVH, with data-backed trends and detailed sub-points tailored to its industry and region. Designed for executives and investors, it offers forward‑looking insights and ready-to-use formatting for reports, pitches, and scenario planning.

 Customizable Excel Spreadsheet
Concise, visually segmented KVH PESTLE summary ideal for slides or strategy packs—editable for region or business-line notes, easily shareable for quick team alignment, and built to support risk discussions and consultant reports.
Economic factors

Global shipping cycle and fleet capex
Freight rates and vessel utilization—reflected in the Baltic Dry Index near 1,400 mid-2025—directly determine ship operators’ VSAT and sensor budgets; strong cycles spur retrofit programs while weak cycles defer purchases. Newbuild activity, with the global orderbook around 6–8% of fleet in 2024, shapes OEM install opportunities. KVH’s recurring service revenue cushions hardware cyclicality but still tracks fleet economics.
Component costs and supply chain
Semiconductor and optical component pricing directly compress margins on KVH terminals and gyro products, with semiconductor lead times averaging about 15 weeks in 2024 (IHS Markit), which has kept spot prices elevated. Lead-time volatility delays deliveries and revenue recognition, while multi-sourcing and design-for-availability mitigate supplier concentration risk. Strict inventory discipline balances service levels against cash tied in stock.

Currency and interest rate dynamics
USD strength (DXY ~103 in mid‑2025) raises international pricing and compresses reported non‑USD revenue, while elevated US policy rates (fed funds 5.25–5.50%) and 10‑yr yields near 4.0% push customers’ borrowing costs higher, delaying capex for connectivity upgrades. FX hedging reduces volatility but typically costs 50–150 bps and adds balance‑sheet complexity. High subscription revenue model—now >50% recurring—helps smooth cash flows across rate and FX cycles.

Competitive pricing and ARPU pressure
LEO entrants, led by Starlink (over 4,000 satellites in orbit by 2024), intensify price competition for maritime broadband and compress ARPU as operators push lower-cost plans.
Bundled content and data plans are needed to defend ARPU and limit churn; differentiation through wider coverage, uptime SLAs and premium support sustains value, while lower-cost terminals expand the mid-market.
- LEO capacity: >4,000 Starlink sats (2024)
- ARPU pressure: need bundles to reduce churn
- Differentiation: SLAs, support, coverage
- Mid-market growth: cost-efficient terminals
Defense and government funding stability
Continuing resolutions and protracted budget debates can delay U.S. awards and procurement timing despite a FY2024 U.S. defense topline near $858 billion, creating revenue timing risk for KVH. Once funded, multi-year programs provide multi-year visibility and contract stability. Foreign Military Sales drive incremental demand but are timing-sensitive and subject to geopolitical shifts. Regional diversification lowers concentration risk across program cycles.
- Continuing resolutions: delays to awards
- FY2024 U.S. defense topline ~858 billion
- Multi-year programs: improved visibility
- FMS: timing-sensitive demand
- Diversification: reduces concentration risk
Defense spending, export controls and maritime rules reshape resilient communications demand
Freight cycles (BDI ~1,400 mid‑2025) and a 2024 orderbook ~6–8% drive VSAT retrofit timing and new OEM installs; >50% subscription revenue cushions hardware cyclicality. Semiconductor lead times ~15 weeks (2024) and Starlink >4,000 sats (2024) compress margins and ARPU; USD ~103 and Fed funds 5.25–5.50% raise customer capex costs.
| Metric | Value |
|---|---|
| BDI | ~1,400 (mid‑2025) |
| Orderbook | 6–8% (2024) |
| Semiconductor LT | ~15 wks (2024) |
| USD/DXY | ~103 (mid‑2025) |
What You See Is What You Get
KVH PESTLE Analysis
The KVH PESTLE Analysis preview shown here is the exact document you’ll receive after purchase—fully formatted, professionally structured, and ready to use. This is a real snapshot of the product with no placeholders or teasers. After payment you’ll instantly download the same finished file as displayed.

Plan Smarter. Present Sharper. Compete Stronger.
Unlock strategic advantage with our PESTLE analysis of KVH—revealing how political, economic, social, technological, legal, and environmental forces shape its trajectory. Use these expert insights to forecast risks and spot growth opportunities. Purchase the full report for a detailed, actionable breakdown you can deploy immediately.
Political factors
Defense procurement and budget priorities
Defense spending cycles drive demand for navigation and satcom in military programs, with global military expenditure at $2.24 trillion in 2023 (SIPRI), influencing timing and scale of buys for suppliers like KVH.
Procurement preferences for domestic sourcing and industrial offsets can advantage local OEMs or exclude KVH from key bids unless partnerships or local production are in place.
Rising geopolitical risk can trigger urgent procurements or stall planned upgrades; stable multi-year contracts reduce revenue volatility but depend on policy continuity and budget commitments.
Spectrum allocation and satellite policy
National and international regulators, including 193 ITU members and 175 IMO members, allocate maritime satcom spectrum and license terminals, directly shaping KVH service footprints. Shifts in C/Ku/Ka band policy or interference rules force changes to equipment roadmaps and QoS commitments. Harmonized rules ease global deployment; fragmentation raises compliance and certification costs. Active advocacy at ITU/IMO safeguards long-term capacity access.
Geopolitical tensions and trade routes
Conflicts and piracy alter shipping lanes and connectivity demand profiles; about 80% of global trade by volume moves by sea, concentrating traffic through chokepoints. Port access restrictions and naval escorts shift KVH coverage priorities and raise OPEX. Elevated risk zones—the Strait of Hormuz transits roughly 20% of global oil—boost demand for resilient comms and ISR-grade navigation. Prolonged tensions can disrupt installations and logistics.
Sanctions and export controls
ITAR and EAR restrict exports of defense-grade gyros and maritime communications, constraining KVH sales to sanctioned entities; OFAC's SDN list exceeded 9,000 entries in 2024, increasing screening scope; licensing can add weeks to months to sales cycles and shrink addressable markets; re-export rules force global distributor compliance and controlled supply chains are essential.
- ITAR/EAR constraints
- OFAC SDN >9,000 (2024)
- Licensing delays extend sales cycles
- Re-export rules affect partners
- Robust screening and controlled supply chains
Public maritime and digital policies
Government pushes for maritime digitalization and safety—reinforced by IMO and regional e-navigation/GMDSS modernization efforts in 2024—can effectively mandate vessel connectivity, benefiting vendors like KVH as the global merchant fleet (~55,000 ships per UNCTAD 2024) upgrades systems.
- Mandates favor equipped vendors
- Public-private grants accelerate upgrades
- GMDSS/e-navigation focus boosts remote monitoring demand
- Policy reversals risk stalling procurement
Defense spending, export controls and maritime rules reshape resilient communications demand
Defense spending cycles (global military expenditure $2.24T in 2023) and procurement localization shape demand and access for KVH, while ITAR/EAR and OFAC (SDN >9,000 in 2024) constrain sales and lengthen licensing timelines. Maritime mandates (UNCTAD fleet ~55,000 ships; ~80% of global trade by volume moved by sea) and IMO/ITU rules drive equipment adoption but regulatory fragmentation raises compliance costs. Geopolitical hotspots (Strait of Hormuz ~20% of oil transits) shift coverage and OPEX toward resilient comms.
| Factor | Key Metric | Impact |
|---|---|---|
| Defense spend | $2.24T (2023) | Demand timing/scale |
| Regulation | OFAC SDN >9,000 (2024) | Export controls, delays |
| Maritime market | ~55,000 ships; ~80% trade | Fleet upgrades |
| Chokepoints | Hormuz ~20% oil | Resilient comms demand |
What is included in the product
Detailed Word Document
Explores how Political, Economic, Social, Technological, Environmental and Legal factors uniquely impact KVH, with data-backed trends and detailed sub-points tailored to its industry and region. Designed for executives and investors, it offers forward‑looking insights and ready-to-use formatting for reports, pitches, and scenario planning.
Customizable Excel Spreadsheet
Concise, visually segmented KVH PESTLE summary ideal for slides or strategy packs—editable for region or business-line notes, easily shareable for quick team alignment, and built to support risk discussions and consultant reports.
Economic factors
Global shipping cycle and fleet capex
Freight rates and vessel utilization—reflected in the Baltic Dry Index near 1,400 mid-2025—directly determine ship operators’ VSAT and sensor budgets; strong cycles spur retrofit programs while weak cycles defer purchases. Newbuild activity, with the global orderbook around 6–8% of fleet in 2024, shapes OEM install opportunities. KVH’s recurring service revenue cushions hardware cyclicality but still tracks fleet economics.
Component costs and supply chain
Semiconductor and optical component pricing directly compress margins on KVH terminals and gyro products, with semiconductor lead times averaging about 15 weeks in 2024 (IHS Markit), which has kept spot prices elevated. Lead-time volatility delays deliveries and revenue recognition, while multi-sourcing and design-for-availability mitigate supplier concentration risk. Strict inventory discipline balances service levels against cash tied in stock.
Currency and interest rate dynamics
USD strength (DXY ~103 in mid‑2025) raises international pricing and compresses reported non‑USD revenue, while elevated US policy rates (fed funds 5.25–5.50%) and 10‑yr yields near 4.0% push customers’ borrowing costs higher, delaying capex for connectivity upgrades. FX hedging reduces volatility but typically costs 50–150 bps and adds balance‑sheet complexity. High subscription revenue model—now >50% recurring—helps smooth cash flows across rate and FX cycles.
Competitive pricing and ARPU pressure
LEO entrants, led by Starlink (over 4,000 satellites in orbit by 2024), intensify price competition for maritime broadband and compress ARPU as operators push lower-cost plans.
Bundled content and data plans are needed to defend ARPU and limit churn; differentiation through wider coverage, uptime SLAs and premium support sustains value, while lower-cost terminals expand the mid-market.
- LEO capacity: >4,000 Starlink sats (2024)
- ARPU pressure: need bundles to reduce churn
- Differentiation: SLAs, support, coverage
- Mid-market growth: cost-efficient terminals
Defense and government funding stability
Continuing resolutions and protracted budget debates can delay U.S. awards and procurement timing despite a FY2024 U.S. defense topline near $858 billion, creating revenue timing risk for KVH. Once funded, multi-year programs provide multi-year visibility and contract stability. Foreign Military Sales drive incremental demand but are timing-sensitive and subject to geopolitical shifts. Regional diversification lowers concentration risk across program cycles.
- Continuing resolutions: delays to awards
- FY2024 U.S. defense topline ~858 billion
- Multi-year programs: improved visibility
- FMS: timing-sensitive demand
- Diversification: reduces concentration risk
Defense spending, export controls and maritime rules reshape resilient communications demand
Freight cycles (BDI ~1,400 mid‑2025) and a 2024 orderbook ~6–8% drive VSAT retrofit timing and new OEM installs; >50% subscription revenue cushions hardware cyclicality. Semiconductor lead times ~15 weeks (2024) and Starlink >4,000 sats (2024) compress margins and ARPU; USD ~103 and Fed funds 5.25–5.50% raise customer capex costs.
| Metric | Value |
|---|---|
| BDI | ~1,400 (mid‑2025) |
| Orderbook | 6–8% (2024) |
| Semiconductor LT | ~15 wks (2024) |
| USD/DXY | ~103 (mid‑2025) |
What You See Is What You Get
KVH PESTLE Analysis
The KVH PESTLE Analysis preview shown here is the exact document you’ll receive after purchase—fully formatted, professionally structured, and ready to use. This is a real snapshot of the product with no placeholders or teasers. After payment you’ll instantly download the same finished file as displayed.
Original: $10.00
-65%$10.00
$3.50Description
Plan Smarter. Present Sharper. Compete Stronger.
Unlock strategic advantage with our PESTLE analysis of KVH—revealing how political, economic, social, technological, legal, and environmental forces shape its trajectory. Use these expert insights to forecast risks and spot growth opportunities. Purchase the full report for a detailed, actionable breakdown you can deploy immediately.
Political factors
Defense procurement and budget priorities
Defense spending cycles drive demand for navigation and satcom in military programs, with global military expenditure at $2.24 trillion in 2023 (SIPRI), influencing timing and scale of buys for suppliers like KVH.
Procurement preferences for domestic sourcing and industrial offsets can advantage local OEMs or exclude KVH from key bids unless partnerships or local production are in place.
Rising geopolitical risk can trigger urgent procurements or stall planned upgrades; stable multi-year contracts reduce revenue volatility but depend on policy continuity and budget commitments.
Spectrum allocation and satellite policy
National and international regulators, including 193 ITU members and 175 IMO members, allocate maritime satcom spectrum and license terminals, directly shaping KVH service footprints. Shifts in C/Ku/Ka band policy or interference rules force changes to equipment roadmaps and QoS commitments. Harmonized rules ease global deployment; fragmentation raises compliance and certification costs. Active advocacy at ITU/IMO safeguards long-term capacity access.
Geopolitical tensions and trade routes
Conflicts and piracy alter shipping lanes and connectivity demand profiles; about 80% of global trade by volume moves by sea, concentrating traffic through chokepoints. Port access restrictions and naval escorts shift KVH coverage priorities and raise OPEX. Elevated risk zones—the Strait of Hormuz transits roughly 20% of global oil—boost demand for resilient comms and ISR-grade navigation. Prolonged tensions can disrupt installations and logistics.
Sanctions and export controls
ITAR and EAR restrict exports of defense-grade gyros and maritime communications, constraining KVH sales to sanctioned entities; OFAC's SDN list exceeded 9,000 entries in 2024, increasing screening scope; licensing can add weeks to months to sales cycles and shrink addressable markets; re-export rules force global distributor compliance and controlled supply chains are essential.
- ITAR/EAR constraints
- OFAC SDN >9,000 (2024)
- Licensing delays extend sales cycles
- Re-export rules affect partners
- Robust screening and controlled supply chains
Public maritime and digital policies
Government pushes for maritime digitalization and safety—reinforced by IMO and regional e-navigation/GMDSS modernization efforts in 2024—can effectively mandate vessel connectivity, benefiting vendors like KVH as the global merchant fleet (~55,000 ships per UNCTAD 2024) upgrades systems.
- Mandates favor equipped vendors
- Public-private grants accelerate upgrades
- GMDSS/e-navigation focus boosts remote monitoring demand
- Policy reversals risk stalling procurement
Defense spending, export controls and maritime rules reshape resilient communications demand
Defense spending cycles (global military expenditure $2.24T in 2023) and procurement localization shape demand and access for KVH, while ITAR/EAR and OFAC (SDN >9,000 in 2024) constrain sales and lengthen licensing timelines. Maritime mandates (UNCTAD fleet ~55,000 ships; ~80% of global trade by volume moved by sea) and IMO/ITU rules drive equipment adoption but regulatory fragmentation raises compliance costs. Geopolitical hotspots (Strait of Hormuz ~20% of oil transits) shift coverage and OPEX toward resilient comms.
| Factor | Key Metric | Impact |
|---|---|---|
| Defense spend | $2.24T (2023) | Demand timing/scale |
| Regulation | OFAC SDN >9,000 (2024) | Export controls, delays |
| Maritime market | ~55,000 ships; ~80% trade | Fleet upgrades |
| Chokepoints | Hormuz ~20% oil | Resilient comms demand |
What is included in the product
Detailed Word Document
Explores how Political, Economic, Social, Technological, Environmental and Legal factors uniquely impact KVH, with data-backed trends and detailed sub-points tailored to its industry and region. Designed for executives and investors, it offers forward‑looking insights and ready-to-use formatting for reports, pitches, and scenario planning.
Customizable Excel Spreadsheet
Concise, visually segmented KVH PESTLE summary ideal for slides or strategy packs—editable for region or business-line notes, easily shareable for quick team alignment, and built to support risk discussions and consultant reports.
Economic factors
Global shipping cycle and fleet capex
Freight rates and vessel utilization—reflected in the Baltic Dry Index near 1,400 mid-2025—directly determine ship operators’ VSAT and sensor budgets; strong cycles spur retrofit programs while weak cycles defer purchases. Newbuild activity, with the global orderbook around 6–8% of fleet in 2024, shapes OEM install opportunities. KVH’s recurring service revenue cushions hardware cyclicality but still tracks fleet economics.
Component costs and supply chain
Semiconductor and optical component pricing directly compress margins on KVH terminals and gyro products, with semiconductor lead times averaging about 15 weeks in 2024 (IHS Markit), which has kept spot prices elevated. Lead-time volatility delays deliveries and revenue recognition, while multi-sourcing and design-for-availability mitigate supplier concentration risk. Strict inventory discipline balances service levels against cash tied in stock.
Currency and interest rate dynamics
USD strength (DXY ~103 in mid‑2025) raises international pricing and compresses reported non‑USD revenue, while elevated US policy rates (fed funds 5.25–5.50%) and 10‑yr yields near 4.0% push customers’ borrowing costs higher, delaying capex for connectivity upgrades. FX hedging reduces volatility but typically costs 50–150 bps and adds balance‑sheet complexity. High subscription revenue model—now >50% recurring—helps smooth cash flows across rate and FX cycles.
Competitive pricing and ARPU pressure
LEO entrants, led by Starlink (over 4,000 satellites in orbit by 2024), intensify price competition for maritime broadband and compress ARPU as operators push lower-cost plans.
Bundled content and data plans are needed to defend ARPU and limit churn; differentiation through wider coverage, uptime SLAs and premium support sustains value, while lower-cost terminals expand the mid-market.
- LEO capacity: >4,000 Starlink sats (2024)
- ARPU pressure: need bundles to reduce churn
- Differentiation: SLAs, support, coverage
- Mid-market growth: cost-efficient terminals
Defense and government funding stability
Continuing resolutions and protracted budget debates can delay U.S. awards and procurement timing despite a FY2024 U.S. defense topline near $858 billion, creating revenue timing risk for KVH. Once funded, multi-year programs provide multi-year visibility and contract stability. Foreign Military Sales drive incremental demand but are timing-sensitive and subject to geopolitical shifts. Regional diversification lowers concentration risk across program cycles.
- Continuing resolutions: delays to awards
- FY2024 U.S. defense topline ~858 billion
- Multi-year programs: improved visibility
- FMS: timing-sensitive demand
- Diversification: reduces concentration risk
Defense spending, export controls and maritime rules reshape resilient communications demand
Freight cycles (BDI ~1,400 mid‑2025) and a 2024 orderbook ~6–8% drive VSAT retrofit timing and new OEM installs; >50% subscription revenue cushions hardware cyclicality. Semiconductor lead times ~15 weeks (2024) and Starlink >4,000 sats (2024) compress margins and ARPU; USD ~103 and Fed funds 5.25–5.50% raise customer capex costs.
| Metric | Value |
|---|---|
| BDI | ~1,400 (mid‑2025) |
| Orderbook | 6–8% (2024) |
| Semiconductor LT | ~15 wks (2024) |
| USD/DXY | ~103 (mid‑2025) |
What You See Is What You Get
KVH PESTLE Analysis
The KVH PESTLE Analysis preview shown here is the exact document you’ll receive after purchase—fully formatted, professionally structured, and ready to use. This is a real snapshot of the product with no placeholders or teasers. After payment you’ll instantly download the same finished file as displayed.











