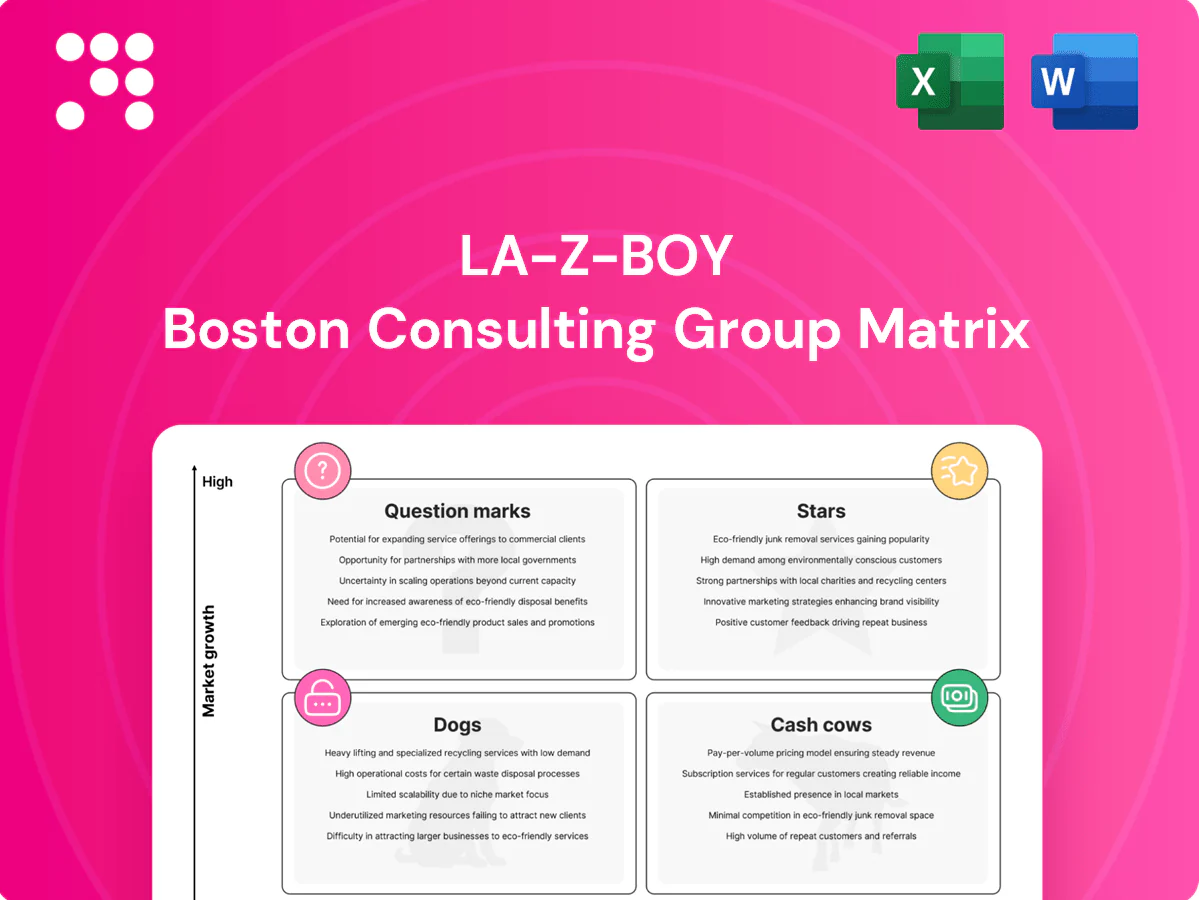
La-Z-Boy Boston Consulting Group Matrix

Visual. Strategic. Downloadable.
Curious where La‑Z‑Boy’s sofas and recliners sit—Stars, Cash Cows, Dogs or Question Marks? This snapshot teases product positions and market momentum; buy the full BCG Matrix for quadrant-by-quadrant clarity, data-backed moves, and ready-to-present Word and Excel files. Get strategic direction fast and start reallocating capital with confidence.
Stars

Power recliners & motion upholstery
Power recliners and motion upholstery are a flagship Star for La-Z-Boy, holding a high share in a motion seating category that grew about 5% in 2024. Consumers trade up for power, heat, and lift, pushing average selling prices above $1,200 and boosting revenue per unit. Maintain aggressive promotion, product innovation, and premium floor space to defend the lead. If category growth normalizes, this engine can transition smoothly into Cash Cow status.
La-Z-Boy Furniture Galleries network
La-Z-Boy Furniture Galleries (NYSE: LZB) branded stores—over 300 across North America—drive visibility, higher attachment rates and a premium sales mix in expanding markets. They demand ongoing capex and local marketing investments but deliver volume, margin control and channel consistency. Protect prime trade areas and tighten store standards to sustain throughput: scale today, milk tomorrow.

Sectionals & modular seating
Sectionals & modular seating sit in La-Z-Boy’s growth quadrant as family and entertainment use-cases drive demand; the company (NYSE: LZB) reported roughly $1.8B in FY2024 net sales, underscoring scale to capitalize on this segment. Design variety and brand trust win conversions; invest in quick-ship SKUs, broader fabric assortments, and digital room planners to capture share. Hold share while category momentum continues.

Performance fabrics & customization
Performance fabrics & customization drive La-Z-Boy Stars: stain-resistant, pet-friendly, easy-clean covers command premium pricing with gross margins often over 30% and rising demand—custom orders can take 6–10 weeks, creating friction but cementing differentiation; keep marketing benefits and streamline production to cut cycle times. Big promotional spend sustains momentum, supporting share gains in upholstery categories.
- Stain-resistant
- Pet-friendly
- Easy-clean
- Premium margins & custom lead-times 6–10 weeks
- Tighten ops to shorten cycles
- Heavy promo spend sustains Star status
Omnichannel selling (store + digital)
Customers research online, buy in-store, then reorder online or do the reverse; La-Z-Boy’s omnichannel flow raises close rates and attachments by streamlining visualization, live consults and BOPIS. La-Z-Boy reported roughly $1.8B in net sales in FY2024 with digital mix near 18%, signaling strong growth—spend now to cement habits and expand share.
- Omnichannel conversion lift: higher close + attachments
- Key tools: AR/visualizers, live consults, BOPIS
- FY2024 net sales: ~$1.8B; digital ~18%
- Strategy: invest to lock repeat behavior
Power recliners & performance fabrics: $1.8B - push promo, omni
Power recliners, stores, sectionals and performance fabrics are La-Z-Boy Stars: FY2024 sales ~$1.8B, digital ~18%, category growth ~5%. ASPs >$1,200; perf-fabric margins >30%; lead times 6–10 wks. Prioritize promo, product innovation, omnichannel and ops.
| Metric | 2024 |
|---|---|
| Net sales | $1.8B |
| Digital | ~18% |
| Category growth | ~5% |
| ASP | >$1,200 |
| Margin | >30% |
| Stores | 300+ |
| Lead time | 6–10 wks |
What is included in the product
 Detailed Word Document
In-depth BCG analysis of La-Z-Boy products, identifying Stars, Cash Cows, Question Marks and Dogs with clear invest/hold/divest guidance.

 Customizable Excel Spreadsheet
One-page La-Z-Boy BCG Matrix clarifying portfolio choices and ending analysis paralysis
Cash Cows

Classic recliner franchise
Classic recliner franchise is La-Z-Boy's iconic, category-defining volume base, rooted since 1927 and still driving core traffic. Market growth is mature, but entrenched share and solid operating margins (FY2024 net sales ~$1.9B with consistent positive operating cash flow) mean minimal promotion sustains demand. Operational gains convert directly to cash, making the franchise the primary funder for the next bets.
Stationary sofas & chairs
Stationary sofas and chairs are classic cash cows for La-Z-Boy with steady replacement cycles (typically 7–10 years) and predictable turns supporting consistent cash flow; the U.S. furniture market was around $125 billion in 2024, underpinning baseline demand. Competitive pressures exist, but scale purchasing and efficient manufacturing sustain decent margins. Growth is limited but reliable; maintain assortment focus and avoid costly over-innovation to protect cash generation.

Wholesale to national retailers
Wholesale to national retailers delivers steady volume for La-Z-Boy, anchored by large accounts that support FY2024 net sales of $1.88 billion. Price discipline and supply reliability protect margins, making the channel a predictable profit source. Maintain high service levels, manage product mix and resist promotional races to preserve throughput. Quiet cash generator for reinvestment.

Service, parts & protection plans
Service, parts & protection plans are classic cash cows for La‑Z‑Boy: low-growth, high-margin add-ons tied to the established installed base, with predictable claim frequency and steady revenue contribution.
Current performance shows stable attach opportunities; improving attach rates through streamlined claims handling and targeted training can modestly increase margins without heavy investment.
Small in product-line share but strong in cash generation, these offerings fund growth areas while providing durable profitability and customer retention.
- Low growth, high margin
- Predictable claims, improvable attach rates
- Streamline claims/training to lift attach
- Small line, strong cash generation
Core SKUs with proven turns
Core SKUs with proven turns are La-Z-Boy workhorses that sell with minimal hand-holding, supported by a streamlined supply chain and targeted promotions that preserve margin.
- Keep inventory tight
- Avoid SKU bloat
- Promos surgical, not blanket
- Milk high-turn models
Recliner franchise: steady, high-margin cash flow; FY2024 sales $1.88B
Classic recliner franchise drives core volume; FY2024 net sales ~$1.88B with steady operating cash flow, low growth but high margin.
Sofas/chairs and wholesale channels are stable cash cows in a $125B US furniture market (2024), supporting predictable returns.
Service plans and core SKUs yield high-margin attach revenue; prioritize tight inventory and surgical promotions.
| Segment | FY2024 | Growth | Role |
|---|---|---|---|
| Company total | $1.88B | mature | Primary cash source |
| US market | $125B | mature | Baseline demand |
What You’re Viewing Is Included
La-Z-Boy BCG Matrix
The file you're previewing here is the exact La-Z-Boy BCG Matrix report you'll receive after purchase—no watermarks, no placeholders, just the finished, fully formatted document. This preview mirrors the downloadable file, built for clarity and strategic use so you can drop it into presentations or planning sessions immediately. Once purchased, the full report is yours to edit, print, or share with the team—no surprises, no extra steps. Crafted by analysts, ready for action.

Visual. Strategic. Downloadable.
Curious where La‑Z‑Boy’s sofas and recliners sit—Stars, Cash Cows, Dogs or Question Marks? This snapshot teases product positions and market momentum; buy the full BCG Matrix for quadrant-by-quadrant clarity, data-backed moves, and ready-to-present Word and Excel files. Get strategic direction fast and start reallocating capital with confidence.
Stars
Power recliners & motion upholstery
Power recliners and motion upholstery are a flagship Star for La-Z-Boy, holding a high share in a motion seating category that grew about 5% in 2024. Consumers trade up for power, heat, and lift, pushing average selling prices above $1,200 and boosting revenue per unit. Maintain aggressive promotion, product innovation, and premium floor space to defend the lead. If category growth normalizes, this engine can transition smoothly into Cash Cow status.
La-Z-Boy Furniture Galleries network
La-Z-Boy Furniture Galleries (NYSE: LZB) branded stores—over 300 across North America—drive visibility, higher attachment rates and a premium sales mix in expanding markets. They demand ongoing capex and local marketing investments but deliver volume, margin control and channel consistency. Protect prime trade areas and tighten store standards to sustain throughput: scale today, milk tomorrow.
Sectionals & modular seating
Sectionals & modular seating sit in La-Z-Boy’s growth quadrant as family and entertainment use-cases drive demand; the company (NYSE: LZB) reported roughly $1.8B in FY2024 net sales, underscoring scale to capitalize on this segment. Design variety and brand trust win conversions; invest in quick-ship SKUs, broader fabric assortments, and digital room planners to capture share. Hold share while category momentum continues.
Performance fabrics & customization
Performance fabrics & customization drive La-Z-Boy Stars: stain-resistant, pet-friendly, easy-clean covers command premium pricing with gross margins often over 30% and rising demand—custom orders can take 6–10 weeks, creating friction but cementing differentiation; keep marketing benefits and streamline production to cut cycle times. Big promotional spend sustains momentum, supporting share gains in upholstery categories.
- Stain-resistant
- Pet-friendly
- Easy-clean
- Premium margins & custom lead-times 6–10 weeks
- Tighten ops to shorten cycles
- Heavy promo spend sustains Star status
Omnichannel selling (store + digital)
Customers research online, buy in-store, then reorder online or do the reverse; La-Z-Boy’s omnichannel flow raises close rates and attachments by streamlining visualization, live consults and BOPIS. La-Z-Boy reported roughly $1.8B in net sales in FY2024 with digital mix near 18%, signaling strong growth—spend now to cement habits and expand share.
- Omnichannel conversion lift: higher close + attachments
- Key tools: AR/visualizers, live consults, BOPIS
- FY2024 net sales: ~$1.8B; digital ~18%
- Strategy: invest to lock repeat behavior
Power recliners & performance fabrics: $1.8B - push promo, omni
Power recliners, stores, sectionals and performance fabrics are La-Z-Boy Stars: FY2024 sales ~$1.8B, digital ~18%, category growth ~5%. ASPs >$1,200; perf-fabric margins >30%; lead times 6–10 wks. Prioritize promo, product innovation, omnichannel and ops.
| Metric | 2024 |
|---|---|
| Net sales | $1.8B |
| Digital | ~18% |
| Category growth | ~5% |
| ASP | >$1,200 |
| Margin | >30% |
| Stores | 300+ |
| Lead time | 6–10 wks |
What is included in the product
Detailed Word Document
In-depth BCG analysis of La-Z-Boy products, identifying Stars, Cash Cows, Question Marks and Dogs with clear invest/hold/divest guidance.
Customizable Excel Spreadsheet
One-page La-Z-Boy BCG Matrix clarifying portfolio choices and ending analysis paralysis
Cash Cows
Classic recliner franchise
Classic recliner franchise is La-Z-Boy's iconic, category-defining volume base, rooted since 1927 and still driving core traffic. Market growth is mature, but entrenched share and solid operating margins (FY2024 net sales ~$1.9B with consistent positive operating cash flow) mean minimal promotion sustains demand. Operational gains convert directly to cash, making the franchise the primary funder for the next bets.
Stationary sofas & chairs
Stationary sofas and chairs are classic cash cows for La-Z-Boy with steady replacement cycles (typically 7–10 years) and predictable turns supporting consistent cash flow; the U.S. furniture market was around $125 billion in 2024, underpinning baseline demand. Competitive pressures exist, but scale purchasing and efficient manufacturing sustain decent margins. Growth is limited but reliable; maintain assortment focus and avoid costly over-innovation to protect cash generation.
Wholesale to national retailers
Wholesale to national retailers delivers steady volume for La-Z-Boy, anchored by large accounts that support FY2024 net sales of $1.88 billion. Price discipline and supply reliability protect margins, making the channel a predictable profit source. Maintain high service levels, manage product mix and resist promotional races to preserve throughput. Quiet cash generator for reinvestment.
Service, parts & protection plans
Service, parts & protection plans are classic cash cows for La‑Z‑Boy: low-growth, high-margin add-ons tied to the established installed base, with predictable claim frequency and steady revenue contribution.
Current performance shows stable attach opportunities; improving attach rates through streamlined claims handling and targeted training can modestly increase margins without heavy investment.
Small in product-line share but strong in cash generation, these offerings fund growth areas while providing durable profitability and customer retention.
- Low growth, high margin
- Predictable claims, improvable attach rates
- Streamline claims/training to lift attach
- Small line, strong cash generation
Core SKUs with proven turns
Core SKUs with proven turns are La-Z-Boy workhorses that sell with minimal hand-holding, supported by a streamlined supply chain and targeted promotions that preserve margin.
- Keep inventory tight
- Avoid SKU bloat
- Promos surgical, not blanket
- Milk high-turn models
Recliner franchise: steady, high-margin cash flow; FY2024 sales $1.88B
Classic recliner franchise drives core volume; FY2024 net sales ~$1.88B with steady operating cash flow, low growth but high margin.
Sofas/chairs and wholesale channels are stable cash cows in a $125B US furniture market (2024), supporting predictable returns.
Service plans and core SKUs yield high-margin attach revenue; prioritize tight inventory and surgical promotions.
| Segment | FY2024 | Growth | Role |
|---|---|---|---|
| Company total | $1.88B | mature | Primary cash source |
| US market | $125B | mature | Baseline demand |
What You’re Viewing Is Included
La-Z-Boy BCG Matrix
The file you're previewing here is the exact La-Z-Boy BCG Matrix report you'll receive after purchase—no watermarks, no placeholders, just the finished, fully formatted document. This preview mirrors the downloadable file, built for clarity and strategic use so you can drop it into presentations or planning sessions immediately. Once purchased, the full report is yours to edit, print, or share with the team—no surprises, no extra steps. Crafted by analysts, ready for action.
Description
Visual. Strategic. Downloadable.
Curious where La‑Z‑Boy’s sofas and recliners sit—Stars, Cash Cows, Dogs or Question Marks? This snapshot teases product positions and market momentum; buy the full BCG Matrix for quadrant-by-quadrant clarity, data-backed moves, and ready-to-present Word and Excel files. Get strategic direction fast and start reallocating capital with confidence.
Stars
Power recliners & motion upholstery
Power recliners and motion upholstery are a flagship Star for La-Z-Boy, holding a high share in a motion seating category that grew about 5% in 2024. Consumers trade up for power, heat, and lift, pushing average selling prices above $1,200 and boosting revenue per unit. Maintain aggressive promotion, product innovation, and premium floor space to defend the lead. If category growth normalizes, this engine can transition smoothly into Cash Cow status.
La-Z-Boy Furniture Galleries network
La-Z-Boy Furniture Galleries (NYSE: LZB) branded stores—over 300 across North America—drive visibility, higher attachment rates and a premium sales mix in expanding markets. They demand ongoing capex and local marketing investments but deliver volume, margin control and channel consistency. Protect prime trade areas and tighten store standards to sustain throughput: scale today, milk tomorrow.
Sectionals & modular seating
Sectionals & modular seating sit in La-Z-Boy’s growth quadrant as family and entertainment use-cases drive demand; the company (NYSE: LZB) reported roughly $1.8B in FY2024 net sales, underscoring scale to capitalize on this segment. Design variety and brand trust win conversions; invest in quick-ship SKUs, broader fabric assortments, and digital room planners to capture share. Hold share while category momentum continues.
Performance fabrics & customization
Performance fabrics & customization drive La-Z-Boy Stars: stain-resistant, pet-friendly, easy-clean covers command premium pricing with gross margins often over 30% and rising demand—custom orders can take 6–10 weeks, creating friction but cementing differentiation; keep marketing benefits and streamline production to cut cycle times. Big promotional spend sustains momentum, supporting share gains in upholstery categories.
- Stain-resistant
- Pet-friendly
- Easy-clean
- Premium margins & custom lead-times 6–10 weeks
- Tighten ops to shorten cycles
- Heavy promo spend sustains Star status
Omnichannel selling (store + digital)
Customers research online, buy in-store, then reorder online or do the reverse; La-Z-Boy’s omnichannel flow raises close rates and attachments by streamlining visualization, live consults and BOPIS. La-Z-Boy reported roughly $1.8B in net sales in FY2024 with digital mix near 18%, signaling strong growth—spend now to cement habits and expand share.
- Omnichannel conversion lift: higher close + attachments
- Key tools: AR/visualizers, live consults, BOPIS
- FY2024 net sales: ~$1.8B; digital ~18%
- Strategy: invest to lock repeat behavior
Power recliners & performance fabrics: $1.8B - push promo, omni
Power recliners, stores, sectionals and performance fabrics are La-Z-Boy Stars: FY2024 sales ~$1.8B, digital ~18%, category growth ~5%. ASPs >$1,200; perf-fabric margins >30%; lead times 6–10 wks. Prioritize promo, product innovation, omnichannel and ops.
| Metric | 2024 |
|---|---|
| Net sales | $1.8B |
| Digital | ~18% |
| Category growth | ~5% |
| ASP | >$1,200 |
| Margin | >30% |
| Stores | 300+ |
| Lead time | 6–10 wks |
What is included in the product
Detailed Word Document
In-depth BCG analysis of La-Z-Boy products, identifying Stars, Cash Cows, Question Marks and Dogs with clear invest/hold/divest guidance.
Customizable Excel Spreadsheet
One-page La-Z-Boy BCG Matrix clarifying portfolio choices and ending analysis paralysis
Cash Cows
Classic recliner franchise
Classic recliner franchise is La-Z-Boy's iconic, category-defining volume base, rooted since 1927 and still driving core traffic. Market growth is mature, but entrenched share and solid operating margins (FY2024 net sales ~$1.9B with consistent positive operating cash flow) mean minimal promotion sustains demand. Operational gains convert directly to cash, making the franchise the primary funder for the next bets.
Stationary sofas & chairs
Stationary sofas and chairs are classic cash cows for La-Z-Boy with steady replacement cycles (typically 7–10 years) and predictable turns supporting consistent cash flow; the U.S. furniture market was around $125 billion in 2024, underpinning baseline demand. Competitive pressures exist, but scale purchasing and efficient manufacturing sustain decent margins. Growth is limited but reliable; maintain assortment focus and avoid costly over-innovation to protect cash generation.
Wholesale to national retailers
Wholesale to national retailers delivers steady volume for La-Z-Boy, anchored by large accounts that support FY2024 net sales of $1.88 billion. Price discipline and supply reliability protect margins, making the channel a predictable profit source. Maintain high service levels, manage product mix and resist promotional races to preserve throughput. Quiet cash generator for reinvestment.
Service, parts & protection plans
Service, parts & protection plans are classic cash cows for La‑Z‑Boy: low-growth, high-margin add-ons tied to the established installed base, with predictable claim frequency and steady revenue contribution.
Current performance shows stable attach opportunities; improving attach rates through streamlined claims handling and targeted training can modestly increase margins without heavy investment.
Small in product-line share but strong in cash generation, these offerings fund growth areas while providing durable profitability and customer retention.
- Low growth, high margin
- Predictable claims, improvable attach rates
- Streamline claims/training to lift attach
- Small line, strong cash generation
Core SKUs with proven turns
Core SKUs with proven turns are La-Z-Boy workhorses that sell with minimal hand-holding, supported by a streamlined supply chain and targeted promotions that preserve margin.
- Keep inventory tight
- Avoid SKU bloat
- Promos surgical, not blanket
- Milk high-turn models
Recliner franchise: steady, high-margin cash flow; FY2024 sales $1.88B
Classic recliner franchise drives core volume; FY2024 net sales ~$1.88B with steady operating cash flow, low growth but high margin.
Sofas/chairs and wholesale channels are stable cash cows in a $125B US furniture market (2024), supporting predictable returns.
Service plans and core SKUs yield high-margin attach revenue; prioritize tight inventory and surgical promotions.
| Segment | FY2024 | Growth | Role |
|---|---|---|---|
| Company total | $1.88B | mature | Primary cash source |
| US market | $125B | mature | Baseline demand |
What You’re Viewing Is Included
La-Z-Boy BCG Matrix
The file you're previewing here is the exact La-Z-Boy BCG Matrix report you'll receive after purchase—no watermarks, no placeholders, just the finished, fully formatted document. This preview mirrors the downloadable file, built for clarity and strategic use so you can drop it into presentations or planning sessions immediately. Once purchased, the full report is yours to edit, print, or share with the team—no surprises, no extra steps. Crafted by analysts, ready for action.











