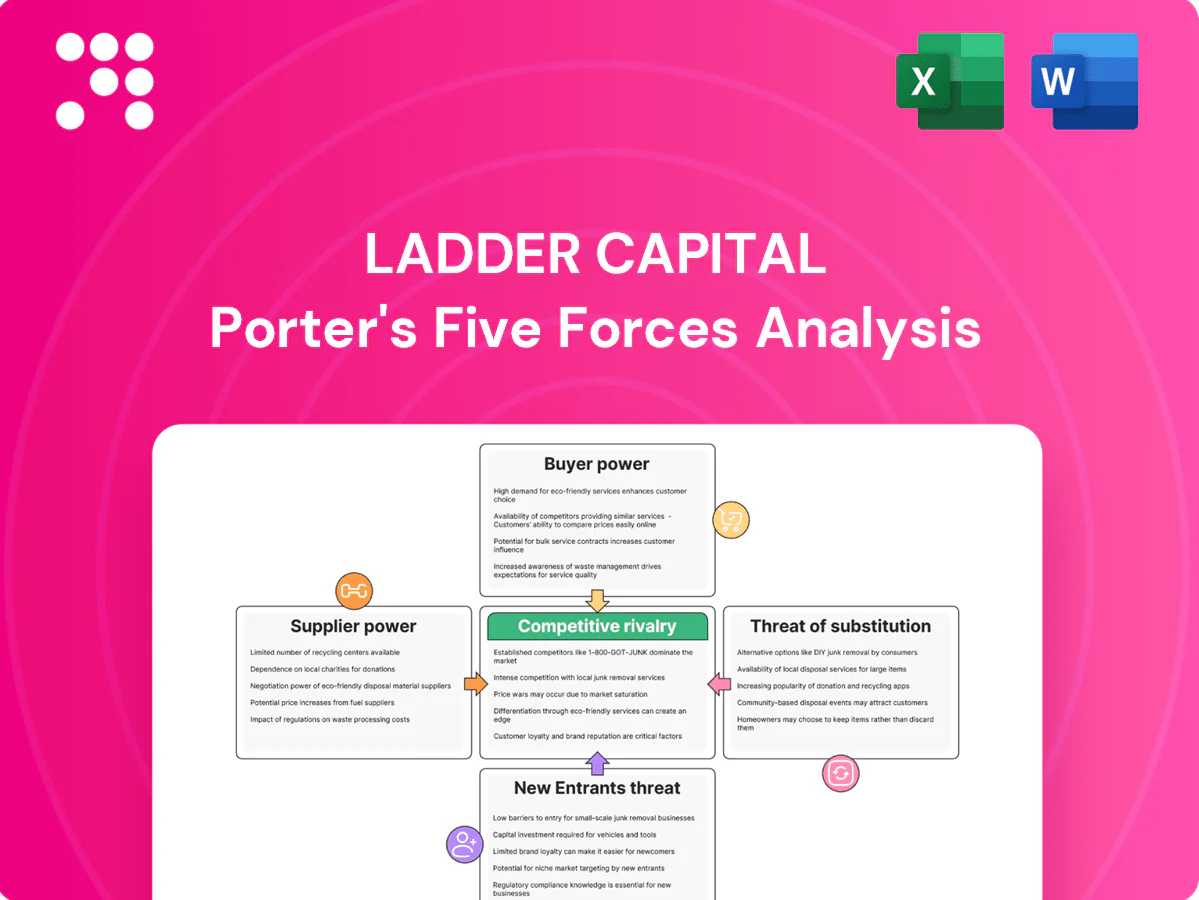
Ladder Capital Porter's Five Forces Analysis

Go Beyond the Preview—Access the Full Strategic Report
Ladder Capital’s Porter's Five Forces snapshot highlights buyer and lender power, competitive rivalry, and emerging substitute and entrant risks shaping its CRE finance standing. It outlines strategic advantages and key market pressures in summary form. Ready for actionable depth? Unlock the full, consultant-grade analysis with force ratings, visuals, and ready-to-use Word/Excel deliverables.
Suppliers Bargaining Power

Concentration of capital providers
Warehouse lenders, repo counterparties and secured financing providers are concentrated among big banks and broker-dealers; the top 5 U.S. banks held roughly 45% of commercial banking assets in 2024, tightening access in risk-off periods. Limited alternatives can force wider spreads and higher collateral haircuts, raising funding costs and reducing flexibility. Ladder mitigates this via diversified warehouse facilities and regular unsecured debt issuance to broaden funding sources.
Dependence on securitization markets
Dependence on CMBS/CLO take-outs is critical for recycling capital and managing duration; 2024 U.S. CMBS issuance (~$60B) underscores how pivotal these markets are. When conduit/CMBS spreads widen or issuance stalls, execution risk rises and margins compress, increasing capital markets’ supplier power. This cyclicality elevates lender vulnerability, though strong underwriting and loan seasoning can improve eligibility and pricing.

Rating agencies and trustees
Rating agencies and trustees drive advance rates and covenant costs, and market guidance tightened in 2023–24 with advance rates roughly 10% lower versus peak cycles, constraining Ladder Capital’s leverage and loan pool mix. Stricter criteria in downturns force higher credit enhancements and reduce eligible collateral, indirectly boosting suppliers’ bargaining leverage. Proactive engagement and transparent loan-level data have reduced transactional frictions and pricing premia.

Brokerage and deal-flow intermediaries
Loan brokers and advisors can steer sponsors toward lenders that pay higher placement fees or accept looser covenants; industry placement fees typically range 0.5–2% of loan amount, which compresses net yields. Concentrated intermediaries increase acquisition costs and lower lender returns, while direct sponsor relationships let Ladder bypass such fees; Ladder’s repeat-borrower strategy reduces broker dependence.
- Broker fees: 0.5–2%
- Higher fees → lower yields
- Concentrated intermediaries raise acquisition costs
- Repeat-borrower focus cuts broker reliance
Data, servicing, and legal vendors
Specialized diligence, servicing, and legal providers are required for complex CRE assets, and in 2024 these niche firms continued to command pricing premiums for sector-specific expertise. High switching costs and capacity constraints increase supplier bargaining power by extending timelines and raising replacement costs. Multi-vendor panels and standardized documentation are common mitigants that temper pricing pressure.
Bank concentration raises funding costs; top 5 hold ~45% of assets
Supplier power is elevated: top 5 banks held ~45% of U.S. commercial banking assets in 2024, concentrating warehouse/repo capacity and raising funding costs in risk-off periods. U.S. CMBS issuance was ~60B in 2024, making CMBS/CLO take-outs critical; broker fees (0.5–2%) and ~10% lower advance rates vs cycle peaks tighten margins. Ladder offsets via diversified warehouses, unsecured issuance and repeat-borrower focus.
| Metric | 2024 | Impact |
|---|---|---|
| Top-5 bank share | ~45% | Concentrated funding |
| CMBS issuance | $60B | Take-out dependency |
| Broker fees | 0.5–2% | Yield compression |
| Advance rates vs peak | ~-10% | Lower leverage |
What is included in the product
 Detailed Word Document
Concise Porter's Five Forces analysis tailored for Ladder Capital that uncovers competitive drivers, buyer/supplier power, entry barriers, substitutes and disruptive threats, with strategic implications for pricing and market positioning.

 Customizable Excel Spreadsheet
One-sheet Porter's Five Forces for Ladder Capital that instantly maps competitive pressure with a radar chart and customizable force levels—clean, slide-ready layout requiring no macros and easy to plug into Excel or Word reports for rapid strategic decisions.
Customers Bargaining Power

Financial sponsor sophistication
Institutional borrowers quickly benchmark loan terms across lenders, using market data and secondary spreads to press for better pricing. Their sophistication strengthens negotiation on spreads, structure, and covenants, intensifying pressure on lenders amid a higher-rate environment (Fed funds target 5.25–5.50% in 2024). In competitive markets this compresses margins. Differentiation via speed and certainty of execution offsets some of that bargaining power.
Many alternative lenders
Sponsors routinely solicit bids from banks, debt funds, REITs and insurers, and with global private debt AUM > $1 trillion in 2024 the pool of alternative lenders amplifies buyer leverage on pricing and proceeds. Tight credit cycles can temporarily reduce that power, but Ladder’s senior-first focus and flexible structures help it secure mandates despite downward price pressure.

Sensitivity to rate environment
Rising base rates (fed funds near 5.25–5.50% in 2024) push borrowers to demand lower all-in costs and protections, increasing buyer power during volatile rate regimes. Borrowers commonly negotiate 25–75 bps tighter spreads, interest-only periods and rate caps (caps often 20–100 bps). Providing hedging guidance and swap/cap solutions preserves Ladder Capital economics while meeting client needs.

Deal timing pressures
Closing deadlines on acquisitions or refinancings often compress into 30–45 days, shifting leverage to lenders who can charge 100–300 basis points for speed; when marketing stretches beyond 6–12 months buyers typically regain negotiating power. Ladder’s ability to underwrite in roughly 2–4 weeks acts as a counterweight, allowing it to capture spread and control terms.
- Deal windows: 30–45 days
- Speed premium: 100–300 bps
- Long marketing: 6–12 months
- Ladder underwriting: ~2–4 weeks
Credit quality dispersion
Core, stabilized assets with strong sponsors command the best terms in 2024, giving buyers of those loans higher bargaining power, while transitional or niche assets reduce buyer leverage because fewer lenders are eligible. Ladder prices these power differentials through risk-adjusted spreads and targeted underwriting.
- Buyer leverage: higher for stabilized
- Transitional: fewer bidders, lower leverage
- Ladder: risk-adjusted spreads
Borrowers push >$1T debt; Fed 5.25–5.50% boosts hedging
Institutional borrowers use market spreads and >$1T private debt AUM (2024) to push for tighter pricing and covenants, compressing margins; Ladder offsets with speed and senior-first structures. Rate volatility (Fed 5.25–5.50% 2024) raises demand for caps/swaps. Stabilized assets see higher buyer leverage; transitional assets reduce it.
| Metric | 2024 |
|---|---|
| Private debt AUM | $1T+ |
| Fed funds | 5.25–5.50% |
| Speed premium | 100–300bps |
What You See Is What You Get
Ladder Capital Porter's Five Forces Analysis
This preview is the exact Ladder Capital Porter's Five Forces analysis you'll receive after purchase—fully formatted, complete, and ready for use. It outlines supplier and buyer power, competitive rivalry, threats of entry and substitution, and strategic implications. No placeholders or samples—instant access to this same file upon payment.

Go Beyond the Preview—Access the Full Strategic Report
Ladder Capital’s Porter's Five Forces snapshot highlights buyer and lender power, competitive rivalry, and emerging substitute and entrant risks shaping its CRE finance standing. It outlines strategic advantages and key market pressures in summary form. Ready for actionable depth? Unlock the full, consultant-grade analysis with force ratings, visuals, and ready-to-use Word/Excel deliverables.
Suppliers Bargaining Power
Concentration of capital providers
Warehouse lenders, repo counterparties and secured financing providers are concentrated among big banks and broker-dealers; the top 5 U.S. banks held roughly 45% of commercial banking assets in 2024, tightening access in risk-off periods. Limited alternatives can force wider spreads and higher collateral haircuts, raising funding costs and reducing flexibility. Ladder mitigates this via diversified warehouse facilities and regular unsecured debt issuance to broaden funding sources.
Dependence on securitization markets
Dependence on CMBS/CLO take-outs is critical for recycling capital and managing duration; 2024 U.S. CMBS issuance (~$60B) underscores how pivotal these markets are. When conduit/CMBS spreads widen or issuance stalls, execution risk rises and margins compress, increasing capital markets’ supplier power. This cyclicality elevates lender vulnerability, though strong underwriting and loan seasoning can improve eligibility and pricing.
Rating agencies and trustees
Rating agencies and trustees drive advance rates and covenant costs, and market guidance tightened in 2023–24 with advance rates roughly 10% lower versus peak cycles, constraining Ladder Capital’s leverage and loan pool mix. Stricter criteria in downturns force higher credit enhancements and reduce eligible collateral, indirectly boosting suppliers’ bargaining leverage. Proactive engagement and transparent loan-level data have reduced transactional frictions and pricing premia.
Brokerage and deal-flow intermediaries
Loan brokers and advisors can steer sponsors toward lenders that pay higher placement fees or accept looser covenants; industry placement fees typically range 0.5–2% of loan amount, which compresses net yields. Concentrated intermediaries increase acquisition costs and lower lender returns, while direct sponsor relationships let Ladder bypass such fees; Ladder’s repeat-borrower strategy reduces broker dependence.
- Broker fees: 0.5–2%
- Higher fees → lower yields
- Concentrated intermediaries raise acquisition costs
- Repeat-borrower focus cuts broker reliance
Data, servicing, and legal vendors
Specialized diligence, servicing, and legal providers are required for complex CRE assets, and in 2024 these niche firms continued to command pricing premiums for sector-specific expertise. High switching costs and capacity constraints increase supplier bargaining power by extending timelines and raising replacement costs. Multi-vendor panels and standardized documentation are common mitigants that temper pricing pressure.
Bank concentration raises funding costs; top 5 hold ~45% of assets
Supplier power is elevated: top 5 banks held ~45% of U.S. commercial banking assets in 2024, concentrating warehouse/repo capacity and raising funding costs in risk-off periods. U.S. CMBS issuance was ~60B in 2024, making CMBS/CLO take-outs critical; broker fees (0.5–2%) and ~10% lower advance rates vs cycle peaks tighten margins. Ladder offsets via diversified warehouses, unsecured issuance and repeat-borrower focus.
| Metric | 2024 | Impact |
|---|---|---|
| Top-5 bank share | ~45% | Concentrated funding |
| CMBS issuance | $60B | Take-out dependency |
| Broker fees | 0.5–2% | Yield compression |
| Advance rates vs peak | ~-10% | Lower leverage |
What is included in the product
Detailed Word Document
Concise Porter's Five Forces analysis tailored for Ladder Capital that uncovers competitive drivers, buyer/supplier power, entry barriers, substitutes and disruptive threats, with strategic implications for pricing and market positioning.
Customizable Excel Spreadsheet
One-sheet Porter's Five Forces for Ladder Capital that instantly maps competitive pressure with a radar chart and customizable force levels—clean, slide-ready layout requiring no macros and easy to plug into Excel or Word reports for rapid strategic decisions.
Customers Bargaining Power
Financial sponsor sophistication
Institutional borrowers quickly benchmark loan terms across lenders, using market data and secondary spreads to press for better pricing. Their sophistication strengthens negotiation on spreads, structure, and covenants, intensifying pressure on lenders amid a higher-rate environment (Fed funds target 5.25–5.50% in 2024). In competitive markets this compresses margins. Differentiation via speed and certainty of execution offsets some of that bargaining power.
Many alternative lenders
Sponsors routinely solicit bids from banks, debt funds, REITs and insurers, and with global private debt AUM > $1 trillion in 2024 the pool of alternative lenders amplifies buyer leverage on pricing and proceeds. Tight credit cycles can temporarily reduce that power, but Ladder’s senior-first focus and flexible structures help it secure mandates despite downward price pressure.
Sensitivity to rate environment
Rising base rates (fed funds near 5.25–5.50% in 2024) push borrowers to demand lower all-in costs and protections, increasing buyer power during volatile rate regimes. Borrowers commonly negotiate 25–75 bps tighter spreads, interest-only periods and rate caps (caps often 20–100 bps). Providing hedging guidance and swap/cap solutions preserves Ladder Capital economics while meeting client needs.
Deal timing pressures
Closing deadlines on acquisitions or refinancings often compress into 30–45 days, shifting leverage to lenders who can charge 100–300 basis points for speed; when marketing stretches beyond 6–12 months buyers typically regain negotiating power. Ladder’s ability to underwrite in roughly 2–4 weeks acts as a counterweight, allowing it to capture spread and control terms.
- Deal windows: 30–45 days
- Speed premium: 100–300 bps
- Long marketing: 6–12 months
- Ladder underwriting: ~2–4 weeks
Credit quality dispersion
Core, stabilized assets with strong sponsors command the best terms in 2024, giving buyers of those loans higher bargaining power, while transitional or niche assets reduce buyer leverage because fewer lenders are eligible. Ladder prices these power differentials through risk-adjusted spreads and targeted underwriting.
- Buyer leverage: higher for stabilized
- Transitional: fewer bidders, lower leverage
- Ladder: risk-adjusted spreads
Borrowers push >$1T debt; Fed 5.25–5.50% boosts hedging
Institutional borrowers use market spreads and >$1T private debt AUM (2024) to push for tighter pricing and covenants, compressing margins; Ladder offsets with speed and senior-first structures. Rate volatility (Fed 5.25–5.50% 2024) raises demand for caps/swaps. Stabilized assets see higher buyer leverage; transitional assets reduce it.
| Metric | 2024 |
|---|---|
| Private debt AUM | $1T+ |
| Fed funds | 5.25–5.50% |
| Speed premium | 100–300bps |
What You See Is What You Get
Ladder Capital Porter's Five Forces Analysis
This preview is the exact Ladder Capital Porter's Five Forces analysis you'll receive after purchase—fully formatted, complete, and ready for use. It outlines supplier and buyer power, competitive rivalry, threats of entry and substitution, and strategic implications. No placeholders or samples—instant access to this same file upon payment.
Original: $10.00
-65%$10.00
$3.50Description
Go Beyond the Preview—Access the Full Strategic Report
Ladder Capital’s Porter's Five Forces snapshot highlights buyer and lender power, competitive rivalry, and emerging substitute and entrant risks shaping its CRE finance standing. It outlines strategic advantages and key market pressures in summary form. Ready for actionable depth? Unlock the full, consultant-grade analysis with force ratings, visuals, and ready-to-use Word/Excel deliverables.
Suppliers Bargaining Power
Concentration of capital providers
Warehouse lenders, repo counterparties and secured financing providers are concentrated among big banks and broker-dealers; the top 5 U.S. banks held roughly 45% of commercial banking assets in 2024, tightening access in risk-off periods. Limited alternatives can force wider spreads and higher collateral haircuts, raising funding costs and reducing flexibility. Ladder mitigates this via diversified warehouse facilities and regular unsecured debt issuance to broaden funding sources.
Dependence on securitization markets
Dependence on CMBS/CLO take-outs is critical for recycling capital and managing duration; 2024 U.S. CMBS issuance (~$60B) underscores how pivotal these markets are. When conduit/CMBS spreads widen or issuance stalls, execution risk rises and margins compress, increasing capital markets’ supplier power. This cyclicality elevates lender vulnerability, though strong underwriting and loan seasoning can improve eligibility and pricing.
Rating agencies and trustees
Rating agencies and trustees drive advance rates and covenant costs, and market guidance tightened in 2023–24 with advance rates roughly 10% lower versus peak cycles, constraining Ladder Capital’s leverage and loan pool mix. Stricter criteria in downturns force higher credit enhancements and reduce eligible collateral, indirectly boosting suppliers’ bargaining leverage. Proactive engagement and transparent loan-level data have reduced transactional frictions and pricing premia.
Brokerage and deal-flow intermediaries
Loan brokers and advisors can steer sponsors toward lenders that pay higher placement fees or accept looser covenants; industry placement fees typically range 0.5–2% of loan amount, which compresses net yields. Concentrated intermediaries increase acquisition costs and lower lender returns, while direct sponsor relationships let Ladder bypass such fees; Ladder’s repeat-borrower strategy reduces broker dependence.
- Broker fees: 0.5–2%
- Higher fees → lower yields
- Concentrated intermediaries raise acquisition costs
- Repeat-borrower focus cuts broker reliance
Data, servicing, and legal vendors
Specialized diligence, servicing, and legal providers are required for complex CRE assets, and in 2024 these niche firms continued to command pricing premiums for sector-specific expertise. High switching costs and capacity constraints increase supplier bargaining power by extending timelines and raising replacement costs. Multi-vendor panels and standardized documentation are common mitigants that temper pricing pressure.
Bank concentration raises funding costs; top 5 hold ~45% of assets
Supplier power is elevated: top 5 banks held ~45% of U.S. commercial banking assets in 2024, concentrating warehouse/repo capacity and raising funding costs in risk-off periods. U.S. CMBS issuance was ~60B in 2024, making CMBS/CLO take-outs critical; broker fees (0.5–2%) and ~10% lower advance rates vs cycle peaks tighten margins. Ladder offsets via diversified warehouses, unsecured issuance and repeat-borrower focus.
| Metric | 2024 | Impact |
|---|---|---|
| Top-5 bank share | ~45% | Concentrated funding |
| CMBS issuance | $60B | Take-out dependency |
| Broker fees | 0.5–2% | Yield compression |
| Advance rates vs peak | ~-10% | Lower leverage |
What is included in the product
Detailed Word Document
Concise Porter's Five Forces analysis tailored for Ladder Capital that uncovers competitive drivers, buyer/supplier power, entry barriers, substitutes and disruptive threats, with strategic implications for pricing and market positioning.
Customizable Excel Spreadsheet
One-sheet Porter's Five Forces for Ladder Capital that instantly maps competitive pressure with a radar chart and customizable force levels—clean, slide-ready layout requiring no macros and easy to plug into Excel or Word reports for rapid strategic decisions.
Customers Bargaining Power
Financial sponsor sophistication
Institutional borrowers quickly benchmark loan terms across lenders, using market data and secondary spreads to press for better pricing. Their sophistication strengthens negotiation on spreads, structure, and covenants, intensifying pressure on lenders amid a higher-rate environment (Fed funds target 5.25–5.50% in 2024). In competitive markets this compresses margins. Differentiation via speed and certainty of execution offsets some of that bargaining power.
Many alternative lenders
Sponsors routinely solicit bids from banks, debt funds, REITs and insurers, and with global private debt AUM > $1 trillion in 2024 the pool of alternative lenders amplifies buyer leverage on pricing and proceeds. Tight credit cycles can temporarily reduce that power, but Ladder’s senior-first focus and flexible structures help it secure mandates despite downward price pressure.
Sensitivity to rate environment
Rising base rates (fed funds near 5.25–5.50% in 2024) push borrowers to demand lower all-in costs and protections, increasing buyer power during volatile rate regimes. Borrowers commonly negotiate 25–75 bps tighter spreads, interest-only periods and rate caps (caps often 20–100 bps). Providing hedging guidance and swap/cap solutions preserves Ladder Capital economics while meeting client needs.
Deal timing pressures
Closing deadlines on acquisitions or refinancings often compress into 30–45 days, shifting leverage to lenders who can charge 100–300 basis points for speed; when marketing stretches beyond 6–12 months buyers typically regain negotiating power. Ladder’s ability to underwrite in roughly 2–4 weeks acts as a counterweight, allowing it to capture spread and control terms.
- Deal windows: 30–45 days
- Speed premium: 100–300 bps
- Long marketing: 6–12 months
- Ladder underwriting: ~2–4 weeks
Credit quality dispersion
Core, stabilized assets with strong sponsors command the best terms in 2024, giving buyers of those loans higher bargaining power, while transitional or niche assets reduce buyer leverage because fewer lenders are eligible. Ladder prices these power differentials through risk-adjusted spreads and targeted underwriting.
- Buyer leverage: higher for stabilized
- Transitional: fewer bidders, lower leverage
- Ladder: risk-adjusted spreads
Borrowers push >$1T debt; Fed 5.25–5.50% boosts hedging
Institutional borrowers use market spreads and >$1T private debt AUM (2024) to push for tighter pricing and covenants, compressing margins; Ladder offsets with speed and senior-first structures. Rate volatility (Fed 5.25–5.50% 2024) raises demand for caps/swaps. Stabilized assets see higher buyer leverage; transitional assets reduce it.
| Metric | 2024 |
|---|---|
| Private debt AUM | $1T+ |
| Fed funds | 5.25–5.50% |
| Speed premium | 100–300bps |
What You See Is What You Get
Ladder Capital Porter's Five Forces Analysis
This preview is the exact Ladder Capital Porter's Five Forces analysis you'll receive after purchase—fully formatted, complete, and ready for use. It outlines supplier and buyer power, competitive rivalry, threats of entry and substitution, and strategic implications. No placeholders or samples—instant access to this same file upon payment.











