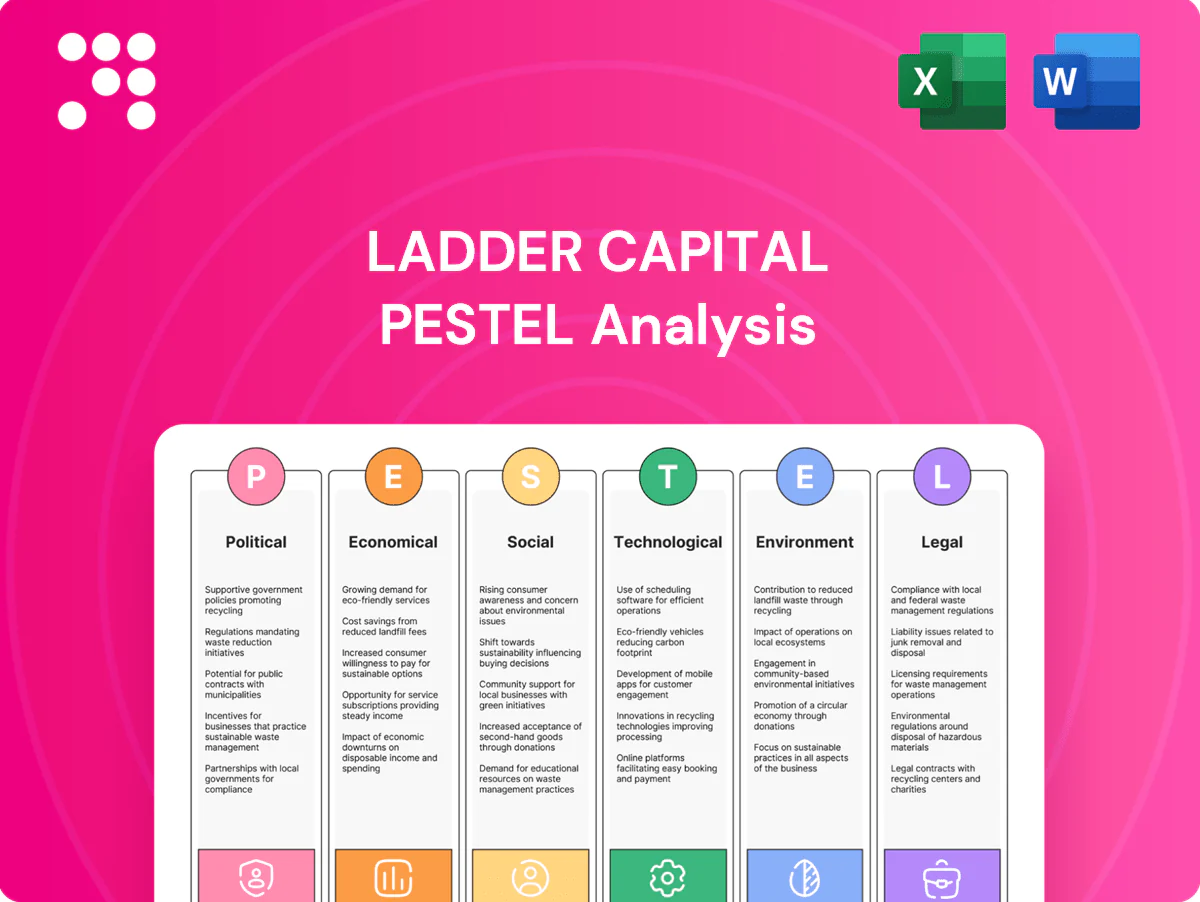
Ladder Capital PESTLE Analysis

Plan Smarter. Present Sharper. Compete Stronger.
Discover how political shifts, economic cycles, and regulatory trends are reshaping Ladder Capital’s strategic outlook in our concise PESTLE snapshot—ideal for investors and strategists. Buy the full analysis to unlock detailed risk assessments, growth levers, and actionable recommendations ready for immediate use.
Political factors

REIT tax regime stability
REIT pass-through status drives Ladder Capital (ticker LADR) dividend policy and cost of capital, as REITs must distribute at least 90% of taxable income to shareholders to retain tax treatment; any change to dividend deductibility, minimum payout rules, or prohibited transactions could materially alter returns. Monitoring Congressional tax packages and IRS guidance is critical, since policy stability supports predictable capital planning and financing decisions.
Federal housing and CRE policy
Shifts toward affordable housing and office-to-residential conversions reshape Ladder Capital’s lending pipeline as national office vacancy rose to about 17% in 2024, boosting conversion demand. Expansion of federal credit support, with FHA multifamily insurance outstanding exceeding $100 billion in 2024, can compress spreads and increase competition. Tighter prudential scrutiny of CRE exposures and higher capital expectations have tempered bank CRE supply, shifting Ladder’s origination mix and risk appetite.

Local zoning and permitting dynamics
City-level approvals directly affect Ladder Capital collateral values and timelines, with U.S. building permits at 1,516,000 units in 2023 (U.S. Census Bureau) underscoring permitting volatility. Restrictive zoning or political pushback lengthens redevelopment timelines and raises completion risk. Pro-growth municipalities boost NOI expansion and refinanceability. Geographic selection across receptive MSAs reduces political execution risk.

Infrastructure and public investment
Transit, broadband and resilience spending raise asset productivity and valuations; the Bipartisan Infrastructure Law’s $550 billion plus BEAD’s $42.45 billion broadband fund in 2024 boost demand and tenant retention, strengthening leasing and rent trajectories in beneficiary markets and improving DSCR and exit liquidity for mortgages while upgrading collateral quality.
- Transit-led markets: higher leasing, outsized rent growth
- Broadband beneficiaries: lower vacancy, higher NOI
- Resilience-funded areas: reduced loss severity, stronger exit liquidity
Geopolitical capital flows
Policy shifts on foreign investment—CFIUS expanded under FIRRMA (2018), with filings and state-level scrutiny rising—have thinned property bid depth and contributed to cross-border CRE flows hitting a decade low in 2023 per Real Capital Analytics; reduced foreign capital has widened cap rates and credit spreads, while safe-haven inflows (foreign holdings of US Treasuries ~7.2 trillion USD in 2024) bolster takeout markets and securitization execution.
- CFIUS/FIRRMA: higher scrutiny reduces bidder depth
- Cross-border CRE: decade-low flows in 2023 (RCA)
- Cap rates/credit spreads: widen with reduced foreign capital
- Safe-haven inflows (~$7.2T foreign Treasuries 2024): strengthen refinancing/securitization
REIT pass-throughs, 17% office vacancy and >$100B FHA tighten CRE lending
REIT pass-through rules dictate Ladder Capital’s payout and cost of capital; tax or payout changes would materially affect returns. Office vacancy ~17% in 2024 shifts lending to conversions and stabilizes origination mix. FHA multifamily insurance >$100B (2024) and tighter CRE oversight reduce bank supply, boosting non-bank lenders. Reduced cross-border CRE flows (decade low 2023) widen cap rates; foreign Treasuries holdings ~$7.2T (2024) support securitization.
| Indicator | Value | Yr |
|---|---|---|
| U.S. office vacancy | ~17% | 2024 |
| FHA multifamily insurance | >$100B | 2024 |
| U.S. building permits | 1,516,000 units | 2023 |
| Foreign holdings of UST | ~$7.2T | 2024 |
What is included in the product
 Detailed Word Document
Explores how Political, Economic, Social, Technological, Environmental and Legal forces uniquely impact Ladder Capital, with data-backed trends and industry-specific examples informing risk and opportunity assessment. Designed for executives and investors, it includes forward-looking insights to support scenario planning and funding strategies.

 Customizable Excel Spreadsheet
A concise, visually segmented PESTLE summary for Ladder Capital that eases stakeholder alignment, is editable for regional or business-line notes, and ready to drop into presentations or share across teams.
Economic factors

Interest rates and yield curve
Funding costs and loan coupons for Ladder Capital hinge on Fed policy and curve shape; the federal funds target sat near 5.25–5.50% in H1 2025. Yield-curve inversion (2s10s around −15 bps mid-2025) compresses net interest margins on floating-rate loans funded short. Curve normalization would support term lending and securitization, while disciplined hedging is essential to stabilize returns.
Credit spreads and liquidity
CMBS AAA spreads traded near 140 bps in H1 2025 while lower tranches widened to 400–500 bps, and CRE CLO spreads clustered around 180–300 bps, which set secondary pricing and origination ROEs for Ladder Capital. Liquidity swings have moved gain-on-sale economics by hundreds of basis points and stressed warehouse viability. Wider spreads favor de-risked senior loans with LTVs ≤60%. Tight markets enable volume growth but compress margins by ~100–200 bps.

Property market fundamentals
Property fundamentals show divergent NOI: office NOI fell roughly 12% YoY into 2024 with national vacancy near 17%, raising refinance and extension pressure; industrial NOI rose about 9% supporting borrower cashflows; Sunbelt multifamily NOI improved ~7%, aiding stable paydowns; retail remains mixed but recovering slowly. Sector rotation into industrial and Sunbelt multifamily can preserve Ladder Capital portfolio performance.

Refinancing wall and maturities
Large 2025–2027 CRE maturities are driving demand for bridge and senior loans as borrowers confront refinancing amid Fed funds at 5.25–5.50% (mid‑2025); higher rates compress DSCR and tighten LTV cushions, often requiring fresh equity or structural tweaks, while well‑underwritten first mortgages command pricing power and workout expertise is a clear competitive edge.
- 2025–2027 maturities pressure liquidity
- Fed funds 5.25–5.50% increases refinancing costs
- DSCR/LTV stress raises equity/structure needs
- First mortgages gain pricing leverage
- Workout capability differentiator
Inflation and construction costs
Sticky operating expenses, with US headline CPI at 3.3% year-over-year (June 2025), continue to compress Ladder Capital property margins as wage and maintenance costs remain elevated; replacement costs rose alongside construction inputs, with the ENR construction cost index up about 5.2% in 2024, supporting valuations but delaying new projects.
- Inflation-linked rents offset pressure in select assets
- Underwrite 3-5%+ expense growth and elevated capex
- Higher replacement costs bolster NAV but extend timelines
REIT pass-throughs, 17% office vacancy and >$100B FHA tighten CRE lending
Higher Fed funds (5.25–5.50% H1 2025) and a mildly inverted curve (2s10s ≈ −15bps) squeeze funding costs and NIMs, making disciplined hedging and term funding crucial. CMBS/CLO spread volatility (AAA ≈140bps; lower tranches 400–500bps) shifts GO‑sale economics; sector performance (office −12% NOI, industrial +9%, Sunbelt multifamily +7%) drives underwriting focus and workout demand.
| Metric | Value |
|---|---|
| Fed funds | 5.25–5.50% |
| 2s10s | −15bps |
| CMBS AAA | 140bps |
| Office NOI | −12% YoY |
| Industrial NOI | +9% YoY |
| CPI (Jun 2025) | 3.3% YoY |
Full Version Awaits
Ladder Capital PESTLE Analysis
The preview shown here is the exact Ladder Capital PESTLE Analysis document you’ll receive after purchase—fully formatted and ready to use. It contains the complete PESTLE assessment, structured insights, and professional formatting with no placeholders or teasers. After payment you’ll instantly download this exact final file, ready for immediate application.

Plan Smarter. Present Sharper. Compete Stronger.
Discover how political shifts, economic cycles, and regulatory trends are reshaping Ladder Capital’s strategic outlook in our concise PESTLE snapshot—ideal for investors and strategists. Buy the full analysis to unlock detailed risk assessments, growth levers, and actionable recommendations ready for immediate use.
Political factors
REIT tax regime stability
REIT pass-through status drives Ladder Capital (ticker LADR) dividend policy and cost of capital, as REITs must distribute at least 90% of taxable income to shareholders to retain tax treatment; any change to dividend deductibility, minimum payout rules, or prohibited transactions could materially alter returns. Monitoring Congressional tax packages and IRS guidance is critical, since policy stability supports predictable capital planning and financing decisions.
Federal housing and CRE policy
Shifts toward affordable housing and office-to-residential conversions reshape Ladder Capital’s lending pipeline as national office vacancy rose to about 17% in 2024, boosting conversion demand. Expansion of federal credit support, with FHA multifamily insurance outstanding exceeding $100 billion in 2024, can compress spreads and increase competition. Tighter prudential scrutiny of CRE exposures and higher capital expectations have tempered bank CRE supply, shifting Ladder’s origination mix and risk appetite.
Local zoning and permitting dynamics
City-level approvals directly affect Ladder Capital collateral values and timelines, with U.S. building permits at 1,516,000 units in 2023 (U.S. Census Bureau) underscoring permitting volatility. Restrictive zoning or political pushback lengthens redevelopment timelines and raises completion risk. Pro-growth municipalities boost NOI expansion and refinanceability. Geographic selection across receptive MSAs reduces political execution risk.
Infrastructure and public investment
Transit, broadband and resilience spending raise asset productivity and valuations; the Bipartisan Infrastructure Law’s $550 billion plus BEAD’s $42.45 billion broadband fund in 2024 boost demand and tenant retention, strengthening leasing and rent trajectories in beneficiary markets and improving DSCR and exit liquidity for mortgages while upgrading collateral quality.
- Transit-led markets: higher leasing, outsized rent growth
- Broadband beneficiaries: lower vacancy, higher NOI
- Resilience-funded areas: reduced loss severity, stronger exit liquidity
Geopolitical capital flows
Policy shifts on foreign investment—CFIUS expanded under FIRRMA (2018), with filings and state-level scrutiny rising—have thinned property bid depth and contributed to cross-border CRE flows hitting a decade low in 2023 per Real Capital Analytics; reduced foreign capital has widened cap rates and credit spreads, while safe-haven inflows (foreign holdings of US Treasuries ~7.2 trillion USD in 2024) bolster takeout markets and securitization execution.
- CFIUS/FIRRMA: higher scrutiny reduces bidder depth
- Cross-border CRE: decade-low flows in 2023 (RCA)
- Cap rates/credit spreads: widen with reduced foreign capital
- Safe-haven inflows (~$7.2T foreign Treasuries 2024): strengthen refinancing/securitization
REIT pass-throughs, 17% office vacancy and >$100B FHA tighten CRE lending
REIT pass-through rules dictate Ladder Capital’s payout and cost of capital; tax or payout changes would materially affect returns. Office vacancy ~17% in 2024 shifts lending to conversions and stabilizes origination mix. FHA multifamily insurance >$100B (2024) and tighter CRE oversight reduce bank supply, boosting non-bank lenders. Reduced cross-border CRE flows (decade low 2023) widen cap rates; foreign Treasuries holdings ~$7.2T (2024) support securitization.
| Indicator | Value | Yr |
|---|---|---|
| U.S. office vacancy | ~17% | 2024 |
| FHA multifamily insurance | >$100B | 2024 |
| U.S. building permits | 1,516,000 units | 2023 |
| Foreign holdings of UST | ~$7.2T | 2024 |
What is included in the product
Detailed Word Document
Explores how Political, Economic, Social, Technological, Environmental and Legal forces uniquely impact Ladder Capital, with data-backed trends and industry-specific examples informing risk and opportunity assessment. Designed for executives and investors, it includes forward-looking insights to support scenario planning and funding strategies.
Customizable Excel Spreadsheet
A concise, visually segmented PESTLE summary for Ladder Capital that eases stakeholder alignment, is editable for regional or business-line notes, and ready to drop into presentations or share across teams.
Economic factors
Interest rates and yield curve
Funding costs and loan coupons for Ladder Capital hinge on Fed policy and curve shape; the federal funds target sat near 5.25–5.50% in H1 2025. Yield-curve inversion (2s10s around −15 bps mid-2025) compresses net interest margins on floating-rate loans funded short. Curve normalization would support term lending and securitization, while disciplined hedging is essential to stabilize returns.
Credit spreads and liquidity
CMBS AAA spreads traded near 140 bps in H1 2025 while lower tranches widened to 400–500 bps, and CRE CLO spreads clustered around 180–300 bps, which set secondary pricing and origination ROEs for Ladder Capital. Liquidity swings have moved gain-on-sale economics by hundreds of basis points and stressed warehouse viability. Wider spreads favor de-risked senior loans with LTVs ≤60%. Tight markets enable volume growth but compress margins by ~100–200 bps.
Property market fundamentals
Property fundamentals show divergent NOI: office NOI fell roughly 12% YoY into 2024 with national vacancy near 17%, raising refinance and extension pressure; industrial NOI rose about 9% supporting borrower cashflows; Sunbelt multifamily NOI improved ~7%, aiding stable paydowns; retail remains mixed but recovering slowly. Sector rotation into industrial and Sunbelt multifamily can preserve Ladder Capital portfolio performance.
Refinancing wall and maturities
Large 2025–2027 CRE maturities are driving demand for bridge and senior loans as borrowers confront refinancing amid Fed funds at 5.25–5.50% (mid‑2025); higher rates compress DSCR and tighten LTV cushions, often requiring fresh equity or structural tweaks, while well‑underwritten first mortgages command pricing power and workout expertise is a clear competitive edge.
- 2025–2027 maturities pressure liquidity
- Fed funds 5.25–5.50% increases refinancing costs
- DSCR/LTV stress raises equity/structure needs
- First mortgages gain pricing leverage
- Workout capability differentiator
Inflation and construction costs
Sticky operating expenses, with US headline CPI at 3.3% year-over-year (June 2025), continue to compress Ladder Capital property margins as wage and maintenance costs remain elevated; replacement costs rose alongside construction inputs, with the ENR construction cost index up about 5.2% in 2024, supporting valuations but delaying new projects.
- Inflation-linked rents offset pressure in select assets
- Underwrite 3-5%+ expense growth and elevated capex
- Higher replacement costs bolster NAV but extend timelines
REIT pass-throughs, 17% office vacancy and >$100B FHA tighten CRE lending
Higher Fed funds (5.25–5.50% H1 2025) and a mildly inverted curve (2s10s ≈ −15bps) squeeze funding costs and NIMs, making disciplined hedging and term funding crucial. CMBS/CLO spread volatility (AAA ≈140bps; lower tranches 400–500bps) shifts GO‑sale economics; sector performance (office −12% NOI, industrial +9%, Sunbelt multifamily +7%) drives underwriting focus and workout demand.
| Metric | Value |
|---|---|
| Fed funds | 5.25–5.50% |
| 2s10s | −15bps |
| CMBS AAA | 140bps |
| Office NOI | −12% YoY |
| Industrial NOI | +9% YoY |
| CPI (Jun 2025) | 3.3% YoY |
Full Version Awaits
Ladder Capital PESTLE Analysis
The preview shown here is the exact Ladder Capital PESTLE Analysis document you’ll receive after purchase—fully formatted and ready to use. It contains the complete PESTLE assessment, structured insights, and professional formatting with no placeholders or teasers. After payment you’ll instantly download this exact final file, ready for immediate application.
Description
Plan Smarter. Present Sharper. Compete Stronger.
Discover how political shifts, economic cycles, and regulatory trends are reshaping Ladder Capital’s strategic outlook in our concise PESTLE snapshot—ideal for investors and strategists. Buy the full analysis to unlock detailed risk assessments, growth levers, and actionable recommendations ready for immediate use.
Political factors
REIT tax regime stability
REIT pass-through status drives Ladder Capital (ticker LADR) dividend policy and cost of capital, as REITs must distribute at least 90% of taxable income to shareholders to retain tax treatment; any change to dividend deductibility, minimum payout rules, or prohibited transactions could materially alter returns. Monitoring Congressional tax packages and IRS guidance is critical, since policy stability supports predictable capital planning and financing decisions.
Federal housing and CRE policy
Shifts toward affordable housing and office-to-residential conversions reshape Ladder Capital’s lending pipeline as national office vacancy rose to about 17% in 2024, boosting conversion demand. Expansion of federal credit support, with FHA multifamily insurance outstanding exceeding $100 billion in 2024, can compress spreads and increase competition. Tighter prudential scrutiny of CRE exposures and higher capital expectations have tempered bank CRE supply, shifting Ladder’s origination mix and risk appetite.
Local zoning and permitting dynamics
City-level approvals directly affect Ladder Capital collateral values and timelines, with U.S. building permits at 1,516,000 units in 2023 (U.S. Census Bureau) underscoring permitting volatility. Restrictive zoning or political pushback lengthens redevelopment timelines and raises completion risk. Pro-growth municipalities boost NOI expansion and refinanceability. Geographic selection across receptive MSAs reduces political execution risk.
Infrastructure and public investment
Transit, broadband and resilience spending raise asset productivity and valuations; the Bipartisan Infrastructure Law’s $550 billion plus BEAD’s $42.45 billion broadband fund in 2024 boost demand and tenant retention, strengthening leasing and rent trajectories in beneficiary markets and improving DSCR and exit liquidity for mortgages while upgrading collateral quality.
- Transit-led markets: higher leasing, outsized rent growth
- Broadband beneficiaries: lower vacancy, higher NOI
- Resilience-funded areas: reduced loss severity, stronger exit liquidity
Geopolitical capital flows
Policy shifts on foreign investment—CFIUS expanded under FIRRMA (2018), with filings and state-level scrutiny rising—have thinned property bid depth and contributed to cross-border CRE flows hitting a decade low in 2023 per Real Capital Analytics; reduced foreign capital has widened cap rates and credit spreads, while safe-haven inflows (foreign holdings of US Treasuries ~7.2 trillion USD in 2024) bolster takeout markets and securitization execution.
- CFIUS/FIRRMA: higher scrutiny reduces bidder depth
- Cross-border CRE: decade-low flows in 2023 (RCA)
- Cap rates/credit spreads: widen with reduced foreign capital
- Safe-haven inflows (~$7.2T foreign Treasuries 2024): strengthen refinancing/securitization
REIT pass-throughs, 17% office vacancy and >$100B FHA tighten CRE lending
REIT pass-through rules dictate Ladder Capital’s payout and cost of capital; tax or payout changes would materially affect returns. Office vacancy ~17% in 2024 shifts lending to conversions and stabilizes origination mix. FHA multifamily insurance >$100B (2024) and tighter CRE oversight reduce bank supply, boosting non-bank lenders. Reduced cross-border CRE flows (decade low 2023) widen cap rates; foreign Treasuries holdings ~$7.2T (2024) support securitization.
| Indicator | Value | Yr |
|---|---|---|
| U.S. office vacancy | ~17% | 2024 |
| FHA multifamily insurance | >$100B | 2024 |
| U.S. building permits | 1,516,000 units | 2023 |
| Foreign holdings of UST | ~$7.2T | 2024 |
What is included in the product
Detailed Word Document
Explores how Political, Economic, Social, Technological, Environmental and Legal forces uniquely impact Ladder Capital, with data-backed trends and industry-specific examples informing risk and opportunity assessment. Designed for executives and investors, it includes forward-looking insights to support scenario planning and funding strategies.
Customizable Excel Spreadsheet
A concise, visually segmented PESTLE summary for Ladder Capital that eases stakeholder alignment, is editable for regional or business-line notes, and ready to drop into presentations or share across teams.
Economic factors
Interest rates and yield curve
Funding costs and loan coupons for Ladder Capital hinge on Fed policy and curve shape; the federal funds target sat near 5.25–5.50% in H1 2025. Yield-curve inversion (2s10s around −15 bps mid-2025) compresses net interest margins on floating-rate loans funded short. Curve normalization would support term lending and securitization, while disciplined hedging is essential to stabilize returns.
Credit spreads and liquidity
CMBS AAA spreads traded near 140 bps in H1 2025 while lower tranches widened to 400–500 bps, and CRE CLO spreads clustered around 180–300 bps, which set secondary pricing and origination ROEs for Ladder Capital. Liquidity swings have moved gain-on-sale economics by hundreds of basis points and stressed warehouse viability. Wider spreads favor de-risked senior loans with LTVs ≤60%. Tight markets enable volume growth but compress margins by ~100–200 bps.
Property market fundamentals
Property fundamentals show divergent NOI: office NOI fell roughly 12% YoY into 2024 with national vacancy near 17%, raising refinance and extension pressure; industrial NOI rose about 9% supporting borrower cashflows; Sunbelt multifamily NOI improved ~7%, aiding stable paydowns; retail remains mixed but recovering slowly. Sector rotation into industrial and Sunbelt multifamily can preserve Ladder Capital portfolio performance.
Refinancing wall and maturities
Large 2025–2027 CRE maturities are driving demand for bridge and senior loans as borrowers confront refinancing amid Fed funds at 5.25–5.50% (mid‑2025); higher rates compress DSCR and tighten LTV cushions, often requiring fresh equity or structural tweaks, while well‑underwritten first mortgages command pricing power and workout expertise is a clear competitive edge.
- 2025–2027 maturities pressure liquidity
- Fed funds 5.25–5.50% increases refinancing costs
- DSCR/LTV stress raises equity/structure needs
- First mortgages gain pricing leverage
- Workout capability differentiator
Inflation and construction costs
Sticky operating expenses, with US headline CPI at 3.3% year-over-year (June 2025), continue to compress Ladder Capital property margins as wage and maintenance costs remain elevated; replacement costs rose alongside construction inputs, with the ENR construction cost index up about 5.2% in 2024, supporting valuations but delaying new projects.
- Inflation-linked rents offset pressure in select assets
- Underwrite 3-5%+ expense growth and elevated capex
- Higher replacement costs bolster NAV but extend timelines
REIT pass-throughs, 17% office vacancy and >$100B FHA tighten CRE lending
Higher Fed funds (5.25–5.50% H1 2025) and a mildly inverted curve (2s10s ≈ −15bps) squeeze funding costs and NIMs, making disciplined hedging and term funding crucial. CMBS/CLO spread volatility (AAA ≈140bps; lower tranches 400–500bps) shifts GO‑sale economics; sector performance (office −12% NOI, industrial +9%, Sunbelt multifamily +7%) drives underwriting focus and workout demand.
| Metric | Value |
|---|---|
| Fed funds | 5.25–5.50% |
| 2s10s | −15bps |
| CMBS AAA | 140bps |
| Office NOI | −12% YoY |
| Industrial NOI | +9% YoY |
| CPI (Jun 2025) | 3.3% YoY |
Full Version Awaits
Ladder Capital PESTLE Analysis
The preview shown here is the exact Ladder Capital PESTLE Analysis document you’ll receive after purchase—fully formatted and ready to use. It contains the complete PESTLE assessment, structured insights, and professional formatting with no placeholders or teasers. After payment you’ll instantly download this exact final file, ready for immediate application.











