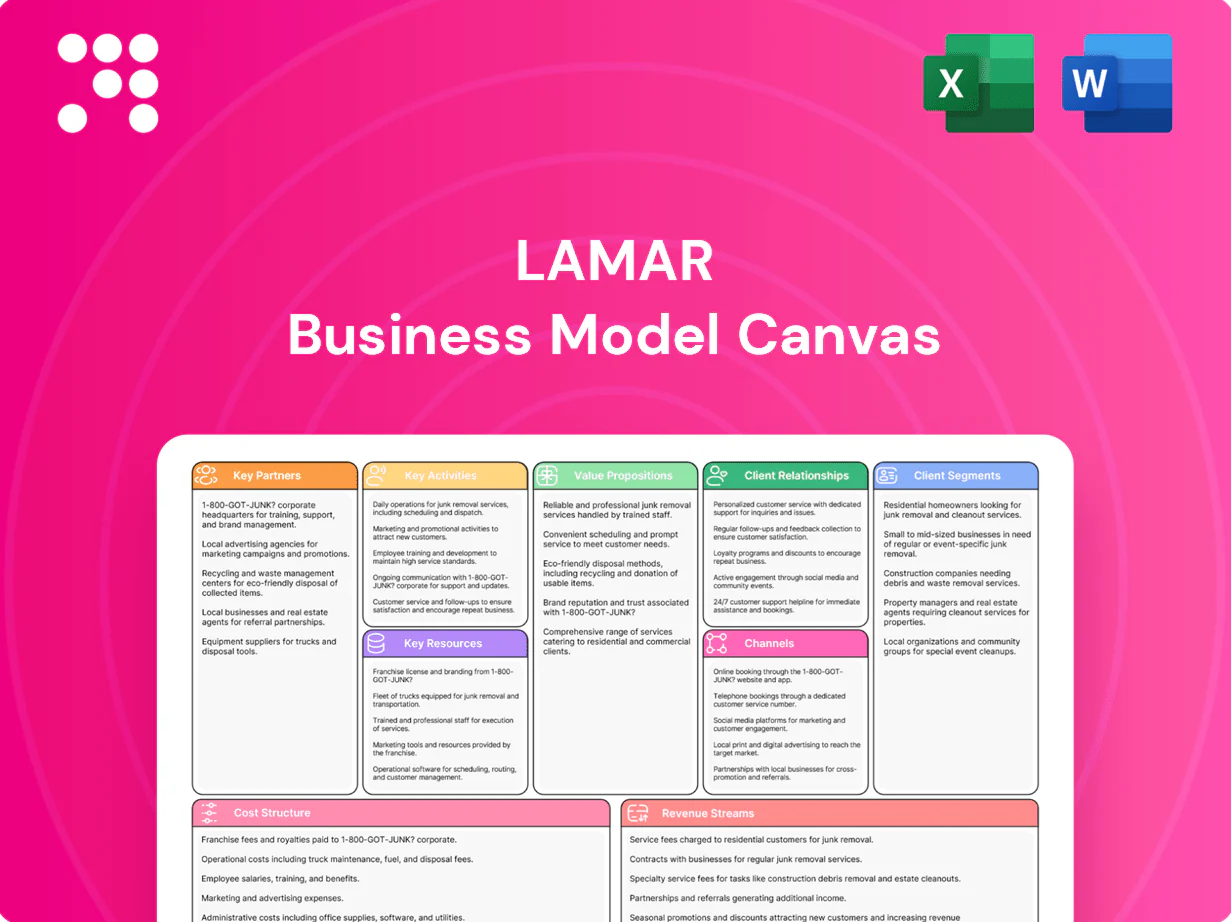
Lamar Business Model Canvas

Strategic blueprint: value propositions, revenue levers, growth tactics.
Unlock the full strategic blueprint behind Lamar’s business model—discover its value propositions, revenue levers, and growth tactics in one actionable canvas. Perfect for investors, consultants, and founders who want a ready-to-use roadmap. Purchase the complete Word/Excel pack to benchmark, adapt, and scale with confidence.
Partnerships

Property owners & municipalities
Access to land and building facades underpins Lamar’s inventory scale—about 372,000+ outdoor displays in 2024—driving location quality and ad reach. Long-term ground leases and permits, typically 20–50 years, secure footprint stability and predictable cash flows. Strong municipal relationships ensure compliance with zoning and sign ordinances, limiting legal disruptions. Ongoing community engagement preserves goodwill and supports renewal prospects.
Transit & airport authorities
Exclusive concessions with transit and airport authorities enable Lamar to place ads on buses, shelters, rail and terminals, leveraging its ~353,000 displays and reported 2024 revenue of about $2.27 billion to reach commuter and traveler audiences. Revenue-share contracts align incentives and expand reach while operations must meet strict safety and aesthetic standards. Concession renewals drive continuity and growth.

Agencies & media buyers
Agencies and media buyers aggregate demand from national and regional brands, leveraging Lamar’s 360,000+ displays (2024) to scale reach across markets. Preferred-vendor status and upfront deals improve inventory utilization and revenue predictability. Collaborative planning delivers cross-market, multi-format campaigns, while centralized billing and trafficking streamline execution with single-invoice and unified ad ops workflows.

Ad-tech, data & measurement partners
Ad-tech, data and measurement partners supply location data, audience modeling and attribution tools that validate outcomes and lift DOOH ROI; programmatic DOOH integrations with DSPs/SSPs enabled roughly 30–40% of buys in 2024, accelerating scale. Proof-of-play and impression verification drove a measurable trust uplift, while privacy-compliant data governance met CCPA/CPRA and GDPR requirements.
- Location data: enhances targeting and ROI
- Audience modeling: refines reach and frequency
- Attribution & verification: proof-of-play builds trust
- DSP/SSP integrations: enable programmatic scale
- Privacy-compliant data: ensures brand safety
Fabrication, installation & service vendors
Third-party crews build, wrap and maintain Lamar structures at scale while specialized vendors manage high-mast, electrical and digital screen installations. Service-level agreements target 99% screen uptime and 48-hour creative swaps to maximize revenue availability. Centralized, cost-efficient logistics cut downtime and minimize truck rolls, improving installation velocity and OOH yield.
≈372,000 displays, long leases and predictable cash flow; 2024 revenue $2.27B
Lamar’s scale (≈372,000 displays in 2024) and long-term leases (20–50 yrs) secure footprint and predictable cash flow; 2024 revenue ≈ $2.27B. Transit/airport concessions and agency partnerships drive reach; programmatic DOOH ~30–40% of buys in 2024. Ops rely on 3rd-party crews with SLAs (99% uptime; 48‑hr swaps) to maximize revenue.
| Metric | 2024 Value |
|---|---|
| Displays | ≈372,000 |
| Revenue | $2.27B |
| Programmatic Mix | 30–40% |
| Uptime SLA | 99% |
What is included in the product
 Detailed Word Document
A concise, pre-written Business Model Canvas for Lamar detailing customer segments, value propositions, channels, revenue streams and the nine BMC blocks with real-world operational context. Ideal for presentations, investor discussions and includes SWOT-linked insights and competitive advantages to support validation and strategic decisions.

 Customizable Excel Spreadsheet
High-level Lamar Business Model Canvas provides a clean, editable one-page snapshot that relieves the pain of scattered planning by consolidating key components for fast alignment and decision-making.
Activities

Site acquisition & permitting
Identify high-traffic locations and negotiate leases focusing on corridors and transit hubs, leveraging Lamar’s portfolio of roughly 360,000 displays to secure premium placements. Navigate zoning, variances, and environmental reviews with local agencies to reduce approval time and legal risk. Maintain permit compliance throughout asset life via centralized tracking and audits. Optimize the mix of static and digital placements to maximize yield and campaign flexibility.
Sales & account management
Prospect local SMBs and national brands across retail, QSR, automotive and CPG leveraging Lamar’s ~325,000 displays to craft proposals, packages and cross‑market buys; target renewals and upsells to lift yield (industry OOH spend in 2024 ~11B USD) and coordinate with operations for timely installs to maintain campaign SLA and fill rates.

Ad operations & scheduling
Ad operations and scheduling traffic creatives, allocate flights and manage rotations across Lamar's network of over 350,000 displays (including roughly 11,000 digital faces), balancing contracts, frequency caps and impression targets to meet campaign KPIs. Proof-of-play and compliance checks are enforced per placement with timestamped logs and audit trails. Real-time integration with programmatic bookings enables dynamic flight adjustments and inventory optimization.

Construction, maintenance & NOC
Build and convert structures to digital where ROI supports payback horizons often under five years; prioritize new construction for high-traffic corridors. Perform monthly inspections, routine repairs and vegetation control to preserve assets and safety. A Network Operations Center maintains screen health with a 99.9% uptime SLA and real-time alerts while managing utilities to cut energy use via LED retrofits (up to 60% savings).
- ROI payback: <5 years
- NOC uptime: 99.9% SLA
- LED energy savings: up to 60%
- Inspections: monthly
Analytics, pricing & yield management
Forecast demand and set market-level rate cards using historical sales, seasonal trends and market elasticity; Lamar leverages its network of ~350,000 displays with ~34,000 digital faces (2024) to price inventory. Use audience and mobility data to refine valuations and target CPMs by DMA and daypart. Optimize occupancy, share-of-voice and daypart mix to maximize yield and report performance and attribution to clients with impression and conversion metrics.
- Market pricing: rate cards by DMA
- Data inputs: audience + mobility
- Yield: occupancy & daypart mix
- Reporting: performance & attribution
Secure leases across ~350k displays to capture $11B OOH spend
Identify high-traffic sites and secure leases across Lamar’s ~350,000 displays (34,000 digital faces in 2024) to maximize corridor and transit reach. Drive sales and ad ops to capture ~11B USD OOH spend (2024), manage flights, proof-of-play and programmatic bookings with a NOC 99.9% SLA. Maintain assets, convert to digital where ROI payback <5 years and cut energy via LED retrofits (up to 60%).
| Metric | Value |
|---|---|
| Displays | ~350,000 |
| Digital faces (2024) | 34,000 |
| NOC uptime | 99.9% |
| OOH spend (2024) | $11B |
| LED savings | up to 60% |
| ROI payback | <5 years |
Preview Before You Purchase
Business Model Canvas
The Lamar Business Model Canvas shown here is the actual deliverable, not a mockup, and reflects the full structure and content you’ll receive after purchase. When you complete your order you’ll download this exact, ready-to-edit file in its provided formats. No surprises—what you preview is what you’ll own for presenting, editing, and implementing.

Strategic blueprint: value propositions, revenue levers, growth tactics.
Unlock the full strategic blueprint behind Lamar’s business model—discover its value propositions, revenue levers, and growth tactics in one actionable canvas. Perfect for investors, consultants, and founders who want a ready-to-use roadmap. Purchase the complete Word/Excel pack to benchmark, adapt, and scale with confidence.
Partnerships
Property owners & municipalities
Access to land and building facades underpins Lamar’s inventory scale—about 372,000+ outdoor displays in 2024—driving location quality and ad reach. Long-term ground leases and permits, typically 20–50 years, secure footprint stability and predictable cash flows. Strong municipal relationships ensure compliance with zoning and sign ordinances, limiting legal disruptions. Ongoing community engagement preserves goodwill and supports renewal prospects.
Transit & airport authorities
Exclusive concessions with transit and airport authorities enable Lamar to place ads on buses, shelters, rail and terminals, leveraging its ~353,000 displays and reported 2024 revenue of about $2.27 billion to reach commuter and traveler audiences. Revenue-share contracts align incentives and expand reach while operations must meet strict safety and aesthetic standards. Concession renewals drive continuity and growth.
Agencies & media buyers
Agencies and media buyers aggregate demand from national and regional brands, leveraging Lamar’s 360,000+ displays (2024) to scale reach across markets. Preferred-vendor status and upfront deals improve inventory utilization and revenue predictability. Collaborative planning delivers cross-market, multi-format campaigns, while centralized billing and trafficking streamline execution with single-invoice and unified ad ops workflows.
Ad-tech, data & measurement partners
Ad-tech, data and measurement partners supply location data, audience modeling and attribution tools that validate outcomes and lift DOOH ROI; programmatic DOOH integrations with DSPs/SSPs enabled roughly 30–40% of buys in 2024, accelerating scale. Proof-of-play and impression verification drove a measurable trust uplift, while privacy-compliant data governance met CCPA/CPRA and GDPR requirements.
- Location data: enhances targeting and ROI
- Audience modeling: refines reach and frequency
- Attribution & verification: proof-of-play builds trust
- DSP/SSP integrations: enable programmatic scale
- Privacy-compliant data: ensures brand safety
Fabrication, installation & service vendors
Third-party crews build, wrap and maintain Lamar structures at scale while specialized vendors manage high-mast, electrical and digital screen installations. Service-level agreements target 99% screen uptime and 48-hour creative swaps to maximize revenue availability. Centralized, cost-efficient logistics cut downtime and minimize truck rolls, improving installation velocity and OOH yield.
≈372,000 displays, long leases and predictable cash flow; 2024 revenue $2.27B
Lamar’s scale (≈372,000 displays in 2024) and long-term leases (20–50 yrs) secure footprint and predictable cash flow; 2024 revenue ≈ $2.27B. Transit/airport concessions and agency partnerships drive reach; programmatic DOOH ~30–40% of buys in 2024. Ops rely on 3rd-party crews with SLAs (99% uptime; 48‑hr swaps) to maximize revenue.
| Metric | 2024 Value |
|---|---|
| Displays | ≈372,000 |
| Revenue | $2.27B |
| Programmatic Mix | 30–40% |
| Uptime SLA | 99% |
What is included in the product
Detailed Word Document
A concise, pre-written Business Model Canvas for Lamar detailing customer segments, value propositions, channels, revenue streams and the nine BMC blocks with real-world operational context. Ideal for presentations, investor discussions and includes SWOT-linked insights and competitive advantages to support validation and strategic decisions.
Customizable Excel Spreadsheet
High-level Lamar Business Model Canvas provides a clean, editable one-page snapshot that relieves the pain of scattered planning by consolidating key components for fast alignment and decision-making.
Activities
Site acquisition & permitting
Identify high-traffic locations and negotiate leases focusing on corridors and transit hubs, leveraging Lamar’s portfolio of roughly 360,000 displays to secure premium placements. Navigate zoning, variances, and environmental reviews with local agencies to reduce approval time and legal risk. Maintain permit compliance throughout asset life via centralized tracking and audits. Optimize the mix of static and digital placements to maximize yield and campaign flexibility.
Sales & account management
Prospect local SMBs and national brands across retail, QSR, automotive and CPG leveraging Lamar’s ~325,000 displays to craft proposals, packages and cross‑market buys; target renewals and upsells to lift yield (industry OOH spend in 2024 ~11B USD) and coordinate with operations for timely installs to maintain campaign SLA and fill rates.
Ad operations & scheduling
Ad operations and scheduling traffic creatives, allocate flights and manage rotations across Lamar's network of over 350,000 displays (including roughly 11,000 digital faces), balancing contracts, frequency caps and impression targets to meet campaign KPIs. Proof-of-play and compliance checks are enforced per placement with timestamped logs and audit trails. Real-time integration with programmatic bookings enables dynamic flight adjustments and inventory optimization.
Construction, maintenance & NOC
Build and convert structures to digital where ROI supports payback horizons often under five years; prioritize new construction for high-traffic corridors. Perform monthly inspections, routine repairs and vegetation control to preserve assets and safety. A Network Operations Center maintains screen health with a 99.9% uptime SLA and real-time alerts while managing utilities to cut energy use via LED retrofits (up to 60% savings).
- ROI payback: <5 years
- NOC uptime: 99.9% SLA
- LED energy savings: up to 60%
- Inspections: monthly
Analytics, pricing & yield management
Forecast demand and set market-level rate cards using historical sales, seasonal trends and market elasticity; Lamar leverages its network of ~350,000 displays with ~34,000 digital faces (2024) to price inventory. Use audience and mobility data to refine valuations and target CPMs by DMA and daypart. Optimize occupancy, share-of-voice and daypart mix to maximize yield and report performance and attribution to clients with impression and conversion metrics.
- Market pricing: rate cards by DMA
- Data inputs: audience + mobility
- Yield: occupancy & daypart mix
- Reporting: performance & attribution
Secure leases across ~350k displays to capture $11B OOH spend
Identify high-traffic sites and secure leases across Lamar’s ~350,000 displays (34,000 digital faces in 2024) to maximize corridor and transit reach. Drive sales and ad ops to capture ~11B USD OOH spend (2024), manage flights, proof-of-play and programmatic bookings with a NOC 99.9% SLA. Maintain assets, convert to digital where ROI payback <5 years and cut energy via LED retrofits (up to 60%).
| Metric | Value |
|---|---|
| Displays | ~350,000 |
| Digital faces (2024) | 34,000 |
| NOC uptime | 99.9% |
| OOH spend (2024) | $11B |
| LED savings | up to 60% |
| ROI payback | <5 years |
Preview Before You Purchase
Business Model Canvas
The Lamar Business Model Canvas shown here is the actual deliverable, not a mockup, and reflects the full structure and content you’ll receive after purchase. When you complete your order you’ll download this exact, ready-to-edit file in its provided formats. No surprises—what you preview is what you’ll own for presenting, editing, and implementing.
Original: $10.00
-65%$10.00
$3.50Description
Strategic blueprint: value propositions, revenue levers, growth tactics.
Unlock the full strategic blueprint behind Lamar’s business model—discover its value propositions, revenue levers, and growth tactics in one actionable canvas. Perfect for investors, consultants, and founders who want a ready-to-use roadmap. Purchase the complete Word/Excel pack to benchmark, adapt, and scale with confidence.
Partnerships
Property owners & municipalities
Access to land and building facades underpins Lamar’s inventory scale—about 372,000+ outdoor displays in 2024—driving location quality and ad reach. Long-term ground leases and permits, typically 20–50 years, secure footprint stability and predictable cash flows. Strong municipal relationships ensure compliance with zoning and sign ordinances, limiting legal disruptions. Ongoing community engagement preserves goodwill and supports renewal prospects.
Transit & airport authorities
Exclusive concessions with transit and airport authorities enable Lamar to place ads on buses, shelters, rail and terminals, leveraging its ~353,000 displays and reported 2024 revenue of about $2.27 billion to reach commuter and traveler audiences. Revenue-share contracts align incentives and expand reach while operations must meet strict safety and aesthetic standards. Concession renewals drive continuity and growth.
Agencies & media buyers
Agencies and media buyers aggregate demand from national and regional brands, leveraging Lamar’s 360,000+ displays (2024) to scale reach across markets. Preferred-vendor status and upfront deals improve inventory utilization and revenue predictability. Collaborative planning delivers cross-market, multi-format campaigns, while centralized billing and trafficking streamline execution with single-invoice and unified ad ops workflows.
Ad-tech, data & measurement partners
Ad-tech, data and measurement partners supply location data, audience modeling and attribution tools that validate outcomes and lift DOOH ROI; programmatic DOOH integrations with DSPs/SSPs enabled roughly 30–40% of buys in 2024, accelerating scale. Proof-of-play and impression verification drove a measurable trust uplift, while privacy-compliant data governance met CCPA/CPRA and GDPR requirements.
- Location data: enhances targeting and ROI
- Audience modeling: refines reach and frequency
- Attribution & verification: proof-of-play builds trust
- DSP/SSP integrations: enable programmatic scale
- Privacy-compliant data: ensures brand safety
Fabrication, installation & service vendors
Third-party crews build, wrap and maintain Lamar structures at scale while specialized vendors manage high-mast, electrical and digital screen installations. Service-level agreements target 99% screen uptime and 48-hour creative swaps to maximize revenue availability. Centralized, cost-efficient logistics cut downtime and minimize truck rolls, improving installation velocity and OOH yield.
≈372,000 displays, long leases and predictable cash flow; 2024 revenue $2.27B
Lamar’s scale (≈372,000 displays in 2024) and long-term leases (20–50 yrs) secure footprint and predictable cash flow; 2024 revenue ≈ $2.27B. Transit/airport concessions and agency partnerships drive reach; programmatic DOOH ~30–40% of buys in 2024. Ops rely on 3rd-party crews with SLAs (99% uptime; 48‑hr swaps) to maximize revenue.
| Metric | 2024 Value |
|---|---|
| Displays | ≈372,000 |
| Revenue | $2.27B |
| Programmatic Mix | 30–40% |
| Uptime SLA | 99% |
What is included in the product
Detailed Word Document
A concise, pre-written Business Model Canvas for Lamar detailing customer segments, value propositions, channels, revenue streams and the nine BMC blocks with real-world operational context. Ideal for presentations, investor discussions and includes SWOT-linked insights and competitive advantages to support validation and strategic decisions.
Customizable Excel Spreadsheet
High-level Lamar Business Model Canvas provides a clean, editable one-page snapshot that relieves the pain of scattered planning by consolidating key components for fast alignment and decision-making.
Activities
Site acquisition & permitting
Identify high-traffic locations and negotiate leases focusing on corridors and transit hubs, leveraging Lamar’s portfolio of roughly 360,000 displays to secure premium placements. Navigate zoning, variances, and environmental reviews with local agencies to reduce approval time and legal risk. Maintain permit compliance throughout asset life via centralized tracking and audits. Optimize the mix of static and digital placements to maximize yield and campaign flexibility.
Sales & account management
Prospect local SMBs and national brands across retail, QSR, automotive and CPG leveraging Lamar’s ~325,000 displays to craft proposals, packages and cross‑market buys; target renewals and upsells to lift yield (industry OOH spend in 2024 ~11B USD) and coordinate with operations for timely installs to maintain campaign SLA and fill rates.
Ad operations & scheduling
Ad operations and scheduling traffic creatives, allocate flights and manage rotations across Lamar's network of over 350,000 displays (including roughly 11,000 digital faces), balancing contracts, frequency caps and impression targets to meet campaign KPIs. Proof-of-play and compliance checks are enforced per placement with timestamped logs and audit trails. Real-time integration with programmatic bookings enables dynamic flight adjustments and inventory optimization.
Construction, maintenance & NOC
Build and convert structures to digital where ROI supports payback horizons often under five years; prioritize new construction for high-traffic corridors. Perform monthly inspections, routine repairs and vegetation control to preserve assets and safety. A Network Operations Center maintains screen health with a 99.9% uptime SLA and real-time alerts while managing utilities to cut energy use via LED retrofits (up to 60% savings).
- ROI payback: <5 years
- NOC uptime: 99.9% SLA
- LED energy savings: up to 60%
- Inspections: monthly
Analytics, pricing & yield management
Forecast demand and set market-level rate cards using historical sales, seasonal trends and market elasticity; Lamar leverages its network of ~350,000 displays with ~34,000 digital faces (2024) to price inventory. Use audience and mobility data to refine valuations and target CPMs by DMA and daypart. Optimize occupancy, share-of-voice and daypart mix to maximize yield and report performance and attribution to clients with impression and conversion metrics.
- Market pricing: rate cards by DMA
- Data inputs: audience + mobility
- Yield: occupancy & daypart mix
- Reporting: performance & attribution
Secure leases across ~350k displays to capture $11B OOH spend
Identify high-traffic sites and secure leases across Lamar’s ~350,000 displays (34,000 digital faces in 2024) to maximize corridor and transit reach. Drive sales and ad ops to capture ~11B USD OOH spend (2024), manage flights, proof-of-play and programmatic bookings with a NOC 99.9% SLA. Maintain assets, convert to digital where ROI payback <5 years and cut energy via LED retrofits (up to 60%).
| Metric | Value |
|---|---|
| Displays | ~350,000 |
| Digital faces (2024) | 34,000 |
| NOC uptime | 99.9% |
| OOH spend (2024) | $11B |
| LED savings | up to 60% |
| ROI payback | <5 years |
Preview Before You Purchase
Business Model Canvas
The Lamar Business Model Canvas shown here is the actual deliverable, not a mockup, and reflects the full structure and content you’ll receive after purchase. When you complete your order you’ll download this exact, ready-to-edit file in its provided formats. No surprises—what you preview is what you’ll own for presenting, editing, and implementing.











