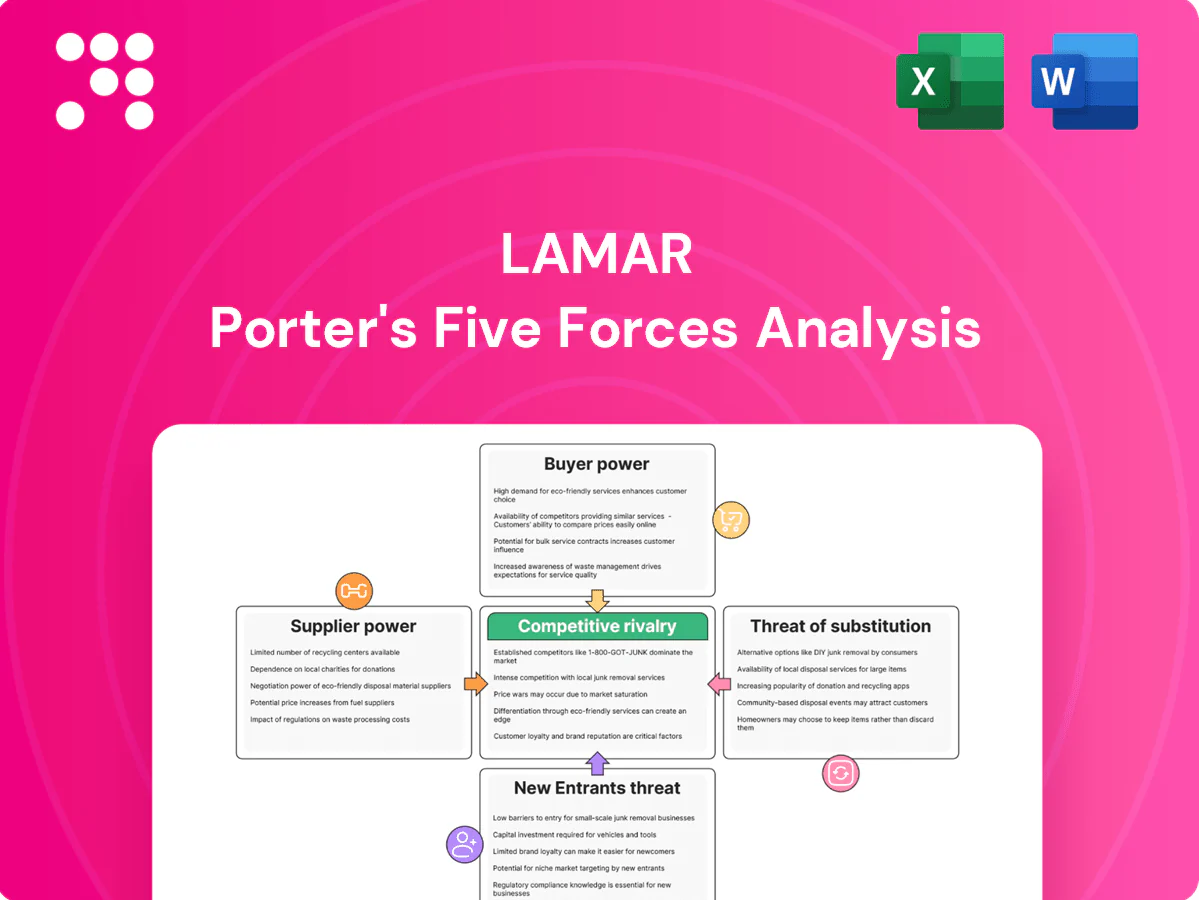
Lamar Porter's Five Forces Analysis

A Must-Have Tool for Decision-Makers
Lamar’s Porter's Five Forces snapshot surfaces competitive intensity—buyer and supplier power, substitution risk, entry barriers, and rivalry—but only scratches the surface. Unlock the full report for force-by-force ratings, visuals, and actionable strategy to inform investment or strategic decisions. Purchase now for consultant-grade insights.
Suppliers Bargaining Power

Concentrated digital display vendors
Digital billboard hardware and software come from a concentrated pool of specialized vendors, raising switching costs and giving suppliers outsized leverage; industry reports in 2024 noted supplier consolidation and persistent lead times that extend deployment timelines. Proprietary components, certification and multi‑year service dependencies typically lock operators into vendor cycles, while volume discounts help but technical specs and integration needs limit true alternatives. Any supplier disruption can meaningfully delay installs and monetization.
Airport and transit concession owners
Airport and transit concession owners control premium inventory rights, extracting concession fees and revenue shares that give them strong bargaining leverage; airports now derive roughly half of their revenue from non-aeronautical sources. Competitive tenders and exclusivity clauses compress operator margins and raise bid intensity. Performance clauses and capex obligations transfer cost and execution risk to operators. Renewal uncertainty pressures pricing and long-term ROI.

Real estate landlords and leaseholders
Key Lamar locations rely on long-term land leases (commonly 10–50 years) giving landlords leverage over rent escalators (typically 2–4% annually) and renewal terms. Scarcity of permitted urban sites—vacant billboard permits often under 10% in major metros—amplifies bargaining power for prime parcels. High relocation/takedown costs (often hundreds of thousands per site) deter switching; land aggregation reduces but does not remove exposure.

Utilities and maintenance contractors
Utilities and maintenance contractors hold high supplier power for Lamar Porter because power access, grid upgrades and routine service are critical to achieving digital-board uptime targets (typical SLAs aim for 99.9% availability); local utility monopolies set connection timelines and fees that can delay rollouts. In many US markets 2024 connection fees and upgrade costs commonly range from 5,000 to 50,000 per site, while specialized installers can charge scarcity premiums of 10–30%. Service-level failures directly reduce ad delivery and revenue, with each hour offline causing proportional revenue loss for programmatic campaigns.
- Power access: monopoly timelines dictate rollout pace
- Grid upgrades: 5,000–50,000 per site (2024 ranges)
- Installers: 10–30% scarcity premiums
- Uptime: 99.9% SLA target; outages cut ad revenue
Permitting and regulatory gatekeepers
As of 2024, municipalities and state agencies act as de facto suppliers of permits, directly shaping inventory availability and market entry. Moratoria, spacing rules and brightness limits create binding capacity constraints and raise time-to-market. Rising compliance costs and lobbying needs elevate operating complexity, while abrupt regulatory shifts can swing supplier power across jurisdictions.
- Permits control supply
- Moratoria/spacing limit capacity
- Compliance+lobbying raise costs
- Regulatory shifts change power
Vendors' long lead times, airport fees and utility charges raise rollout costs and switching risk
Specialized vendors concentrate supply with multi‑year lock‑ins and longer 2024 lead times; airports extract ~50% non‑aero revenue via fees/exclusives; landlords use 10–50yr leases with 2–4% escalators and scarce permits (<10% vacant); utilities charge $5,000–$50,000 connection fees and installers 10–30% premiums, all raising switching costs and rollout risk.
| Supplier | 2024 metric | Impact |
|---|---|---|
| Vendors | Consolidated, long lead times | High switching cost |
| Airports | ~50% non‑aero revenue | Strong fee leverage |
| Landlords | 10–50yr leases; 2–4% escalators | Lock‑in |
| Utilities | $5k–$50k/site; 10–30% installer premium | Delay/cost risk |
| Permits | <10% vacant | Capacity constraint |
What is included in the product
 Detailed Word Document
Uncovers key drivers of competition, customer influence, and market entry risks tailored to Lamar Porter, with detailed analysis of each competitive force supported by industry data and strategic commentary. Identifies disruptive threats, supplier and buyer power, substitutes, and barriers protecting incumbents, delivered in a fully editable format for investor materials and strategy decks.

 Customizable Excel Spreadsheet
A compact Lamar Porter Five Forces one-sheet that visualizes competitive pressure with an editable spider chart, lets you swap in your own data, duplicate scenario tabs, and export clean slides—no macros or finance expertise required.
Customers Bargaining Power

Consolidated national advertisers and agencies
Consolidated national advertisers and holding-company agencies extract scale: negotiated volume discounts and long-term rate cards press Lamar’s CPMs, especially as top advertisers reallocate budgets across channels; US measured-media ad spend reached about $285 billion in 2024, amplifying buyers’ leverage. Data-driven benchmarks and programmatic pricing raise price scrutiny, and preferred-partner status eases workflow but rarely eliminates steep pricing pressure during large RFPs.
Fragmented local SMBs
Local advertisers are fragmented—there were about 33.2 million small businesses in the US in 2023 (SBA), which limits coordinated bargaining and individual leverage. Their high sensitivity to ROI and cash flow pushes demand for short-term deals and flexible packages. Inside sales teams and self-serve platforms reduce friction and reliance on across-the-board discounts. Churn is manageable if Lamar maintains broad market coverage and responsive service.

Programmatic DOOH transparency
In 2024 programmatic DOOH accounted for roughly 35% of DOOH transactions, and automated buying with unified measurement increased price comparability, compressing effective CPMs by about 10–15% versus traditional direct buys.
Real-time pacing and audience-targeting let buyers reallocate spend away from underperforming units, improving short-term ROI by ~12%, while floor prices and private deals protect yield but auction dynamics continue to erode margins.
Rising data attribution demands shifted a growing share of value to platforms, which captured an estimated ~20% of incremental campaign value through measurement and attribution services.

Availability of cross-channel alternatives
Buyers can reallocate spend to social, search, CTV and retail media when OOH pricing rises; CTV ad spend grew about 24% in 2024 and retail media ~30%, making substitution easier. Cross-media planning tools and programmatic trading reduce friction, while OOHs unique reach and unskippable exposure help defend rates despite rising buyer leverage from mixed-media budgets. Bundled offerings and proof-of-impact (attribution and incrementality) mitigate switching.
- Reallocation: social/search/CTV/retail
- Data: CTV +24% 2024, retail +30% 2024
- Defense: unique reach, unskippable
- Mitigation: bundles, proof-of-impact
Cyclicality and demand shocks
In downturns buyers gain leverage as occupancy and rates fall; global RevPAR plunged about 49% in 2020 (STR) and many markets only fully recovered by 2023–24, intensifying rate pressure. Flexible cancellation terms amplify short-term volatility, while tight inventory in peak seasons reduces buyer power. Dynamic pricing and long-term contracts help balance cycles.
- Buyer leverage up in downturns
- Flexible cancellations increase pressure
- Peak-season tight supply lowers buyer power
- Dynamic pricing + long-term contracts mitigate
Consolidated buyers, programmatic DOOH and CTV growth compress US outdoor CPMs ~10-15%
Consolidated national buyers and holding agencies wield strong scale, pressuring Lamar’s CPMs as US measured-media spend hit ~$285B in 2024. Fragmented local advertisers (~33.2M small businesses in 2023) limit coordinated bargaining but demand flexible, ROI-driven deals. Programmatic DOOH (~35% of transactions) and cross‑media shifts (CTV +24% 2024, retail +30% 2024) increase substitution and compress CPMs ~10–15%.
| Metric | 2024/2023 |
|---|---|
| US measured-media spend | $285B (2024) |
| Small businesses | 33.2M (2023) |
Preview Before You Purchase
Lamar Porter's Five Forces Analysis
This preview shows the exact Lamar Porter's Five Forces Analysis you'll receive immediately after purchase—no surprises, no placeholders. The document displayed here is the full, professionally formatted analysis ready for download and use the moment you buy. You're looking at the actual deliverable, available instantly upon payment.

A Must-Have Tool for Decision-Makers
Lamar’s Porter's Five Forces snapshot surfaces competitive intensity—buyer and supplier power, substitution risk, entry barriers, and rivalry—but only scratches the surface. Unlock the full report for force-by-force ratings, visuals, and actionable strategy to inform investment or strategic decisions. Purchase now for consultant-grade insights.
Suppliers Bargaining Power
Concentrated digital display vendors
Digital billboard hardware and software come from a concentrated pool of specialized vendors, raising switching costs and giving suppliers outsized leverage; industry reports in 2024 noted supplier consolidation and persistent lead times that extend deployment timelines. Proprietary components, certification and multi‑year service dependencies typically lock operators into vendor cycles, while volume discounts help but technical specs and integration needs limit true alternatives. Any supplier disruption can meaningfully delay installs and monetization.
Airport and transit concession owners
Airport and transit concession owners control premium inventory rights, extracting concession fees and revenue shares that give them strong bargaining leverage; airports now derive roughly half of their revenue from non-aeronautical sources. Competitive tenders and exclusivity clauses compress operator margins and raise bid intensity. Performance clauses and capex obligations transfer cost and execution risk to operators. Renewal uncertainty pressures pricing and long-term ROI.
Real estate landlords and leaseholders
Key Lamar locations rely on long-term land leases (commonly 10–50 years) giving landlords leverage over rent escalators (typically 2–4% annually) and renewal terms. Scarcity of permitted urban sites—vacant billboard permits often under 10% in major metros—amplifies bargaining power for prime parcels. High relocation/takedown costs (often hundreds of thousands per site) deter switching; land aggregation reduces but does not remove exposure.
Utilities and maintenance contractors
Utilities and maintenance contractors hold high supplier power for Lamar Porter because power access, grid upgrades and routine service are critical to achieving digital-board uptime targets (typical SLAs aim for 99.9% availability); local utility monopolies set connection timelines and fees that can delay rollouts. In many US markets 2024 connection fees and upgrade costs commonly range from 5,000 to 50,000 per site, while specialized installers can charge scarcity premiums of 10–30%. Service-level failures directly reduce ad delivery and revenue, with each hour offline causing proportional revenue loss for programmatic campaigns.
- Power access: monopoly timelines dictate rollout pace
- Grid upgrades: 5,000–50,000 per site (2024 ranges)
- Installers: 10–30% scarcity premiums
- Uptime: 99.9% SLA target; outages cut ad revenue
Permitting and regulatory gatekeepers
As of 2024, municipalities and state agencies act as de facto suppliers of permits, directly shaping inventory availability and market entry. Moratoria, spacing rules and brightness limits create binding capacity constraints and raise time-to-market. Rising compliance costs and lobbying needs elevate operating complexity, while abrupt regulatory shifts can swing supplier power across jurisdictions.
- Permits control supply
- Moratoria/spacing limit capacity
- Compliance+lobbying raise costs
- Regulatory shifts change power
Vendors' long lead times, airport fees and utility charges raise rollout costs and switching risk
Specialized vendors concentrate supply with multi‑year lock‑ins and longer 2024 lead times; airports extract ~50% non‑aero revenue via fees/exclusives; landlords use 10–50yr leases with 2–4% escalators and scarce permits (<10% vacant); utilities charge $5,000–$50,000 connection fees and installers 10–30% premiums, all raising switching costs and rollout risk.
| Supplier | 2024 metric | Impact |
|---|---|---|
| Vendors | Consolidated, long lead times | High switching cost |
| Airports | ~50% non‑aero revenue | Strong fee leverage |
| Landlords | 10–50yr leases; 2–4% escalators | Lock‑in |
| Utilities | $5k–$50k/site; 10–30% installer premium | Delay/cost risk |
| Permits | <10% vacant | Capacity constraint |
What is included in the product
Detailed Word Document
Uncovers key drivers of competition, customer influence, and market entry risks tailored to Lamar Porter, with detailed analysis of each competitive force supported by industry data and strategic commentary. Identifies disruptive threats, supplier and buyer power, substitutes, and barriers protecting incumbents, delivered in a fully editable format for investor materials and strategy decks.
Customizable Excel Spreadsheet
A compact Lamar Porter Five Forces one-sheet that visualizes competitive pressure with an editable spider chart, lets you swap in your own data, duplicate scenario tabs, and export clean slides—no macros or finance expertise required.
Customers Bargaining Power
Consolidated national advertisers and agencies
Consolidated national advertisers and holding-company agencies extract scale: negotiated volume discounts and long-term rate cards press Lamar’s CPMs, especially as top advertisers reallocate budgets across channels; US measured-media ad spend reached about $285 billion in 2024, amplifying buyers’ leverage. Data-driven benchmarks and programmatic pricing raise price scrutiny, and preferred-partner status eases workflow but rarely eliminates steep pricing pressure during large RFPs.
Fragmented local SMBs
Local advertisers are fragmented—there were about 33.2 million small businesses in the US in 2023 (SBA), which limits coordinated bargaining and individual leverage. Their high sensitivity to ROI and cash flow pushes demand for short-term deals and flexible packages. Inside sales teams and self-serve platforms reduce friction and reliance on across-the-board discounts. Churn is manageable if Lamar maintains broad market coverage and responsive service.
Programmatic DOOH transparency
In 2024 programmatic DOOH accounted for roughly 35% of DOOH transactions, and automated buying with unified measurement increased price comparability, compressing effective CPMs by about 10–15% versus traditional direct buys.
Real-time pacing and audience-targeting let buyers reallocate spend away from underperforming units, improving short-term ROI by ~12%, while floor prices and private deals protect yield but auction dynamics continue to erode margins.
Rising data attribution demands shifted a growing share of value to platforms, which captured an estimated ~20% of incremental campaign value through measurement and attribution services.
Availability of cross-channel alternatives
Buyers can reallocate spend to social, search, CTV and retail media when OOH pricing rises; CTV ad spend grew about 24% in 2024 and retail media ~30%, making substitution easier. Cross-media planning tools and programmatic trading reduce friction, while OOHs unique reach and unskippable exposure help defend rates despite rising buyer leverage from mixed-media budgets. Bundled offerings and proof-of-impact (attribution and incrementality) mitigate switching.
- Reallocation: social/search/CTV/retail
- Data: CTV +24% 2024, retail +30% 2024
- Defense: unique reach, unskippable
- Mitigation: bundles, proof-of-impact
Cyclicality and demand shocks
In downturns buyers gain leverage as occupancy and rates fall; global RevPAR plunged about 49% in 2020 (STR) and many markets only fully recovered by 2023–24, intensifying rate pressure. Flexible cancellation terms amplify short-term volatility, while tight inventory in peak seasons reduces buyer power. Dynamic pricing and long-term contracts help balance cycles.
- Buyer leverage up in downturns
- Flexible cancellations increase pressure
- Peak-season tight supply lowers buyer power
- Dynamic pricing + long-term contracts mitigate
Consolidated buyers, programmatic DOOH and CTV growth compress US outdoor CPMs ~10-15%
Consolidated national buyers and holding agencies wield strong scale, pressuring Lamar’s CPMs as US measured-media spend hit ~$285B in 2024. Fragmented local advertisers (~33.2M small businesses in 2023) limit coordinated bargaining but demand flexible, ROI-driven deals. Programmatic DOOH (~35% of transactions) and cross‑media shifts (CTV +24% 2024, retail +30% 2024) increase substitution and compress CPMs ~10–15%.
| Metric | 2024/2023 |
|---|---|
| US measured-media spend | $285B (2024) |
| Small businesses | 33.2M (2023) |
Preview Before You Purchase
Lamar Porter's Five Forces Analysis
This preview shows the exact Lamar Porter's Five Forces Analysis you'll receive immediately after purchase—no surprises, no placeholders. The document displayed here is the full, professionally formatted analysis ready for download and use the moment you buy. You're looking at the actual deliverable, available instantly upon payment.
Original: $10.00
-65%$10.00
$3.50Description
A Must-Have Tool for Decision-Makers
Lamar’s Porter's Five Forces snapshot surfaces competitive intensity—buyer and supplier power, substitution risk, entry barriers, and rivalry—but only scratches the surface. Unlock the full report for force-by-force ratings, visuals, and actionable strategy to inform investment or strategic decisions. Purchase now for consultant-grade insights.
Suppliers Bargaining Power
Concentrated digital display vendors
Digital billboard hardware and software come from a concentrated pool of specialized vendors, raising switching costs and giving suppliers outsized leverage; industry reports in 2024 noted supplier consolidation and persistent lead times that extend deployment timelines. Proprietary components, certification and multi‑year service dependencies typically lock operators into vendor cycles, while volume discounts help but technical specs and integration needs limit true alternatives. Any supplier disruption can meaningfully delay installs and monetization.
Airport and transit concession owners
Airport and transit concession owners control premium inventory rights, extracting concession fees and revenue shares that give them strong bargaining leverage; airports now derive roughly half of their revenue from non-aeronautical sources. Competitive tenders and exclusivity clauses compress operator margins and raise bid intensity. Performance clauses and capex obligations transfer cost and execution risk to operators. Renewal uncertainty pressures pricing and long-term ROI.
Real estate landlords and leaseholders
Key Lamar locations rely on long-term land leases (commonly 10–50 years) giving landlords leverage over rent escalators (typically 2–4% annually) and renewal terms. Scarcity of permitted urban sites—vacant billboard permits often under 10% in major metros—amplifies bargaining power for prime parcels. High relocation/takedown costs (often hundreds of thousands per site) deter switching; land aggregation reduces but does not remove exposure.
Utilities and maintenance contractors
Utilities and maintenance contractors hold high supplier power for Lamar Porter because power access, grid upgrades and routine service are critical to achieving digital-board uptime targets (typical SLAs aim for 99.9% availability); local utility monopolies set connection timelines and fees that can delay rollouts. In many US markets 2024 connection fees and upgrade costs commonly range from 5,000 to 50,000 per site, while specialized installers can charge scarcity premiums of 10–30%. Service-level failures directly reduce ad delivery and revenue, with each hour offline causing proportional revenue loss for programmatic campaigns.
- Power access: monopoly timelines dictate rollout pace
- Grid upgrades: 5,000–50,000 per site (2024 ranges)
- Installers: 10–30% scarcity premiums
- Uptime: 99.9% SLA target; outages cut ad revenue
Permitting and regulatory gatekeepers
As of 2024, municipalities and state agencies act as de facto suppliers of permits, directly shaping inventory availability and market entry. Moratoria, spacing rules and brightness limits create binding capacity constraints and raise time-to-market. Rising compliance costs and lobbying needs elevate operating complexity, while abrupt regulatory shifts can swing supplier power across jurisdictions.
- Permits control supply
- Moratoria/spacing limit capacity
- Compliance+lobbying raise costs
- Regulatory shifts change power
Vendors' long lead times, airport fees and utility charges raise rollout costs and switching risk
Specialized vendors concentrate supply with multi‑year lock‑ins and longer 2024 lead times; airports extract ~50% non‑aero revenue via fees/exclusives; landlords use 10–50yr leases with 2–4% escalators and scarce permits (<10% vacant); utilities charge $5,000–$50,000 connection fees and installers 10–30% premiums, all raising switching costs and rollout risk.
| Supplier | 2024 metric | Impact |
|---|---|---|
| Vendors | Consolidated, long lead times | High switching cost |
| Airports | ~50% non‑aero revenue | Strong fee leverage |
| Landlords | 10–50yr leases; 2–4% escalators | Lock‑in |
| Utilities | $5k–$50k/site; 10–30% installer premium | Delay/cost risk |
| Permits | <10% vacant | Capacity constraint |
What is included in the product
Detailed Word Document
Uncovers key drivers of competition, customer influence, and market entry risks tailored to Lamar Porter, with detailed analysis of each competitive force supported by industry data and strategic commentary. Identifies disruptive threats, supplier and buyer power, substitutes, and barriers protecting incumbents, delivered in a fully editable format for investor materials and strategy decks.
Customizable Excel Spreadsheet
A compact Lamar Porter Five Forces one-sheet that visualizes competitive pressure with an editable spider chart, lets you swap in your own data, duplicate scenario tabs, and export clean slides—no macros or finance expertise required.
Customers Bargaining Power
Consolidated national advertisers and agencies
Consolidated national advertisers and holding-company agencies extract scale: negotiated volume discounts and long-term rate cards press Lamar’s CPMs, especially as top advertisers reallocate budgets across channels; US measured-media ad spend reached about $285 billion in 2024, amplifying buyers’ leverage. Data-driven benchmarks and programmatic pricing raise price scrutiny, and preferred-partner status eases workflow but rarely eliminates steep pricing pressure during large RFPs.
Fragmented local SMBs
Local advertisers are fragmented—there were about 33.2 million small businesses in the US in 2023 (SBA), which limits coordinated bargaining and individual leverage. Their high sensitivity to ROI and cash flow pushes demand for short-term deals and flexible packages. Inside sales teams and self-serve platforms reduce friction and reliance on across-the-board discounts. Churn is manageable if Lamar maintains broad market coverage and responsive service.
Programmatic DOOH transparency
In 2024 programmatic DOOH accounted for roughly 35% of DOOH transactions, and automated buying with unified measurement increased price comparability, compressing effective CPMs by about 10–15% versus traditional direct buys.
Real-time pacing and audience-targeting let buyers reallocate spend away from underperforming units, improving short-term ROI by ~12%, while floor prices and private deals protect yield but auction dynamics continue to erode margins.
Rising data attribution demands shifted a growing share of value to platforms, which captured an estimated ~20% of incremental campaign value through measurement and attribution services.
Availability of cross-channel alternatives
Buyers can reallocate spend to social, search, CTV and retail media when OOH pricing rises; CTV ad spend grew about 24% in 2024 and retail media ~30%, making substitution easier. Cross-media planning tools and programmatic trading reduce friction, while OOHs unique reach and unskippable exposure help defend rates despite rising buyer leverage from mixed-media budgets. Bundled offerings and proof-of-impact (attribution and incrementality) mitigate switching.
- Reallocation: social/search/CTV/retail
- Data: CTV +24% 2024, retail +30% 2024
- Defense: unique reach, unskippable
- Mitigation: bundles, proof-of-impact
Cyclicality and demand shocks
In downturns buyers gain leverage as occupancy and rates fall; global RevPAR plunged about 49% in 2020 (STR) and many markets only fully recovered by 2023–24, intensifying rate pressure. Flexible cancellation terms amplify short-term volatility, while tight inventory in peak seasons reduces buyer power. Dynamic pricing and long-term contracts help balance cycles.
- Buyer leverage up in downturns
- Flexible cancellations increase pressure
- Peak-season tight supply lowers buyer power
- Dynamic pricing + long-term contracts mitigate
Consolidated buyers, programmatic DOOH and CTV growth compress US outdoor CPMs ~10-15%
Consolidated national buyers and holding agencies wield strong scale, pressuring Lamar’s CPMs as US measured-media spend hit ~$285B in 2024. Fragmented local advertisers (~33.2M small businesses in 2023) limit coordinated bargaining but demand flexible, ROI-driven deals. Programmatic DOOH (~35% of transactions) and cross‑media shifts (CTV +24% 2024, retail +30% 2024) increase substitution and compress CPMs ~10–15%.
| Metric | 2024/2023 |
|---|---|
| US measured-media spend | $285B (2024) |
| Small businesses | 33.2M (2023) |
Preview Before You Purchase
Lamar Porter's Five Forces Analysis
This preview shows the exact Lamar Porter's Five Forces Analysis you'll receive immediately after purchase—no surprises, no placeholders. The document displayed here is the full, professionally formatted analysis ready for download and use the moment you buy. You're looking at the actual deliverable, available instantly upon payment.











