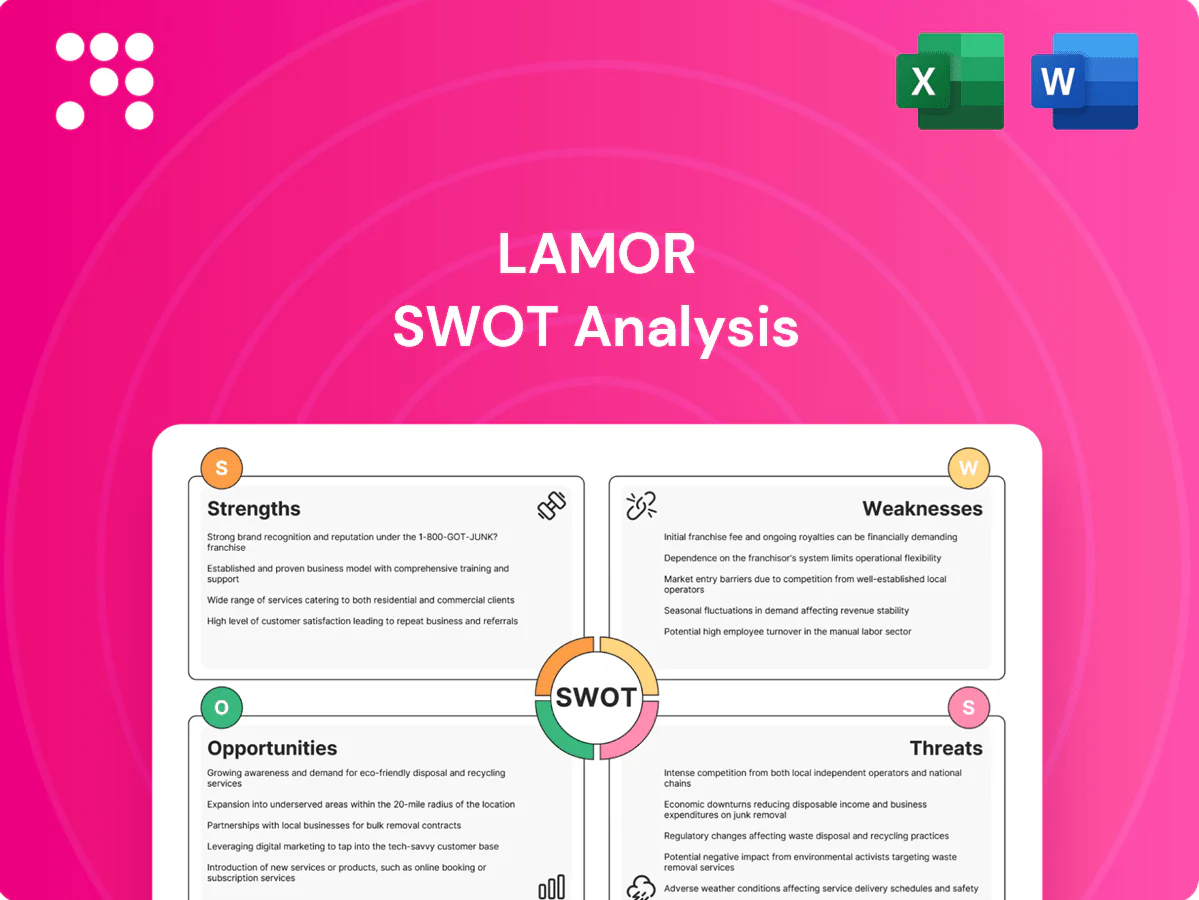
Lamor SWOT Analysis

Make Insightful Decisions Backed by Expert Research
Lamor’s proven oil-spill tech and global service network position it well in environmental remediation, yet supply-chain exposure and regulatory shifts create clear risks. Want the full strategic picture—detailed strengths, weaknesses, opportunities and threats with financial context and tactical recommendations? Purchase the complete SWOT for a professionally formatted Word report plus editable Excel matrix to plan, pitch, or invest with confidence.
Strengths

Global footprint
Operates across Europe, Americas, Middle East, Africa and Asia-Pacific, enabling rapid deployment to spill sites and polluted areas; Lamor has 34 years of operational experience. Global references with governments and major industry players and a Nasdaq Helsinki listing strengthen credibility in tenders. Geographic diversification helps smooth revenue volatility tied to any single market. Local partners and regional depots shorten response times and logistics.
Integrated solutions
Lamor combines equipment design and manufacturing with services and training to deliver end-to-end oil spill response packages, increasing client win rates and contract stickiness. Integrated service data continuously informs product upgrades, shortening development cycles and improving reliability. Training programs embed Lamor standards in client teams, creating recurring demand for maintenance and advisory services.

Technical know-how
Deep technical know-how: Lamor leverages over 40 years of oil‑spill and waste/water treatment experience, deploying proprietary IP and engineering teams that set it apart from generic gear suppliers. Proven field performance in 80+ countries and high‑visibility responses builds customer trust. Continuous R&D adapts tools for new pollutants and viscosities, supported by dedicated engineering centers.

Regulatory alignment
Solutions map directly to environmental compliance mandates for ports, O&G and municipalities, aligning with MARPOL (1973/78) Annex I on oil pollution and national spill preparedness rules, which helps clients prioritize budgets toward response capabilities. Certifications and audit-readiness shorten procurement cycles, while global policy tailwinds sustain long-term demand.
- Regulatory fit: MARPOL Annex I (1973/78)
- Budget support: spill preparedness prioritized
- Procurement: certifications speed approvals
Mission-driven brand
Lamor, listed on Nasdaq Helsinki, leverages a clear environmental purpose that resonates with public-sector and ESG-focused buyers and strengthens bid success for remediation contracts. Its proven reliability in crisis responses has built strong brand equity, while purpose-driven culture aids talent attraction and retention. Established credibility supports lead/consortium roles in large, multi-stakeholder remediation projects.
- Public-sector alignment
- ESG buyer appeal
- Crisis-proven reliability
- Talent magnet
- Consortium credibility
34 years, 80+ countries - Nasdaq Helsinki-listed oil-spill response firm with recurring revenue
Global footprint across Europe, Americas, MENA and APAC with 34 years operational experience and responses in 80+ countries; Nasdaq Helsinki listing strengthens tender credibility. Integrated equipment, services and training create end-to-end solutions that lock in clients and drive recurring revenue. Strong regulatory fit with MARPOL Annex I and growing ESG demand boost public-sector and corporate contracts.
| Metric | Value |
|---|---|
| Years operating | 34 |
| Countries served | 80+ |
| Stock listing | Nasdaq Helsinki |
What is included in the product
 Detailed Word Document
Analyzes Lamor’s competitive position through key internal and external factors, highlighting strengths, weaknesses, opportunities, and threats that shape its strategic direction.

 Customizable Excel Spreadsheet
Provides a focused SWOT summary for Lamor to quickly identify remediation areas and strategic opportunities, easing cross-team alignment; editable format lets teams update strengths, weaknesses, opportunities, and threats rapidly for timely decisions and stakeholder briefings.
Weaknesses

Project cyclicality
Large, irregular contracts and emergency-response jobs make revenue lumpy for Lamor, with cash flow sensitive to milestone-based payments and project timing; industry receivable days for environmental contractors averaged 60–90 days in 2024, elongating working capital cycles. Forecasting complexity increases operational risk, and equipment/staff utilization can drop to 40–60% between major deployments, pressing margins.
Exposure to oil sector
Dependence on hydrocarbon clients ties Lamor’s demand to O&G capex and spill-readiness budgets, leaving revenue cyclical when upstream spending fluctuates; Brent crude volatility (roughly $70–$90/bbl through 2024) illustrates this sensitivity. Public perception risk rises when servicing fossil-fuel operators, potentially affecting bids and partnerships. Energy downturns can delay orders or reduce service scope, and customer concentration may emerge in specific regions.

Capital intensity
Manufacturing specialized skimmers and maintaining response vessels requires significant capex, often ranging €0.5–5.0M per unit, straining cash flow. Inventory and spare parts holdings can tie up €0.1–2.0M in working capital for regional hubs. Scaling to multiple standby contracts raises fixed costs materially, and returns typically depend on sustaining utilization above ~70% and disciplined bidding to protect margins.

Tender dependence
Public procurement for Lamor is lengthy (commonly 6–12 months) and documentation-heavy, making bid timing unpredictable and causing quarterly revenue volatility; bid outcomes can swing quarterly performance by as much as 20–30%. Margin compression from low-cost competitors in commoditized equipment risks eroding gross margins by 200–500 bps. Rising compliance overheads push SG&A higher, increasing cost-to-serve.
- procurement-duration: 6–12 months
- quarterly-volatility: ±20–30%
- margin-compression: 200–500 bps
- sg&a-pressure: +2–4 ppt
Complex delivery
Multisite hazardous-waste and water-treatment projects expose Lamor to elevated execution risks due to complex logistics, permitting and HSE coordination across jurisdictions. Shortages of specialized operators constrain capacity and slow project ramp-up, while warranty and performance guarantees create cashflow and liability downside if systems underperform.
- Execution risk: multisite hazardous projects
- Logistics, permits, HSE complexity
- Skills shortage: specialized operators
- Downside: warranty/performance guarantees
Lumpy contracts, long procurements and high unit capex drive cash-flow and margin risk
Revenue is lumpy from large, milestone-driven contracts and emergency work (receivables 60–90 days; utilization 40–60%), raising cash‑flow and forecasting risk. Heavy exposure to hydrocarbon clients ties demand to O&G capex (Brent ~70–90 $/bbl in 2024) and raises reputational risk. High capex per unit (€0.5–5.0M), long procurement (6–12 months) and margin compression (200–500 bps) strain returns.
| Metric | Value |
|---|---|
| Receivable days | 60–90 |
| Utilization | 40–60% |
| Unit capex | €0.5–5.0M |
| Procurement | 6–12 months |
| Margin compression | 200–500 bps |
What You See Is What You Get
Lamor SWOT Analysis
This is the actual Lamor SWOT analysis document you’ll receive upon purchase—no surprises, just professional quality. The preview below is taken directly from the full report and reflects the same structured, editable file. Buy now to unlock the complete, in‑depth version immediately after checkout.

Make Insightful Decisions Backed by Expert Research
Lamor’s proven oil-spill tech and global service network position it well in environmental remediation, yet supply-chain exposure and regulatory shifts create clear risks. Want the full strategic picture—detailed strengths, weaknesses, opportunities and threats with financial context and tactical recommendations? Purchase the complete SWOT for a professionally formatted Word report plus editable Excel matrix to plan, pitch, or invest with confidence.
Strengths
Global footprint
Operates across Europe, Americas, Middle East, Africa and Asia-Pacific, enabling rapid deployment to spill sites and polluted areas; Lamor has 34 years of operational experience. Global references with governments and major industry players and a Nasdaq Helsinki listing strengthen credibility in tenders. Geographic diversification helps smooth revenue volatility tied to any single market. Local partners and regional depots shorten response times and logistics.
Integrated solutions
Lamor combines equipment design and manufacturing with services and training to deliver end-to-end oil spill response packages, increasing client win rates and contract stickiness. Integrated service data continuously informs product upgrades, shortening development cycles and improving reliability. Training programs embed Lamor standards in client teams, creating recurring demand for maintenance and advisory services.
Technical know-how
Deep technical know-how: Lamor leverages over 40 years of oil‑spill and waste/water treatment experience, deploying proprietary IP and engineering teams that set it apart from generic gear suppliers. Proven field performance in 80+ countries and high‑visibility responses builds customer trust. Continuous R&D adapts tools for new pollutants and viscosities, supported by dedicated engineering centers.
Regulatory alignment
Solutions map directly to environmental compliance mandates for ports, O&G and municipalities, aligning with MARPOL (1973/78) Annex I on oil pollution and national spill preparedness rules, which helps clients prioritize budgets toward response capabilities. Certifications and audit-readiness shorten procurement cycles, while global policy tailwinds sustain long-term demand.
- Regulatory fit: MARPOL Annex I (1973/78)
- Budget support: spill preparedness prioritized
- Procurement: certifications speed approvals
Mission-driven brand
Lamor, listed on Nasdaq Helsinki, leverages a clear environmental purpose that resonates with public-sector and ESG-focused buyers and strengthens bid success for remediation contracts. Its proven reliability in crisis responses has built strong brand equity, while purpose-driven culture aids talent attraction and retention. Established credibility supports lead/consortium roles in large, multi-stakeholder remediation projects.
- Public-sector alignment
- ESG buyer appeal
- Crisis-proven reliability
- Talent magnet
- Consortium credibility
34 years, 80+ countries - Nasdaq Helsinki-listed oil-spill response firm with recurring revenue
Global footprint across Europe, Americas, MENA and APAC with 34 years operational experience and responses in 80+ countries; Nasdaq Helsinki listing strengthens tender credibility. Integrated equipment, services and training create end-to-end solutions that lock in clients and drive recurring revenue. Strong regulatory fit with MARPOL Annex I and growing ESG demand boost public-sector and corporate contracts.
| Metric | Value |
|---|---|
| Years operating | 34 |
| Countries served | 80+ |
| Stock listing | Nasdaq Helsinki |
What is included in the product
Detailed Word Document
Analyzes Lamor’s competitive position through key internal and external factors, highlighting strengths, weaknesses, opportunities, and threats that shape its strategic direction.
Customizable Excel Spreadsheet
Provides a focused SWOT summary for Lamor to quickly identify remediation areas and strategic opportunities, easing cross-team alignment; editable format lets teams update strengths, weaknesses, opportunities, and threats rapidly for timely decisions and stakeholder briefings.
Weaknesses
Project cyclicality
Large, irregular contracts and emergency-response jobs make revenue lumpy for Lamor, with cash flow sensitive to milestone-based payments and project timing; industry receivable days for environmental contractors averaged 60–90 days in 2024, elongating working capital cycles. Forecasting complexity increases operational risk, and equipment/staff utilization can drop to 40–60% between major deployments, pressing margins.
Exposure to oil sector
Dependence on hydrocarbon clients ties Lamor’s demand to O&G capex and spill-readiness budgets, leaving revenue cyclical when upstream spending fluctuates; Brent crude volatility (roughly $70–$90/bbl through 2024) illustrates this sensitivity. Public perception risk rises when servicing fossil-fuel operators, potentially affecting bids and partnerships. Energy downturns can delay orders or reduce service scope, and customer concentration may emerge in specific regions.
Capital intensity
Manufacturing specialized skimmers and maintaining response vessels requires significant capex, often ranging €0.5–5.0M per unit, straining cash flow. Inventory and spare parts holdings can tie up €0.1–2.0M in working capital for regional hubs. Scaling to multiple standby contracts raises fixed costs materially, and returns typically depend on sustaining utilization above ~70% and disciplined bidding to protect margins.
Tender dependence
Public procurement for Lamor is lengthy (commonly 6–12 months) and documentation-heavy, making bid timing unpredictable and causing quarterly revenue volatility; bid outcomes can swing quarterly performance by as much as 20–30%. Margin compression from low-cost competitors in commoditized equipment risks eroding gross margins by 200–500 bps. Rising compliance overheads push SG&A higher, increasing cost-to-serve.
- procurement-duration: 6–12 months
- quarterly-volatility: ±20–30%
- margin-compression: 200–500 bps
- sg&a-pressure: +2–4 ppt
Complex delivery
Multisite hazardous-waste and water-treatment projects expose Lamor to elevated execution risks due to complex logistics, permitting and HSE coordination across jurisdictions. Shortages of specialized operators constrain capacity and slow project ramp-up, while warranty and performance guarantees create cashflow and liability downside if systems underperform.
- Execution risk: multisite hazardous projects
- Logistics, permits, HSE complexity
- Skills shortage: specialized operators
- Downside: warranty/performance guarantees
Lumpy contracts, long procurements and high unit capex drive cash-flow and margin risk
Revenue is lumpy from large, milestone-driven contracts and emergency work (receivables 60–90 days; utilization 40–60%), raising cash‑flow and forecasting risk. Heavy exposure to hydrocarbon clients ties demand to O&G capex (Brent ~70–90 $/bbl in 2024) and raises reputational risk. High capex per unit (€0.5–5.0M), long procurement (6–12 months) and margin compression (200–500 bps) strain returns.
| Metric | Value |
|---|---|
| Receivable days | 60–90 |
| Utilization | 40–60% |
| Unit capex | €0.5–5.0M |
| Procurement | 6–12 months |
| Margin compression | 200–500 bps |
What You See Is What You Get
Lamor SWOT Analysis
This is the actual Lamor SWOT analysis document you’ll receive upon purchase—no surprises, just professional quality. The preview below is taken directly from the full report and reflects the same structured, editable file. Buy now to unlock the complete, in‑depth version immediately after checkout.
Description
Make Insightful Decisions Backed by Expert Research
Lamor’s proven oil-spill tech and global service network position it well in environmental remediation, yet supply-chain exposure and regulatory shifts create clear risks. Want the full strategic picture—detailed strengths, weaknesses, opportunities and threats with financial context and tactical recommendations? Purchase the complete SWOT for a professionally formatted Word report plus editable Excel matrix to plan, pitch, or invest with confidence.
Strengths
Global footprint
Operates across Europe, Americas, Middle East, Africa and Asia-Pacific, enabling rapid deployment to spill sites and polluted areas; Lamor has 34 years of operational experience. Global references with governments and major industry players and a Nasdaq Helsinki listing strengthen credibility in tenders. Geographic diversification helps smooth revenue volatility tied to any single market. Local partners and regional depots shorten response times and logistics.
Integrated solutions
Lamor combines equipment design and manufacturing with services and training to deliver end-to-end oil spill response packages, increasing client win rates and contract stickiness. Integrated service data continuously informs product upgrades, shortening development cycles and improving reliability. Training programs embed Lamor standards in client teams, creating recurring demand for maintenance and advisory services.
Technical know-how
Deep technical know-how: Lamor leverages over 40 years of oil‑spill and waste/water treatment experience, deploying proprietary IP and engineering teams that set it apart from generic gear suppliers. Proven field performance in 80+ countries and high‑visibility responses builds customer trust. Continuous R&D adapts tools for new pollutants and viscosities, supported by dedicated engineering centers.
Regulatory alignment
Solutions map directly to environmental compliance mandates for ports, O&G and municipalities, aligning with MARPOL (1973/78) Annex I on oil pollution and national spill preparedness rules, which helps clients prioritize budgets toward response capabilities. Certifications and audit-readiness shorten procurement cycles, while global policy tailwinds sustain long-term demand.
- Regulatory fit: MARPOL Annex I (1973/78)
- Budget support: spill preparedness prioritized
- Procurement: certifications speed approvals
Mission-driven brand
Lamor, listed on Nasdaq Helsinki, leverages a clear environmental purpose that resonates with public-sector and ESG-focused buyers and strengthens bid success for remediation contracts. Its proven reliability in crisis responses has built strong brand equity, while purpose-driven culture aids talent attraction and retention. Established credibility supports lead/consortium roles in large, multi-stakeholder remediation projects.
- Public-sector alignment
- ESG buyer appeal
- Crisis-proven reliability
- Talent magnet
- Consortium credibility
34 years, 80+ countries - Nasdaq Helsinki-listed oil-spill response firm with recurring revenue
Global footprint across Europe, Americas, MENA and APAC with 34 years operational experience and responses in 80+ countries; Nasdaq Helsinki listing strengthens tender credibility. Integrated equipment, services and training create end-to-end solutions that lock in clients and drive recurring revenue. Strong regulatory fit with MARPOL Annex I and growing ESG demand boost public-sector and corporate contracts.
| Metric | Value |
|---|---|
| Years operating | 34 |
| Countries served | 80+ |
| Stock listing | Nasdaq Helsinki |
What is included in the product
Detailed Word Document
Analyzes Lamor’s competitive position through key internal and external factors, highlighting strengths, weaknesses, opportunities, and threats that shape its strategic direction.
Customizable Excel Spreadsheet
Provides a focused SWOT summary for Lamor to quickly identify remediation areas and strategic opportunities, easing cross-team alignment; editable format lets teams update strengths, weaknesses, opportunities, and threats rapidly for timely decisions and stakeholder briefings.
Weaknesses
Project cyclicality
Large, irregular contracts and emergency-response jobs make revenue lumpy for Lamor, with cash flow sensitive to milestone-based payments and project timing; industry receivable days for environmental contractors averaged 60–90 days in 2024, elongating working capital cycles. Forecasting complexity increases operational risk, and equipment/staff utilization can drop to 40–60% between major deployments, pressing margins.
Exposure to oil sector
Dependence on hydrocarbon clients ties Lamor’s demand to O&G capex and spill-readiness budgets, leaving revenue cyclical when upstream spending fluctuates; Brent crude volatility (roughly $70–$90/bbl through 2024) illustrates this sensitivity. Public perception risk rises when servicing fossil-fuel operators, potentially affecting bids and partnerships. Energy downturns can delay orders or reduce service scope, and customer concentration may emerge in specific regions.
Capital intensity
Manufacturing specialized skimmers and maintaining response vessels requires significant capex, often ranging €0.5–5.0M per unit, straining cash flow. Inventory and spare parts holdings can tie up €0.1–2.0M in working capital for regional hubs. Scaling to multiple standby contracts raises fixed costs materially, and returns typically depend on sustaining utilization above ~70% and disciplined bidding to protect margins.
Tender dependence
Public procurement for Lamor is lengthy (commonly 6–12 months) and documentation-heavy, making bid timing unpredictable and causing quarterly revenue volatility; bid outcomes can swing quarterly performance by as much as 20–30%. Margin compression from low-cost competitors in commoditized equipment risks eroding gross margins by 200–500 bps. Rising compliance overheads push SG&A higher, increasing cost-to-serve.
- procurement-duration: 6–12 months
- quarterly-volatility: ±20–30%
- margin-compression: 200–500 bps
- sg&a-pressure: +2–4 ppt
Complex delivery
Multisite hazardous-waste and water-treatment projects expose Lamor to elevated execution risks due to complex logistics, permitting and HSE coordination across jurisdictions. Shortages of specialized operators constrain capacity and slow project ramp-up, while warranty and performance guarantees create cashflow and liability downside if systems underperform.
- Execution risk: multisite hazardous projects
- Logistics, permits, HSE complexity
- Skills shortage: specialized operators
- Downside: warranty/performance guarantees
Lumpy contracts, long procurements and high unit capex drive cash-flow and margin risk
Revenue is lumpy from large, milestone-driven contracts and emergency work (receivables 60–90 days; utilization 40–60%), raising cash‑flow and forecasting risk. Heavy exposure to hydrocarbon clients ties demand to O&G capex (Brent ~70–90 $/bbl in 2024) and raises reputational risk. High capex per unit (€0.5–5.0M), long procurement (6–12 months) and margin compression (200–500 bps) strain returns.
| Metric | Value |
|---|---|
| Receivable days | 60–90 |
| Utilization | 40–60% |
| Unit capex | €0.5–5.0M |
| Procurement | 6–12 months |
| Margin compression | 200–500 bps |
What You See Is What You Get
Lamor SWOT Analysis
This is the actual Lamor SWOT analysis document you’ll receive upon purchase—no surprises, just professional quality. The preview below is taken directly from the full report and reflects the same structured, editable file. Buy now to unlock the complete, in‑depth version immediately after checkout.











