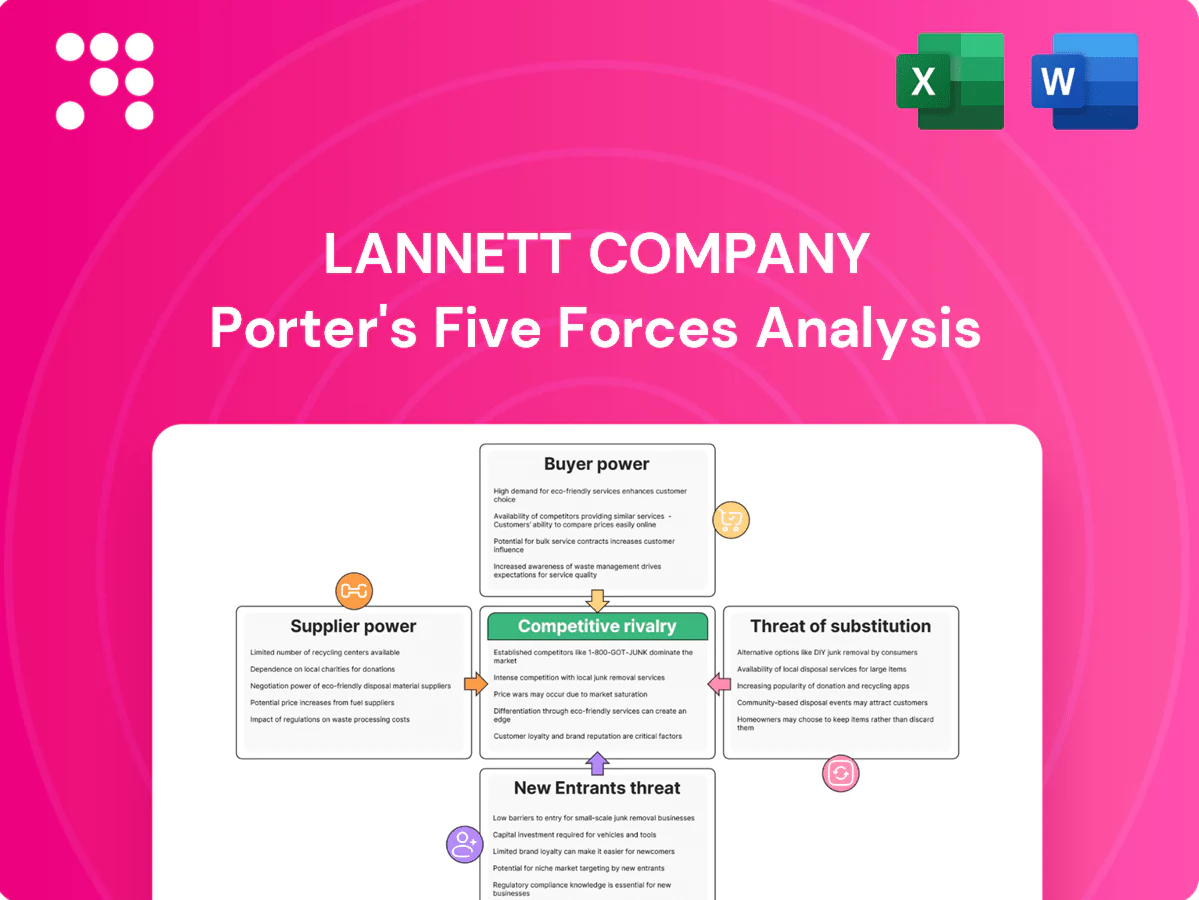
Lannett Company Porter's Five Forces Analysis

From Overview to Strategy Blueprint
Lannett faces intense generic rivalry and pricing pressure, moderate buyer power from large pharmacy chains, and supplier leverage on active ingredients that can raise costs; regulatory barriers temper new entrants while substitutes and patent cliffs pose notable threats. This brief snapshot only scratches the surface. Unlock the full Porter's Five Forces Analysis to explore Lannett Company’s competitive dynamics in detail.
Suppliers Bargaining Power

Concentrated API sources
Active pharmaceutical ingredients for Lannett are often sourced from a limited set of qualified suppliers, many based in India and China, concentrating supply risk and raising switching costs due to lengthy qualification and regulatory validation.
Such concentration increases lead times and gives suppliers leverage during shortages or regulatory disruptions, as seen in recurring API shortfalls affecting US generics markets in 2023–2024.
Lannett must dual-source critical APIs and hold elevated safety stocks to mitigate volatility and protect production continuity.
Regulatory-constrained inputs
Regulatory-constrained inputs force Lannett to source only cGMP-compliant suppliers with FDA or equivalent approvals, sharply narrowing the vendor pool and increasing per-unit procurement risk. Mandatory compliance audits and detailed quality agreements deepen dependency on approved partners and raise onboarding costs. Any supplier warning letter or import alert can abruptly choke supply and drive up API and finished-product costs, and Lannett’s robust quality oversight reduces but cannot remove this exposure.

Specialized packaging and equipment
Certain dosage forms require specialized packaging materials and line equipment, and in 2024 tooling, changeovers, and validation continued to make rapid supplier switching costly for Lannett. Vendors supplying blisters, HDPE containers, and serialization technology retained leverage in tight markets and could command favorable terms. Long-term contracts remained a primary tool to stabilize pricing and availability.

Logistics and lead-time risk
Global supply chains expose Lannett to shipping, customs and geopolitical disruption; in 2024 freight volatility remained above pre‑pandemic levels, increasing cost pressure. Extended API lead times amplify stockout and expedite costs for low‑margin generics, while freight spikes and port delays directly compress margins. Forward planning and nearshoring can moderate but not eliminate supplier leverage.
- Supply risk: shipping, customs, geopolitics
- Lead times: higher stockout/expedite costs
- Margin pressure: freight spikes, port delays
- Mitigation: forward planning, nearshoring (partial)
Contract development dependencies
For selected Lannett products the company relies on external CDMOs; know-how, tech transfers and stability data create vendor lock-in that can delay launches by weeks to months and raise COGS by mid-single to low-double-digit percentages.
Renegotiation or supplier capacity limits can materially affect timing and margin; co-invested manufacturing ties reduce supplier power but add capital and operational commitment risk.
India/China supply squeeze and cGMP limits push 5–15% COGS, delay launches
Supplier concentration in India/China and cGMP constraints give suppliers elevated leverage, causing recurring API shortfalls in US generics during 2023–2024 and forcing higher switching costs.
Needed dual‑sourcing, higher safety stock and long validation cycles raise COGS by ~5–15% and delay launches by weeks–months.
Freight and geopolitical volatility above pre‑pandemic levels in 2024 amplify expedite costs and margin pressure.
| Metric | 2024 | Impact |
|---|---|---|
| COGS change | +5–15% | Margins compressed |
| Launch delay | Weeks–months | Revenue timing risk |
| Supply shocks | Recurring 2023–24 | Expedite costs |
What is included in the product
 Detailed Word Document
Tailored Porter's Five Forces analysis for Lannett Company, uncovering key competitive drivers, supplier and buyer power, threats from substitutes and new entrants, and disruptive market forces affecting pricing and profitability.

 Customizable Excel Spreadsheet
A clear, one-sheet Porter's Five Forces summary for Lannett—instantly highlights regulatory risk, supplier concentration, and generic competition so leaders can make fast, informed decisions.
Customers Bargaining Power

Consolidated U.S. wholesalers
McKesson, AmerisourceBergen and Cardinal Health collectively control roughly 85% of U.S. pharmaceutical distribution; 2024 revenues were approx McKesson $265B, AmerisourceBergen $223B, Cardinal $176B. Their scale forces aggressive pricing, tight service and chargeback terms. Losing one account can cut a generic supplier's volumes by double-digit percentages. Lannett must compete on price, fill rate and reliability to retain share.
PBMs and GPOs dictate access
PBMs and GPOs aggregate roughly 80% of U.S. prescription volume and steer formularies, extracting rebates and favoring lowest net‑cost generics; rebates and fees often exceed 20% on formulary placement. Contract wins or losses can swing volumes by as much as 50%, so Lannett must submit competitive bids and maintain consistent supply to secure preferred tiers.

Low switching costs for buyers
Generics are commodity-like and A/B-rated therapeutically equivalent, so buyers switch rapidly among suppliers; generics accounted for about 90% of U.S. prescriptions in 2024, reinforcing buyer leverage. Price transparency and PBM contracting accelerate erosion after multi-source entry, while service differentiation (supply reliability, reps) helps but rarely overcomes meaningful price gaps.

Chargebacks and deductions
Complex contracting in pharmaceuticals drives chargebacks, administrative fees and returns that buyers wield to compress Lannetts realized price; 2024 industry analyses (IQVIA) report rising deductions and dispute volumes that tie up working capital and erode margins.
- Disputes delay cash flow and reduce margin recovery
- Chargebacks, admin fees and returns are primary price-compression levers
- Strong contract governance and automated data reconciliation are essential to protect economics
Tender and pack-size pressures
Large accounts demand precise pack sizes and logistics; for Lannett this concentrates leverage as top customers can represent over 60% of tender volume, so failing specs forfeits bids even if pricing is competitive. Penalties for stockouts — often contractual and escalating — increase buyer power, while flexible operations and tight forecast alignment reduce penalty exposure and customer churn.
- Key risk: bid forfeiture for noncompliant pack sizes
- Stockout penalties amplify buyer leverage
- Operational flexibility and forecast accuracy cut penalties and churn
Buyers wield leverage: concentrated distributors and PBMs; generics 90% shift wins
Buyers hold high leverage: McKesson/AmerisourceBergen/Cardinal ~85% distribution (2024 revs $265B/$223B/$176B) and PBMs/GPOs control ~80% Rx volume, enforcing rebates often >20%. Generics (~90% of U.S. scripts in 2024) enable rapid switching, so price, fill rate and pack‑spec compliance drive wins. Top accounts can constitute >60% tender volume, making stockouts and chargebacks critical margin risks.
| Metric | Value (2024) |
|---|---|
| Distributor share | ~85% |
| Distributor revenues | McK $265B / AmsB $223B / Card $176B |
| PBM/GPO Rx volume | ~80% |
| Generics share | ~90% |
| Top-account tender share | >60% |
| Common rebates/chargebacks | >20% |
Full Version Awaits
Lannett Company Porter's Five Forces Analysis
This preview shows the exact Porter's Five Forces analysis of Lannett Company you'll receive immediately after purchase—no surprises or placeholders. The document is fully formatted and ready for download and use the moment you buy. It covers competitive rivalry, threat of substitutes, buyer and supplier power, and barriers to entry with actionable insights.

From Overview to Strategy Blueprint
Lannett faces intense generic rivalry and pricing pressure, moderate buyer power from large pharmacy chains, and supplier leverage on active ingredients that can raise costs; regulatory barriers temper new entrants while substitutes and patent cliffs pose notable threats. This brief snapshot only scratches the surface. Unlock the full Porter's Five Forces Analysis to explore Lannett Company’s competitive dynamics in detail.
Suppliers Bargaining Power
Concentrated API sources
Active pharmaceutical ingredients for Lannett are often sourced from a limited set of qualified suppliers, many based in India and China, concentrating supply risk and raising switching costs due to lengthy qualification and regulatory validation.
Such concentration increases lead times and gives suppliers leverage during shortages or regulatory disruptions, as seen in recurring API shortfalls affecting US generics markets in 2023–2024.
Lannett must dual-source critical APIs and hold elevated safety stocks to mitigate volatility and protect production continuity.
Regulatory-constrained inputs
Regulatory-constrained inputs force Lannett to source only cGMP-compliant suppliers with FDA or equivalent approvals, sharply narrowing the vendor pool and increasing per-unit procurement risk. Mandatory compliance audits and detailed quality agreements deepen dependency on approved partners and raise onboarding costs. Any supplier warning letter or import alert can abruptly choke supply and drive up API and finished-product costs, and Lannett’s robust quality oversight reduces but cannot remove this exposure.
Specialized packaging and equipment
Certain dosage forms require specialized packaging materials and line equipment, and in 2024 tooling, changeovers, and validation continued to make rapid supplier switching costly for Lannett. Vendors supplying blisters, HDPE containers, and serialization technology retained leverage in tight markets and could command favorable terms. Long-term contracts remained a primary tool to stabilize pricing and availability.
Logistics and lead-time risk
Global supply chains expose Lannett to shipping, customs and geopolitical disruption; in 2024 freight volatility remained above pre‑pandemic levels, increasing cost pressure. Extended API lead times amplify stockout and expedite costs for low‑margin generics, while freight spikes and port delays directly compress margins. Forward planning and nearshoring can moderate but not eliminate supplier leverage.
- Supply risk: shipping, customs, geopolitics
- Lead times: higher stockout/expedite costs
- Margin pressure: freight spikes, port delays
- Mitigation: forward planning, nearshoring (partial)
Contract development dependencies
For selected Lannett products the company relies on external CDMOs; know-how, tech transfers and stability data create vendor lock-in that can delay launches by weeks to months and raise COGS by mid-single to low-double-digit percentages.
Renegotiation or supplier capacity limits can materially affect timing and margin; co-invested manufacturing ties reduce supplier power but add capital and operational commitment risk.
India/China supply squeeze and cGMP limits push 5–15% COGS, delay launches
Supplier concentration in India/China and cGMP constraints give suppliers elevated leverage, causing recurring API shortfalls in US generics during 2023–2024 and forcing higher switching costs.
Needed dual‑sourcing, higher safety stock and long validation cycles raise COGS by ~5–15% and delay launches by weeks–months.
Freight and geopolitical volatility above pre‑pandemic levels in 2024 amplify expedite costs and margin pressure.
| Metric | 2024 | Impact |
|---|---|---|
| COGS change | +5–15% | Margins compressed |
| Launch delay | Weeks–months | Revenue timing risk |
| Supply shocks | Recurring 2023–24 | Expedite costs |
What is included in the product
Detailed Word Document
Tailored Porter's Five Forces analysis for Lannett Company, uncovering key competitive drivers, supplier and buyer power, threats from substitutes and new entrants, and disruptive market forces affecting pricing and profitability.
Customizable Excel Spreadsheet
A clear, one-sheet Porter's Five Forces summary for Lannett—instantly highlights regulatory risk, supplier concentration, and generic competition so leaders can make fast, informed decisions.
Customers Bargaining Power
Consolidated U.S. wholesalers
McKesson, AmerisourceBergen and Cardinal Health collectively control roughly 85% of U.S. pharmaceutical distribution; 2024 revenues were approx McKesson $265B, AmerisourceBergen $223B, Cardinal $176B. Their scale forces aggressive pricing, tight service and chargeback terms. Losing one account can cut a generic supplier's volumes by double-digit percentages. Lannett must compete on price, fill rate and reliability to retain share.
PBMs and GPOs dictate access
PBMs and GPOs aggregate roughly 80% of U.S. prescription volume and steer formularies, extracting rebates and favoring lowest net‑cost generics; rebates and fees often exceed 20% on formulary placement. Contract wins or losses can swing volumes by as much as 50%, so Lannett must submit competitive bids and maintain consistent supply to secure preferred tiers.
Low switching costs for buyers
Generics are commodity-like and A/B-rated therapeutically equivalent, so buyers switch rapidly among suppliers; generics accounted for about 90% of U.S. prescriptions in 2024, reinforcing buyer leverage. Price transparency and PBM contracting accelerate erosion after multi-source entry, while service differentiation (supply reliability, reps) helps but rarely overcomes meaningful price gaps.
Chargebacks and deductions
Complex contracting in pharmaceuticals drives chargebacks, administrative fees and returns that buyers wield to compress Lannetts realized price; 2024 industry analyses (IQVIA) report rising deductions and dispute volumes that tie up working capital and erode margins.
- Disputes delay cash flow and reduce margin recovery
- Chargebacks, admin fees and returns are primary price-compression levers
- Strong contract governance and automated data reconciliation are essential to protect economics
Tender and pack-size pressures
Large accounts demand precise pack sizes and logistics; for Lannett this concentrates leverage as top customers can represent over 60% of tender volume, so failing specs forfeits bids even if pricing is competitive. Penalties for stockouts — often contractual and escalating — increase buyer power, while flexible operations and tight forecast alignment reduce penalty exposure and customer churn.
- Key risk: bid forfeiture for noncompliant pack sizes
- Stockout penalties amplify buyer leverage
- Operational flexibility and forecast accuracy cut penalties and churn
Buyers wield leverage: concentrated distributors and PBMs; generics 90% shift wins
Buyers hold high leverage: McKesson/AmerisourceBergen/Cardinal ~85% distribution (2024 revs $265B/$223B/$176B) and PBMs/GPOs control ~80% Rx volume, enforcing rebates often >20%. Generics (~90% of U.S. scripts in 2024) enable rapid switching, so price, fill rate and pack‑spec compliance drive wins. Top accounts can constitute >60% tender volume, making stockouts and chargebacks critical margin risks.
| Metric | Value (2024) |
|---|---|
| Distributor share | ~85% |
| Distributor revenues | McK $265B / AmsB $223B / Card $176B |
| PBM/GPO Rx volume | ~80% |
| Generics share | ~90% |
| Top-account tender share | >60% |
| Common rebates/chargebacks | >20% |
Full Version Awaits
Lannett Company Porter's Five Forces Analysis
This preview shows the exact Porter's Five Forces analysis of Lannett Company you'll receive immediately after purchase—no surprises or placeholders. The document is fully formatted and ready for download and use the moment you buy. It covers competitive rivalry, threat of substitutes, buyer and supplier power, and barriers to entry with actionable insights.
Description
From Overview to Strategy Blueprint
Lannett faces intense generic rivalry and pricing pressure, moderate buyer power from large pharmacy chains, and supplier leverage on active ingredients that can raise costs; regulatory barriers temper new entrants while substitutes and patent cliffs pose notable threats. This brief snapshot only scratches the surface. Unlock the full Porter's Five Forces Analysis to explore Lannett Company’s competitive dynamics in detail.
Suppliers Bargaining Power
Concentrated API sources
Active pharmaceutical ingredients for Lannett are often sourced from a limited set of qualified suppliers, many based in India and China, concentrating supply risk and raising switching costs due to lengthy qualification and regulatory validation.
Such concentration increases lead times and gives suppliers leverage during shortages or regulatory disruptions, as seen in recurring API shortfalls affecting US generics markets in 2023–2024.
Lannett must dual-source critical APIs and hold elevated safety stocks to mitigate volatility and protect production continuity.
Regulatory-constrained inputs
Regulatory-constrained inputs force Lannett to source only cGMP-compliant suppliers with FDA or equivalent approvals, sharply narrowing the vendor pool and increasing per-unit procurement risk. Mandatory compliance audits and detailed quality agreements deepen dependency on approved partners and raise onboarding costs. Any supplier warning letter or import alert can abruptly choke supply and drive up API and finished-product costs, and Lannett’s robust quality oversight reduces but cannot remove this exposure.
Specialized packaging and equipment
Certain dosage forms require specialized packaging materials and line equipment, and in 2024 tooling, changeovers, and validation continued to make rapid supplier switching costly for Lannett. Vendors supplying blisters, HDPE containers, and serialization technology retained leverage in tight markets and could command favorable terms. Long-term contracts remained a primary tool to stabilize pricing and availability.
Logistics and lead-time risk
Global supply chains expose Lannett to shipping, customs and geopolitical disruption; in 2024 freight volatility remained above pre‑pandemic levels, increasing cost pressure. Extended API lead times amplify stockout and expedite costs for low‑margin generics, while freight spikes and port delays directly compress margins. Forward planning and nearshoring can moderate but not eliminate supplier leverage.
- Supply risk: shipping, customs, geopolitics
- Lead times: higher stockout/expedite costs
- Margin pressure: freight spikes, port delays
- Mitigation: forward planning, nearshoring (partial)
Contract development dependencies
For selected Lannett products the company relies on external CDMOs; know-how, tech transfers and stability data create vendor lock-in that can delay launches by weeks to months and raise COGS by mid-single to low-double-digit percentages.
Renegotiation or supplier capacity limits can materially affect timing and margin; co-invested manufacturing ties reduce supplier power but add capital and operational commitment risk.
India/China supply squeeze and cGMP limits push 5–15% COGS, delay launches
Supplier concentration in India/China and cGMP constraints give suppliers elevated leverage, causing recurring API shortfalls in US generics during 2023–2024 and forcing higher switching costs.
Needed dual‑sourcing, higher safety stock and long validation cycles raise COGS by ~5–15% and delay launches by weeks–months.
Freight and geopolitical volatility above pre‑pandemic levels in 2024 amplify expedite costs and margin pressure.
| Metric | 2024 | Impact |
|---|---|---|
| COGS change | +5–15% | Margins compressed |
| Launch delay | Weeks–months | Revenue timing risk |
| Supply shocks | Recurring 2023–24 | Expedite costs |
What is included in the product
Detailed Word Document
Tailored Porter's Five Forces analysis for Lannett Company, uncovering key competitive drivers, supplier and buyer power, threats from substitutes and new entrants, and disruptive market forces affecting pricing and profitability.
Customizable Excel Spreadsheet
A clear, one-sheet Porter's Five Forces summary for Lannett—instantly highlights regulatory risk, supplier concentration, and generic competition so leaders can make fast, informed decisions.
Customers Bargaining Power
Consolidated U.S. wholesalers
McKesson, AmerisourceBergen and Cardinal Health collectively control roughly 85% of U.S. pharmaceutical distribution; 2024 revenues were approx McKesson $265B, AmerisourceBergen $223B, Cardinal $176B. Their scale forces aggressive pricing, tight service and chargeback terms. Losing one account can cut a generic supplier's volumes by double-digit percentages. Lannett must compete on price, fill rate and reliability to retain share.
PBMs and GPOs dictate access
PBMs and GPOs aggregate roughly 80% of U.S. prescription volume and steer formularies, extracting rebates and favoring lowest net‑cost generics; rebates and fees often exceed 20% on formulary placement. Contract wins or losses can swing volumes by as much as 50%, so Lannett must submit competitive bids and maintain consistent supply to secure preferred tiers.
Low switching costs for buyers
Generics are commodity-like and A/B-rated therapeutically equivalent, so buyers switch rapidly among suppliers; generics accounted for about 90% of U.S. prescriptions in 2024, reinforcing buyer leverage. Price transparency and PBM contracting accelerate erosion after multi-source entry, while service differentiation (supply reliability, reps) helps but rarely overcomes meaningful price gaps.
Chargebacks and deductions
Complex contracting in pharmaceuticals drives chargebacks, administrative fees and returns that buyers wield to compress Lannetts realized price; 2024 industry analyses (IQVIA) report rising deductions and dispute volumes that tie up working capital and erode margins.
- Disputes delay cash flow and reduce margin recovery
- Chargebacks, admin fees and returns are primary price-compression levers
- Strong contract governance and automated data reconciliation are essential to protect economics
Tender and pack-size pressures
Large accounts demand precise pack sizes and logistics; for Lannett this concentrates leverage as top customers can represent over 60% of tender volume, so failing specs forfeits bids even if pricing is competitive. Penalties for stockouts — often contractual and escalating — increase buyer power, while flexible operations and tight forecast alignment reduce penalty exposure and customer churn.
- Key risk: bid forfeiture for noncompliant pack sizes
- Stockout penalties amplify buyer leverage
- Operational flexibility and forecast accuracy cut penalties and churn
Buyers wield leverage: concentrated distributors and PBMs; generics 90% shift wins
Buyers hold high leverage: McKesson/AmerisourceBergen/Cardinal ~85% distribution (2024 revs $265B/$223B/$176B) and PBMs/GPOs control ~80% Rx volume, enforcing rebates often >20%. Generics (~90% of U.S. scripts in 2024) enable rapid switching, so price, fill rate and pack‑spec compliance drive wins. Top accounts can constitute >60% tender volume, making stockouts and chargebacks critical margin risks.
| Metric | Value (2024) |
|---|---|
| Distributor share | ~85% |
| Distributor revenues | McK $265B / AmsB $223B / Card $176B |
| PBM/GPO Rx volume | ~80% |
| Generics share | ~90% |
| Top-account tender share | >60% |
| Common rebates/chargebacks | >20% |
Full Version Awaits
Lannett Company Porter's Five Forces Analysis
This preview shows the exact Porter's Five Forces analysis of Lannett Company you'll receive immediately after purchase—no surprises or placeholders. The document is fully formatted and ready for download and use the moment you buy. It covers competitive rivalry, threat of substitutes, buyer and supplier power, and barriers to entry with actionable insights.











