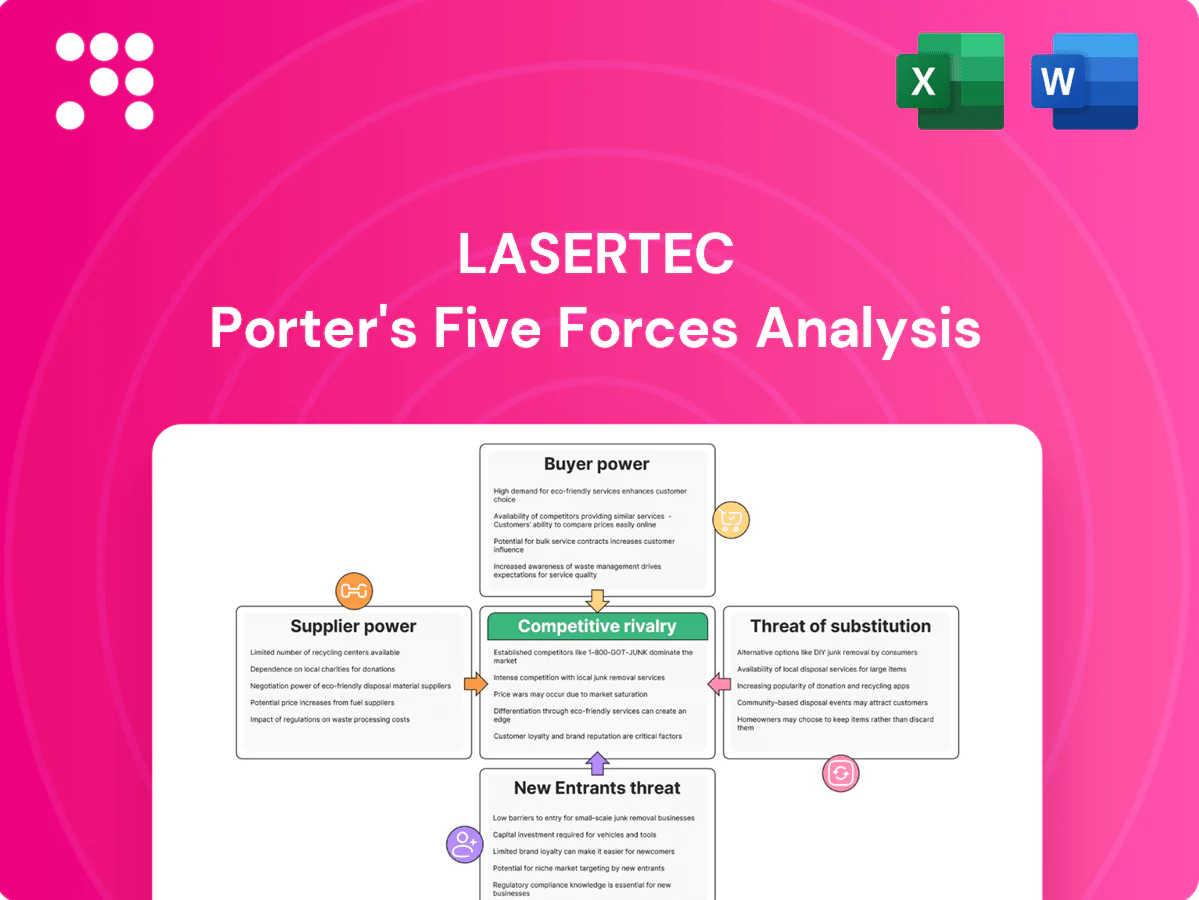
Lasertec Porter's Five Forces Analysis

Elevate Your Analysis with the Complete Porter's Five Forces Analysis
Lasertec operates in a high-tech optics niche where supplier precision, buyer concentration, and rapid innovation shape margins and entry barriers; substitutes and competitive rivalry intensify the strategic landscape. This brief snapshot only scratches the surface. Unlock the full Porter's Five Forces Analysis to explore Lasertec’s competitive dynamics, market pressures, and strategic advantages in detail.
Suppliers Bargaining Power

Concentrated precision component base
Ultra-precision optics, lasers and motion stages are sourced from a very small set of global vendors, increasing supplier leverage on pricing and lead times. Actinic/EUV-capable subsystems remain rarer—ASML is the sole supplier of high-volume EUV scanners—often single-sourced for key modules. This concentration boosts supplier bargaining power in upcycles. Lasertec mitigates via multi-sourcing and long-term agreements where feasible.
Long lead times, capacity bottlenecks
Specialty crystals, coatings and motion systems for Lasertec typically face long fabrication and calibration lead times (commonly 3–9 months), creating capacity bottlenecks that give suppliers leverage to prioritize higher-margin customers. Extended lead times and tight capacity mean allocation risk can delay Lasertec shipments by weeks to months during shortages. Maintaining buffer inventories and improving demand forecasting are essential mitigations.

High switching and requalification costs
Changing core components triggers requalification, tool re-tuning, and potential customer re-acceptance, processes that in semiconductor equipment often take 3–6 months and can cost up to $1M per tool, locking in incumbent suppliers and elevating their bargaining power. Component-level IP and proprietary firmware further entrench vendors, restricting third-party interchangeability. Lasertec mitigates this by designing modular interfaces and spare-part optionality to preserve procurement flexibility.

Geopolitics and export controls
Geopolitical export controls by the US, EU and Japan on advanced photonics, lasers and EUV-related items (strengthened through 2023–2024) constrain supplier sourcing and raise compliance costs for buyers like Lasertec. Sanctions or licensing requirements shift bargaining power toward suppliers with approved export authorizations, while currency swings (notably JPY volatility in 2023–24) amplify import cost risk. Lasertec’s Japan base eases access to trusted supplier ecosystems but cannot fully insulate it from regime shifts.
- Export controls tightened 2023–24
- Licensing tilts power to approved suppliers
- JPY volatility raised import costs in 2023–24
- Japan base improves access, not immunity
Counterweights from Lasertec’s scale
Rising unit volumes in EUV mask inspection and ongoing co-development programs have increased Lasertec’s buyer clout by creating predictable, multiyear demand and joint roadmaps that attract supplier investment and capacity allocation. Volume commitments enable negotiated price breaks and priority delivery windows, strengthening Lasertec’s leverage. Niche scarcity of high-precision components, however, prevents full normalization of supplier power.
- 2024: multiyear co-development deals strengthen supplier incentives
- Volume commitments yield price/priority concessions
- Niche component scarcity sustains supplier leverage
Supplier power high; lead times 3–9m, requal ~$1M
Supplier power is high: key optics and EUV modules are highly concentrated (ASML sole EUV scanner supplier), enabling price/lead-time leverage. Lead times for specialty crystals/coatings are 3–9 months; requalification typically 3–6 months and can cost ~$1M per tool. Lasertec offsets risk via multi-sourcing, long-term co-development and volume commitments in 2024.
| Metric | 2024 |
|---|---|
| Lead time | 3–9 months |
| Requal cost | ~$1M/tool |
| Supplier concentration | High (ASML sole EUV) |
What is included in the product
 Detailed Word Document
Tailored Porter's Five Forces analysis for Lasertec that uncovers competitive drivers, supplier and buyer power, substitute threats and new-entry risks, and highlights disruptive trends impacting market share and profitability—delivered in fully editable format for investor decks, strategy plans, or academic use.

 Customizable Excel Spreadsheet
Clean, one-sheet Lasertec Porter's Five Forces summary—ready to drop into pitch decks or boardroom slides to instantly calm stakeholder concerns about competitive pressure.
Customers Bargaining Power

Highly concentrated customer base
Major fabs and mask shops dominate demand — TSMC controls roughly 60% of global foundry capacity in 2024, with Samsung and Intel as other large buyers — concentrating purchasing power. Their scale and TSMC’s 2024 capex guidance of about $30 billion enable hard negotiations on price and terms. A small number of accounts create outsized revenue exposure for suppliers. Deep, multi‑year relationships and co‑development are essential to offset concentration risk.
Mission-critical, high switching costs
Inspection tools directly affect yield and cycle time, so each hour of downtime can translate to six-figure losses and weeks-long recovery; requalification and workflow retraining commonly take 4–12 weeks and often cost $100k–$1M, deterring swaps. Data-integration changes and MES validation add further friction, making installed bases sticky and reducing buyer leverage after install. Buyers therefore press for service-level agreements and uptime guarantees rather than steep price cuts.

Co-development and roadmap influence
Top-tier customers such as TSMC and Samsung increasingly shape next-node roadmaps for EUV masks and advanced packaging, with early-access deals traded for pricing concessions or limited exclusivity. These partnerships raise dependency yet cement incumbency, and extend sales cycles and engineering commitments by roughly 6–18 months per roadmap iteration.

Total cost and SLA pressures
Buyers push on total cost of ownership—throughput, false positives, consumables and field service drive procurement decisions; in 2024 many fabs benchmark TCO reductions of 5–12% when switching tools. Strong SLAs, remote diagnostics and upgrade paths are used as bargaining chips; SLA penalties commonly reach up to 5% of contract value.
- Multiyear service contracts negotiated aggressively
- Performance-linked terms can compress margins
- Remote diagnostics reduce field-service spend
Capital spending cyclicality
Semi capex cyclicality gives buyers timing leverage in downturns as 2024 equipment spending recovered about 20% YoY (SEMI), enabling order deferrals and batch purchasing that compress supplier pricing power and blur backlog visibility. In upturns urgency reduces haggling but increases delivery penalties and premium lead‑time claims. Lasertec mitigates this via diversified end‑use exposure and growing service revenue.
- 2024 equipment spend ≈ +20% YoY (SEMI)
- Deferrals shorten pricing visibility
- Upturns raise delivery penalties
- Lasertec hedges with services/diversification
Foundry dominance and 30B capex shift talks to SLAs; buyers seek 5-12% TCO cuts
Major fabs concentrate buying: TSMC ~60% foundry share in 2024 and ~$30B capex gives strong negotiating leverage; buyers demand SLAs and uptime over deep price cuts. Installed-base stickiness (4–12 week requalification; $100k–$1M) limits switching, while buyers push TCO cuts of 5–12% and use downturn timing to defer orders. SLA penalties commonly reach ~5% of contract value; 2024 equipment spend +20% YoY (SEMI).
| Metric | 2024 Value | Impact |
|---|---|---|
| TSMC foundry share | ~60% | Buyer concentration |
| TSMC capex | ~$30B | Negotiation power |
| Equipment spend YoY | +20% | Timing leverage |
| SLA penalty | ~5% contract | Price/service tradeoffs |
| TCO reduction when switching | 5–12% | Procurement focus |
| Requalification time/cost | 4–12 weeks; $100k–$1M | Switching friction |
Preview Before You Purchase
Lasertec Porter's Five Forces Analysis
This Lasertec Porter's Five Forces Analysis preview is the exact, professionally formatted document you will receive immediately after purchase, containing competitive assessment, supplier and buyer power, threat of substitutes, and industry rivalry insights. No placeholders or mockups—this file is ready for download and use the moment you buy. You’ll get instant access to this same complete analysis.

Elevate Your Analysis with the Complete Porter's Five Forces Analysis
Lasertec operates in a high-tech optics niche where supplier precision, buyer concentration, and rapid innovation shape margins and entry barriers; substitutes and competitive rivalry intensify the strategic landscape. This brief snapshot only scratches the surface. Unlock the full Porter's Five Forces Analysis to explore Lasertec’s competitive dynamics, market pressures, and strategic advantages in detail.
Suppliers Bargaining Power
Concentrated precision component base
Ultra-precision optics, lasers and motion stages are sourced from a very small set of global vendors, increasing supplier leverage on pricing and lead times. Actinic/EUV-capable subsystems remain rarer—ASML is the sole supplier of high-volume EUV scanners—often single-sourced for key modules. This concentration boosts supplier bargaining power in upcycles. Lasertec mitigates via multi-sourcing and long-term agreements where feasible.
Long lead times, capacity bottlenecks
Specialty crystals, coatings and motion systems for Lasertec typically face long fabrication and calibration lead times (commonly 3–9 months), creating capacity bottlenecks that give suppliers leverage to prioritize higher-margin customers. Extended lead times and tight capacity mean allocation risk can delay Lasertec shipments by weeks to months during shortages. Maintaining buffer inventories and improving demand forecasting are essential mitigations.
High switching and requalification costs
Changing core components triggers requalification, tool re-tuning, and potential customer re-acceptance, processes that in semiconductor equipment often take 3–6 months and can cost up to $1M per tool, locking in incumbent suppliers and elevating their bargaining power. Component-level IP and proprietary firmware further entrench vendors, restricting third-party interchangeability. Lasertec mitigates this by designing modular interfaces and spare-part optionality to preserve procurement flexibility.
Geopolitics and export controls
Geopolitical export controls by the US, EU and Japan on advanced photonics, lasers and EUV-related items (strengthened through 2023–2024) constrain supplier sourcing and raise compliance costs for buyers like Lasertec. Sanctions or licensing requirements shift bargaining power toward suppliers with approved export authorizations, while currency swings (notably JPY volatility in 2023–24) amplify import cost risk. Lasertec’s Japan base eases access to trusted supplier ecosystems but cannot fully insulate it from regime shifts.
- Export controls tightened 2023–24
- Licensing tilts power to approved suppliers
- JPY volatility raised import costs in 2023–24
- Japan base improves access, not immunity
Counterweights from Lasertec’s scale
Rising unit volumes in EUV mask inspection and ongoing co-development programs have increased Lasertec’s buyer clout by creating predictable, multiyear demand and joint roadmaps that attract supplier investment and capacity allocation. Volume commitments enable negotiated price breaks and priority delivery windows, strengthening Lasertec’s leverage. Niche scarcity of high-precision components, however, prevents full normalization of supplier power.
- 2024: multiyear co-development deals strengthen supplier incentives
- Volume commitments yield price/priority concessions
- Niche component scarcity sustains supplier leverage
Supplier power high; lead times 3–9m, requal ~$1M
Supplier power is high: key optics and EUV modules are highly concentrated (ASML sole EUV scanner supplier), enabling price/lead-time leverage. Lead times for specialty crystals/coatings are 3–9 months; requalification typically 3–6 months and can cost ~$1M per tool. Lasertec offsets risk via multi-sourcing, long-term co-development and volume commitments in 2024.
| Metric | 2024 |
|---|---|
| Lead time | 3–9 months |
| Requal cost | ~$1M/tool |
| Supplier concentration | High (ASML sole EUV) |
What is included in the product
Detailed Word Document
Tailored Porter's Five Forces analysis for Lasertec that uncovers competitive drivers, supplier and buyer power, substitute threats and new-entry risks, and highlights disruptive trends impacting market share and profitability—delivered in fully editable format for investor decks, strategy plans, or academic use.
Customizable Excel Spreadsheet
Clean, one-sheet Lasertec Porter's Five Forces summary—ready to drop into pitch decks or boardroom slides to instantly calm stakeholder concerns about competitive pressure.
Customers Bargaining Power
Highly concentrated customer base
Major fabs and mask shops dominate demand — TSMC controls roughly 60% of global foundry capacity in 2024, with Samsung and Intel as other large buyers — concentrating purchasing power. Their scale and TSMC’s 2024 capex guidance of about $30 billion enable hard negotiations on price and terms. A small number of accounts create outsized revenue exposure for suppliers. Deep, multi‑year relationships and co‑development are essential to offset concentration risk.
Mission-critical, high switching costs
Inspection tools directly affect yield and cycle time, so each hour of downtime can translate to six-figure losses and weeks-long recovery; requalification and workflow retraining commonly take 4–12 weeks and often cost $100k–$1M, deterring swaps. Data-integration changes and MES validation add further friction, making installed bases sticky and reducing buyer leverage after install. Buyers therefore press for service-level agreements and uptime guarantees rather than steep price cuts.
Co-development and roadmap influence
Top-tier customers such as TSMC and Samsung increasingly shape next-node roadmaps for EUV masks and advanced packaging, with early-access deals traded for pricing concessions or limited exclusivity. These partnerships raise dependency yet cement incumbency, and extend sales cycles and engineering commitments by roughly 6–18 months per roadmap iteration.
Total cost and SLA pressures
Buyers push on total cost of ownership—throughput, false positives, consumables and field service drive procurement decisions; in 2024 many fabs benchmark TCO reductions of 5–12% when switching tools. Strong SLAs, remote diagnostics and upgrade paths are used as bargaining chips; SLA penalties commonly reach up to 5% of contract value.
- Multiyear service contracts negotiated aggressively
- Performance-linked terms can compress margins
- Remote diagnostics reduce field-service spend
Capital spending cyclicality
Semi capex cyclicality gives buyers timing leverage in downturns as 2024 equipment spending recovered about 20% YoY (SEMI), enabling order deferrals and batch purchasing that compress supplier pricing power and blur backlog visibility. In upturns urgency reduces haggling but increases delivery penalties and premium lead‑time claims. Lasertec mitigates this via diversified end‑use exposure and growing service revenue.
- 2024 equipment spend ≈ +20% YoY (SEMI)
- Deferrals shorten pricing visibility
- Upturns raise delivery penalties
- Lasertec hedges with services/diversification
Foundry dominance and 30B capex shift talks to SLAs; buyers seek 5-12% TCO cuts
Major fabs concentrate buying: TSMC ~60% foundry share in 2024 and ~$30B capex gives strong negotiating leverage; buyers demand SLAs and uptime over deep price cuts. Installed-base stickiness (4–12 week requalification; $100k–$1M) limits switching, while buyers push TCO cuts of 5–12% and use downturn timing to defer orders. SLA penalties commonly reach ~5% of contract value; 2024 equipment spend +20% YoY (SEMI).
| Metric | 2024 Value | Impact |
|---|---|---|
| TSMC foundry share | ~60% | Buyer concentration |
| TSMC capex | ~$30B | Negotiation power |
| Equipment spend YoY | +20% | Timing leverage |
| SLA penalty | ~5% contract | Price/service tradeoffs |
| TCO reduction when switching | 5–12% | Procurement focus |
| Requalification time/cost | 4–12 weeks; $100k–$1M | Switching friction |
Preview Before You Purchase
Lasertec Porter's Five Forces Analysis
This Lasertec Porter's Five Forces Analysis preview is the exact, professionally formatted document you will receive immediately after purchase, containing competitive assessment, supplier and buyer power, threat of substitutes, and industry rivalry insights. No placeholders or mockups—this file is ready for download and use the moment you buy. You’ll get instant access to this same complete analysis.
Original: $10.00
-65%$10.00
$3.50Description
Elevate Your Analysis with the Complete Porter's Five Forces Analysis
Lasertec operates in a high-tech optics niche where supplier precision, buyer concentration, and rapid innovation shape margins and entry barriers; substitutes and competitive rivalry intensify the strategic landscape. This brief snapshot only scratches the surface. Unlock the full Porter's Five Forces Analysis to explore Lasertec’s competitive dynamics, market pressures, and strategic advantages in detail.
Suppliers Bargaining Power
Concentrated precision component base
Ultra-precision optics, lasers and motion stages are sourced from a very small set of global vendors, increasing supplier leverage on pricing and lead times. Actinic/EUV-capable subsystems remain rarer—ASML is the sole supplier of high-volume EUV scanners—often single-sourced for key modules. This concentration boosts supplier bargaining power in upcycles. Lasertec mitigates via multi-sourcing and long-term agreements where feasible.
Long lead times, capacity bottlenecks
Specialty crystals, coatings and motion systems for Lasertec typically face long fabrication and calibration lead times (commonly 3–9 months), creating capacity bottlenecks that give suppliers leverage to prioritize higher-margin customers. Extended lead times and tight capacity mean allocation risk can delay Lasertec shipments by weeks to months during shortages. Maintaining buffer inventories and improving demand forecasting are essential mitigations.
High switching and requalification costs
Changing core components triggers requalification, tool re-tuning, and potential customer re-acceptance, processes that in semiconductor equipment often take 3–6 months and can cost up to $1M per tool, locking in incumbent suppliers and elevating their bargaining power. Component-level IP and proprietary firmware further entrench vendors, restricting third-party interchangeability. Lasertec mitigates this by designing modular interfaces and spare-part optionality to preserve procurement flexibility.
Geopolitics and export controls
Geopolitical export controls by the US, EU and Japan on advanced photonics, lasers and EUV-related items (strengthened through 2023–2024) constrain supplier sourcing and raise compliance costs for buyers like Lasertec. Sanctions or licensing requirements shift bargaining power toward suppliers with approved export authorizations, while currency swings (notably JPY volatility in 2023–24) amplify import cost risk. Lasertec’s Japan base eases access to trusted supplier ecosystems but cannot fully insulate it from regime shifts.
- Export controls tightened 2023–24
- Licensing tilts power to approved suppliers
- JPY volatility raised import costs in 2023–24
- Japan base improves access, not immunity
Counterweights from Lasertec’s scale
Rising unit volumes in EUV mask inspection and ongoing co-development programs have increased Lasertec’s buyer clout by creating predictable, multiyear demand and joint roadmaps that attract supplier investment and capacity allocation. Volume commitments enable negotiated price breaks and priority delivery windows, strengthening Lasertec’s leverage. Niche scarcity of high-precision components, however, prevents full normalization of supplier power.
- 2024: multiyear co-development deals strengthen supplier incentives
- Volume commitments yield price/priority concessions
- Niche component scarcity sustains supplier leverage
Supplier power high; lead times 3–9m, requal ~$1M
Supplier power is high: key optics and EUV modules are highly concentrated (ASML sole EUV scanner supplier), enabling price/lead-time leverage. Lead times for specialty crystals/coatings are 3–9 months; requalification typically 3–6 months and can cost ~$1M per tool. Lasertec offsets risk via multi-sourcing, long-term co-development and volume commitments in 2024.
| Metric | 2024 |
|---|---|
| Lead time | 3–9 months |
| Requal cost | ~$1M/tool |
| Supplier concentration | High (ASML sole EUV) |
What is included in the product
Detailed Word Document
Tailored Porter's Five Forces analysis for Lasertec that uncovers competitive drivers, supplier and buyer power, substitute threats and new-entry risks, and highlights disruptive trends impacting market share and profitability—delivered in fully editable format for investor decks, strategy plans, or academic use.
Customizable Excel Spreadsheet
Clean, one-sheet Lasertec Porter's Five Forces summary—ready to drop into pitch decks or boardroom slides to instantly calm stakeholder concerns about competitive pressure.
Customers Bargaining Power
Highly concentrated customer base
Major fabs and mask shops dominate demand — TSMC controls roughly 60% of global foundry capacity in 2024, with Samsung and Intel as other large buyers — concentrating purchasing power. Their scale and TSMC’s 2024 capex guidance of about $30 billion enable hard negotiations on price and terms. A small number of accounts create outsized revenue exposure for suppliers. Deep, multi‑year relationships and co‑development are essential to offset concentration risk.
Mission-critical, high switching costs
Inspection tools directly affect yield and cycle time, so each hour of downtime can translate to six-figure losses and weeks-long recovery; requalification and workflow retraining commonly take 4–12 weeks and often cost $100k–$1M, deterring swaps. Data-integration changes and MES validation add further friction, making installed bases sticky and reducing buyer leverage after install. Buyers therefore press for service-level agreements and uptime guarantees rather than steep price cuts.
Co-development and roadmap influence
Top-tier customers such as TSMC and Samsung increasingly shape next-node roadmaps for EUV masks and advanced packaging, with early-access deals traded for pricing concessions or limited exclusivity. These partnerships raise dependency yet cement incumbency, and extend sales cycles and engineering commitments by roughly 6–18 months per roadmap iteration.
Total cost and SLA pressures
Buyers push on total cost of ownership—throughput, false positives, consumables and field service drive procurement decisions; in 2024 many fabs benchmark TCO reductions of 5–12% when switching tools. Strong SLAs, remote diagnostics and upgrade paths are used as bargaining chips; SLA penalties commonly reach up to 5% of contract value.
- Multiyear service contracts negotiated aggressively
- Performance-linked terms can compress margins
- Remote diagnostics reduce field-service spend
Capital spending cyclicality
Semi capex cyclicality gives buyers timing leverage in downturns as 2024 equipment spending recovered about 20% YoY (SEMI), enabling order deferrals and batch purchasing that compress supplier pricing power and blur backlog visibility. In upturns urgency reduces haggling but increases delivery penalties and premium lead‑time claims. Lasertec mitigates this via diversified end‑use exposure and growing service revenue.
- 2024 equipment spend ≈ +20% YoY (SEMI)
- Deferrals shorten pricing visibility
- Upturns raise delivery penalties
- Lasertec hedges with services/diversification
Foundry dominance and 30B capex shift talks to SLAs; buyers seek 5-12% TCO cuts
Major fabs concentrate buying: TSMC ~60% foundry share in 2024 and ~$30B capex gives strong negotiating leverage; buyers demand SLAs and uptime over deep price cuts. Installed-base stickiness (4–12 week requalification; $100k–$1M) limits switching, while buyers push TCO cuts of 5–12% and use downturn timing to defer orders. SLA penalties commonly reach ~5% of contract value; 2024 equipment spend +20% YoY (SEMI).
| Metric | 2024 Value | Impact |
|---|---|---|
| TSMC foundry share | ~60% | Buyer concentration |
| TSMC capex | ~$30B | Negotiation power |
| Equipment spend YoY | +20% | Timing leverage |
| SLA penalty | ~5% contract | Price/service tradeoffs |
| TCO reduction when switching | 5–12% | Procurement focus |
| Requalification time/cost | 4–12 weeks; $100k–$1M | Switching friction |
Preview Before You Purchase
Lasertec Porter's Five Forces Analysis
This Lasertec Porter's Five Forces Analysis preview is the exact, professionally formatted document you will receive immediately after purchase, containing competitive assessment, supplier and buyer power, threat of substitutes, and industry rivalry insights. No placeholders or mockups—this file is ready for download and use the moment you buy. You’ll get instant access to this same complete analysis.











