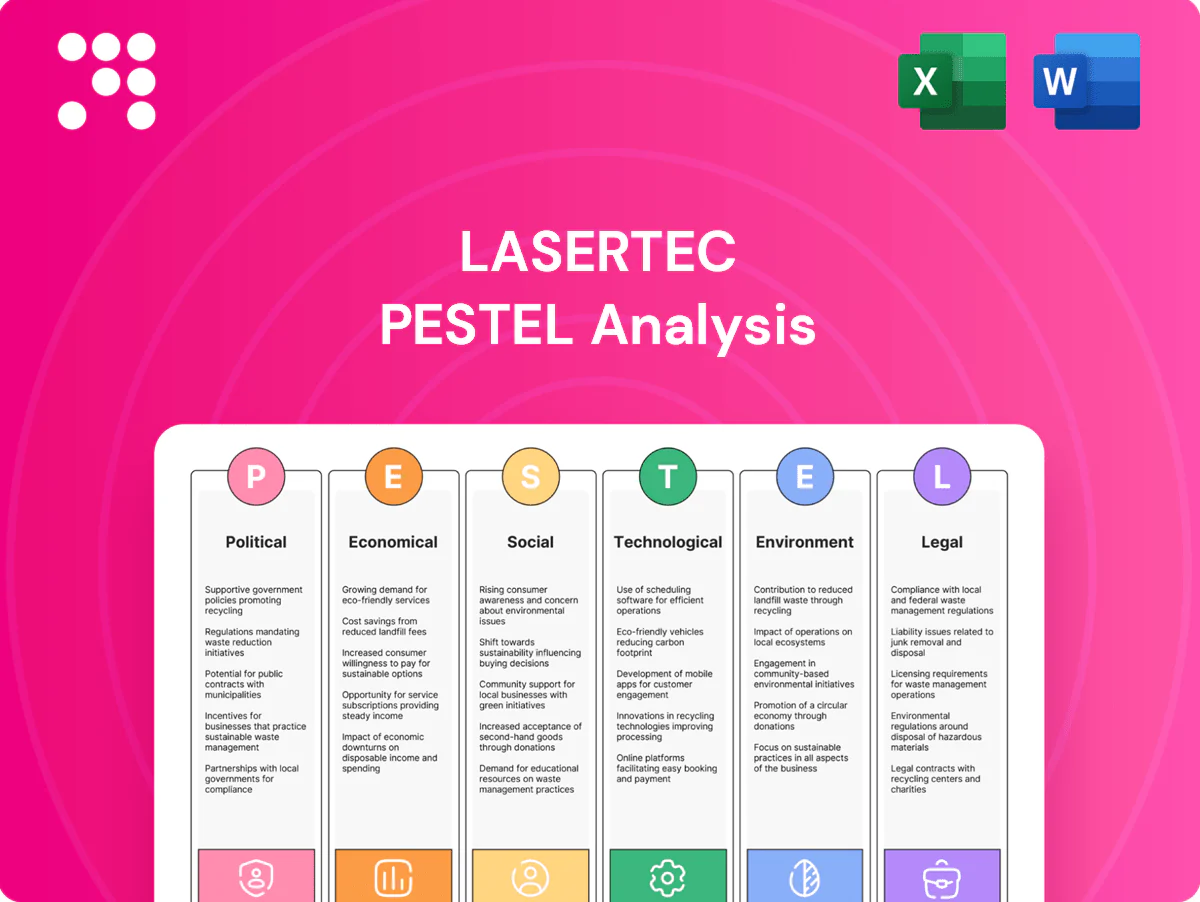
Lasertec PESTLE Analysis

Your Shortcut to Market Insight Starts Here
Our targeted PESTLE analysis reveals how political shifts, economic cycles, and rapid tech innovation shape Lasertec’s competitive outlook. Packed with actionable risk assessments and strategic opportunities, it’s tailored for investors and strategists. Purchase the full report to access the complete breakdown and ready-to-use insights.
Political factors

US–China tech tensions
US export controls expanded in October 2022 and were tightened further in 2023, restricting advanced semiconductor tool shipments and adding licensing delays often measured in months, which pressures Lasertec’s market access and delivery timelines. Lasertec’s EUV mask and wafer inspection systems may require export licenses, increasing compliance costs and uncertainty. Changes to control lists or thresholds can rapidly alter addressable demand—China represented roughly 35% of global semiconductor consumption in 2023—so diversifying customers and geographies mitigates concentration risk.
Japan industrial policy
Japan’s 2 trillion yen semiconductor push and tax incentives for fabs boost domestic R&D and capacity, directly supporting demand for Lasertec metrology tools. State-backed partnerships and TSMC’s ~1.4 trillion yen Kumamoto investment improve demand visibility and order pipelines. Policy continuity shapes Lasertec’s multi-year capital planning and access to national programs can accelerate next-gen tool development and commercialization.

Taiwan and regional security
Geopolitical risk around Taiwan—home to TSMC with roughly 60% of global foundry share and the bulk of advanced-node capacity—increases volatility in global chip capex cycles and supply continuity. Customers have publicly signalled order timing shifts during past Taiwan tensions, delaying or re-routing investments and affecting Lasertec’s booking cadence. Robust business continuity, multi-site support and insurance/logistics hedges are essential to limit revenue and delivery disruption.

Global standards diplomacy
Global metrology and lithography standards drive interoperability and adoption; SEMI reported over 2,300 member companies in 2024, so Lasertec’s active consortia participation can shift specifications toward its inspection strengths, while misalignment raises customers’ integration and retraining costs and delays node qualification.
- Standards influence interoperability
- SEMI membership >2,300 (2024)
- Consortia shape specs favoring vendors
- Misalignment increases integration costs
- Early compliance accelerates node qualification
Trade agreements and tariffs
Tariff regimes and FTAs such as CPTPP (effective 2018), the Japan-EU EPA (effective 2019) and RCEP (effective 2022) materially affect Lasertec pricing and margins on exported tools and parts by lowering duties and compliance costs in key markets. Retaliatory tariffs (eg. measures since 2018 under Section 301) can erode competitiveness and increase landed costs, while preferential access reduces lead times and total landed cost. Strategic localization of service hubs and spare parts inventories in partner markets mitigates tariff friction and shortens response times.
- Tariff cuts via FTAs reduce landed costs and duty exposure
- Retaliatory tariffs (post-2018) increase costs and margin pressure
- Preferential market access lowers lead times and logistics costs
- Localized service hubs bypass trade friction and protect competitiveness
Export controls limit China access; Japan subsidies and TSMC dominance drive capex volatility
Export controls since 2022 and 2023 licensing tightening constrain Lasertec’s China access (China ~35% global semiconductor consumption in 2023) and add compliance costs; Japan’s 2 trillion yen semiconductor push and TSMC’s ~60% advanced foundry share (2024) support domestic demand; geopolitical risk around Taiwan raises capex volatility; SEMI membership >2,300 (2024) shapes standards and adoption.
| Metric | Value |
|---|---|
| China share (2023) | ~35% |
| TSMC advanced foundry (2024) | ~60% |
| SEMI members (2024) | >2,300 |
| Japan subsidy | 2 trillion yen |
What is included in the product
 Detailed Word Document
Explores how Political, Economic, Social, Technological, Environmental, and Legal forces uniquely impact Lasertec, with each category backed by current data and trend analysis to reveal risks, opportunities and scenario-ready insights; tailored for executives, investors and strategists to inform decision-making and fundraising.

 Customizable Excel Spreadsheet
A concise, visually segmented Lasertec PESTLE summary that simplifies external risk assessment for meetings, can be dropped into slides or annotated with local context, and is easily shareable for quick cross-team strategic alignment.
Economic factors

Semiconductor capex cycles
Inspection demand follows wafer fab and mask shop capex cycles: downturns compress orders while node transitions (e.g., EUV adoption) expand TAM, and SEMI forecast in 2025 expects a modest recovery after 2023–24 softness. Backlog management at Lasertec smooths revenue volatility by phasing deliveries and preserving ASPs. Flexible product mix across defect inspection and metrology supports margins through cycles.
Currency volatility (JPY)
Revenue invoiced in USD/EUR versus production and component costs in JPY creates material FX exposure for Lasertec; the yen traded around 145–155 JPY/USD through 2024–mid‑2025, so a weaker yen lifts reported yen sales but raises imported component costs. Hedging programs are used to stabilize earnings, and contractual pricing clauses with customers help share FX movements.

CHIPS-like subsidies globally
US, EU, Japan and Korea incentives are catalyzing greenfield fabs and advanced packaging lines.
US CHIPS Act provides $52.7B and the EU Chips Act targets mobilizing €43B; Japan and Korea offer multi‑billion subsidies supporting fabs and packaging.
Subsidized projects give multi‑year visibility for inspection tools, though grant timing slippage can delay orders; close alignment with beneficiaries secures design‑ins.

Supply chain constraints
- Lead times: 20–30 weeks
- Inventory pressure: higher working capital / longer inventory days
- Mitigation: dual-sourcing + buffers
- Benefit: supplier collaboration improves yield and reliability
Customer consolidation
Customer consolidation concentrates buying power and raises qualification hurdles; TSMC held about 56% wafer foundry share in 2024 and the top 5 foundries/IDMs drive roughly 60%+ of capex, so landing a key account can lock in repeat orders across nodes. Intense pricing pressure demands clear ROI justification, while service and uptime SLAs become commercial differentiators.
- Concentration: TSMC ~56% (2024)
- Capex share: top5 IDMs/foundries ≈60%+
- Impact: winning accounts → repeat multi-node orders
- Commercial: pricing pressure + SLA-based competition
Export controls limit China access; Japan subsidies and TSMC dominance drive capex volatility
Inspection demand tracks wafer-fab capex cycles; node shifts (EUV) expand TAM while 2023–24 softness gives modest 2025 recovery. Yen at ~145–155 JPY/USD creates FX swing; hedges and contracts mitigate. CHIPS-like subsidies (US $52.7B, EU €43B) boost multi‑year tool visibility; TSMC ≈56% share; lead times 20–30 weeks.
| Metric | Value |
|---|---|
| Yen | 145–155 JPY/USD |
| US CHIPS | $52.7B |
| EU Chips | €43B |
| TSMC share | ≈56% |
| Lead times | 20–30 wks |
What You See Is What You Get
Lasertec PESTLE Analysis
The preview shown here is the exact document you’ll receive after purchase—fully formatted and ready to use. The Lasertec PESTLE Analysis delivers clear political, economic, social, technological, legal and environmental insights tailored to Lasertec, highlighting key drivers and risks. It includes strategic implications and action points for decision-makers. No placeholders; instant download after payment.

Your Shortcut to Market Insight Starts Here
Our targeted PESTLE analysis reveals how political shifts, economic cycles, and rapid tech innovation shape Lasertec’s competitive outlook. Packed with actionable risk assessments and strategic opportunities, it’s tailored for investors and strategists. Purchase the full report to access the complete breakdown and ready-to-use insights.
Political factors
US–China tech tensions
US export controls expanded in October 2022 and were tightened further in 2023, restricting advanced semiconductor tool shipments and adding licensing delays often measured in months, which pressures Lasertec’s market access and delivery timelines. Lasertec’s EUV mask and wafer inspection systems may require export licenses, increasing compliance costs and uncertainty. Changes to control lists or thresholds can rapidly alter addressable demand—China represented roughly 35% of global semiconductor consumption in 2023—so diversifying customers and geographies mitigates concentration risk.
Japan industrial policy
Japan’s 2 trillion yen semiconductor push and tax incentives for fabs boost domestic R&D and capacity, directly supporting demand for Lasertec metrology tools. State-backed partnerships and TSMC’s ~1.4 trillion yen Kumamoto investment improve demand visibility and order pipelines. Policy continuity shapes Lasertec’s multi-year capital planning and access to national programs can accelerate next-gen tool development and commercialization.
Taiwan and regional security
Geopolitical risk around Taiwan—home to TSMC with roughly 60% of global foundry share and the bulk of advanced-node capacity—increases volatility in global chip capex cycles and supply continuity. Customers have publicly signalled order timing shifts during past Taiwan tensions, delaying or re-routing investments and affecting Lasertec’s booking cadence. Robust business continuity, multi-site support and insurance/logistics hedges are essential to limit revenue and delivery disruption.
Global standards diplomacy
Global metrology and lithography standards drive interoperability and adoption; SEMI reported over 2,300 member companies in 2024, so Lasertec’s active consortia participation can shift specifications toward its inspection strengths, while misalignment raises customers’ integration and retraining costs and delays node qualification.
- Standards influence interoperability
- SEMI membership >2,300 (2024)
- Consortia shape specs favoring vendors
- Misalignment increases integration costs
- Early compliance accelerates node qualification
Trade agreements and tariffs
Tariff regimes and FTAs such as CPTPP (effective 2018), the Japan-EU EPA (effective 2019) and RCEP (effective 2022) materially affect Lasertec pricing and margins on exported tools and parts by lowering duties and compliance costs in key markets. Retaliatory tariffs (eg. measures since 2018 under Section 301) can erode competitiveness and increase landed costs, while preferential access reduces lead times and total landed cost. Strategic localization of service hubs and spare parts inventories in partner markets mitigates tariff friction and shortens response times.
- Tariff cuts via FTAs reduce landed costs and duty exposure
- Retaliatory tariffs (post-2018) increase costs and margin pressure
- Preferential market access lowers lead times and logistics costs
- Localized service hubs bypass trade friction and protect competitiveness
Export controls limit China access; Japan subsidies and TSMC dominance drive capex volatility
Export controls since 2022 and 2023 licensing tightening constrain Lasertec’s China access (China ~35% global semiconductor consumption in 2023) and add compliance costs; Japan’s 2 trillion yen semiconductor push and TSMC’s ~60% advanced foundry share (2024) support domestic demand; geopolitical risk around Taiwan raises capex volatility; SEMI membership >2,300 (2024) shapes standards and adoption.
| Metric | Value |
|---|---|
| China share (2023) | ~35% |
| TSMC advanced foundry (2024) | ~60% |
| SEMI members (2024) | >2,300 |
| Japan subsidy | 2 trillion yen |
What is included in the product
Detailed Word Document
Explores how Political, Economic, Social, Technological, Environmental, and Legal forces uniquely impact Lasertec, with each category backed by current data and trend analysis to reveal risks, opportunities and scenario-ready insights; tailored for executives, investors and strategists to inform decision-making and fundraising.
Customizable Excel Spreadsheet
A concise, visually segmented Lasertec PESTLE summary that simplifies external risk assessment for meetings, can be dropped into slides or annotated with local context, and is easily shareable for quick cross-team strategic alignment.
Economic factors
Semiconductor capex cycles
Inspection demand follows wafer fab and mask shop capex cycles: downturns compress orders while node transitions (e.g., EUV adoption) expand TAM, and SEMI forecast in 2025 expects a modest recovery after 2023–24 softness. Backlog management at Lasertec smooths revenue volatility by phasing deliveries and preserving ASPs. Flexible product mix across defect inspection and metrology supports margins through cycles.
Currency volatility (JPY)
Revenue invoiced in USD/EUR versus production and component costs in JPY creates material FX exposure for Lasertec; the yen traded around 145–155 JPY/USD through 2024–mid‑2025, so a weaker yen lifts reported yen sales but raises imported component costs. Hedging programs are used to stabilize earnings, and contractual pricing clauses with customers help share FX movements.
CHIPS-like subsidies globally
US, EU, Japan and Korea incentives are catalyzing greenfield fabs and advanced packaging lines.
US CHIPS Act provides $52.7B and the EU Chips Act targets mobilizing €43B; Japan and Korea offer multi‑billion subsidies supporting fabs and packaging.
Subsidized projects give multi‑year visibility for inspection tools, though grant timing slippage can delay orders; close alignment with beneficiaries secures design‑ins.
Supply chain constraints
- Lead times: 20–30 weeks
- Inventory pressure: higher working capital / longer inventory days
- Mitigation: dual-sourcing + buffers
- Benefit: supplier collaboration improves yield and reliability
Customer consolidation
Customer consolidation concentrates buying power and raises qualification hurdles; TSMC held about 56% wafer foundry share in 2024 and the top 5 foundries/IDMs drive roughly 60%+ of capex, so landing a key account can lock in repeat orders across nodes. Intense pricing pressure demands clear ROI justification, while service and uptime SLAs become commercial differentiators.
- Concentration: TSMC ~56% (2024)
- Capex share: top5 IDMs/foundries ≈60%+
- Impact: winning accounts → repeat multi-node orders
- Commercial: pricing pressure + SLA-based competition
Export controls limit China access; Japan subsidies and TSMC dominance drive capex volatility
Inspection demand tracks wafer-fab capex cycles; node shifts (EUV) expand TAM while 2023–24 softness gives modest 2025 recovery. Yen at ~145–155 JPY/USD creates FX swing; hedges and contracts mitigate. CHIPS-like subsidies (US $52.7B, EU €43B) boost multi‑year tool visibility; TSMC ≈56% share; lead times 20–30 weeks.
| Metric | Value |
|---|---|
| Yen | 145–155 JPY/USD |
| US CHIPS | $52.7B |
| EU Chips | €43B |
| TSMC share | ≈56% |
| Lead times | 20–30 wks |
What You See Is What You Get
Lasertec PESTLE Analysis
The preview shown here is the exact document you’ll receive after purchase—fully formatted and ready to use. The Lasertec PESTLE Analysis delivers clear political, economic, social, technological, legal and environmental insights tailored to Lasertec, highlighting key drivers and risks. It includes strategic implications and action points for decision-makers. No placeholders; instant download after payment.
Original: $10.00
-65%$10.00
$3.50Description
Your Shortcut to Market Insight Starts Here
Our targeted PESTLE analysis reveals how political shifts, economic cycles, and rapid tech innovation shape Lasertec’s competitive outlook. Packed with actionable risk assessments and strategic opportunities, it’s tailored for investors and strategists. Purchase the full report to access the complete breakdown and ready-to-use insights.
Political factors
US–China tech tensions
US export controls expanded in October 2022 and were tightened further in 2023, restricting advanced semiconductor tool shipments and adding licensing delays often measured in months, which pressures Lasertec’s market access and delivery timelines. Lasertec’s EUV mask and wafer inspection systems may require export licenses, increasing compliance costs and uncertainty. Changes to control lists or thresholds can rapidly alter addressable demand—China represented roughly 35% of global semiconductor consumption in 2023—so diversifying customers and geographies mitigates concentration risk.
Japan industrial policy
Japan’s 2 trillion yen semiconductor push and tax incentives for fabs boost domestic R&D and capacity, directly supporting demand for Lasertec metrology tools. State-backed partnerships and TSMC’s ~1.4 trillion yen Kumamoto investment improve demand visibility and order pipelines. Policy continuity shapes Lasertec’s multi-year capital planning and access to national programs can accelerate next-gen tool development and commercialization.
Taiwan and regional security
Geopolitical risk around Taiwan—home to TSMC with roughly 60% of global foundry share and the bulk of advanced-node capacity—increases volatility in global chip capex cycles and supply continuity. Customers have publicly signalled order timing shifts during past Taiwan tensions, delaying or re-routing investments and affecting Lasertec’s booking cadence. Robust business continuity, multi-site support and insurance/logistics hedges are essential to limit revenue and delivery disruption.
Global standards diplomacy
Global metrology and lithography standards drive interoperability and adoption; SEMI reported over 2,300 member companies in 2024, so Lasertec’s active consortia participation can shift specifications toward its inspection strengths, while misalignment raises customers’ integration and retraining costs and delays node qualification.
- Standards influence interoperability
- SEMI membership >2,300 (2024)
- Consortia shape specs favoring vendors
- Misalignment increases integration costs
- Early compliance accelerates node qualification
Trade agreements and tariffs
Tariff regimes and FTAs such as CPTPP (effective 2018), the Japan-EU EPA (effective 2019) and RCEP (effective 2022) materially affect Lasertec pricing and margins on exported tools and parts by lowering duties and compliance costs in key markets. Retaliatory tariffs (eg. measures since 2018 under Section 301) can erode competitiveness and increase landed costs, while preferential access reduces lead times and total landed cost. Strategic localization of service hubs and spare parts inventories in partner markets mitigates tariff friction and shortens response times.
- Tariff cuts via FTAs reduce landed costs and duty exposure
- Retaliatory tariffs (post-2018) increase costs and margin pressure
- Preferential market access lowers lead times and logistics costs
- Localized service hubs bypass trade friction and protect competitiveness
Export controls limit China access; Japan subsidies and TSMC dominance drive capex volatility
Export controls since 2022 and 2023 licensing tightening constrain Lasertec’s China access (China ~35% global semiconductor consumption in 2023) and add compliance costs; Japan’s 2 trillion yen semiconductor push and TSMC’s ~60% advanced foundry share (2024) support domestic demand; geopolitical risk around Taiwan raises capex volatility; SEMI membership >2,300 (2024) shapes standards and adoption.
| Metric | Value |
|---|---|
| China share (2023) | ~35% |
| TSMC advanced foundry (2024) | ~60% |
| SEMI members (2024) | >2,300 |
| Japan subsidy | 2 trillion yen |
What is included in the product
Detailed Word Document
Explores how Political, Economic, Social, Technological, Environmental, and Legal forces uniquely impact Lasertec, with each category backed by current data and trend analysis to reveal risks, opportunities and scenario-ready insights; tailored for executives, investors and strategists to inform decision-making and fundraising.
Customizable Excel Spreadsheet
A concise, visually segmented Lasertec PESTLE summary that simplifies external risk assessment for meetings, can be dropped into slides or annotated with local context, and is easily shareable for quick cross-team strategic alignment.
Economic factors
Semiconductor capex cycles
Inspection demand follows wafer fab and mask shop capex cycles: downturns compress orders while node transitions (e.g., EUV adoption) expand TAM, and SEMI forecast in 2025 expects a modest recovery after 2023–24 softness. Backlog management at Lasertec smooths revenue volatility by phasing deliveries and preserving ASPs. Flexible product mix across defect inspection and metrology supports margins through cycles.
Currency volatility (JPY)
Revenue invoiced in USD/EUR versus production and component costs in JPY creates material FX exposure for Lasertec; the yen traded around 145–155 JPY/USD through 2024–mid‑2025, so a weaker yen lifts reported yen sales but raises imported component costs. Hedging programs are used to stabilize earnings, and contractual pricing clauses with customers help share FX movements.
CHIPS-like subsidies globally
US, EU, Japan and Korea incentives are catalyzing greenfield fabs and advanced packaging lines.
US CHIPS Act provides $52.7B and the EU Chips Act targets mobilizing €43B; Japan and Korea offer multi‑billion subsidies supporting fabs and packaging.
Subsidized projects give multi‑year visibility for inspection tools, though grant timing slippage can delay orders; close alignment with beneficiaries secures design‑ins.
Supply chain constraints
- Lead times: 20–30 weeks
- Inventory pressure: higher working capital / longer inventory days
- Mitigation: dual-sourcing + buffers
- Benefit: supplier collaboration improves yield and reliability
Customer consolidation
Customer consolidation concentrates buying power and raises qualification hurdles; TSMC held about 56% wafer foundry share in 2024 and the top 5 foundries/IDMs drive roughly 60%+ of capex, so landing a key account can lock in repeat orders across nodes. Intense pricing pressure demands clear ROI justification, while service and uptime SLAs become commercial differentiators.
- Concentration: TSMC ~56% (2024)
- Capex share: top5 IDMs/foundries ≈60%+
- Impact: winning accounts → repeat multi-node orders
- Commercial: pricing pressure + SLA-based competition
Export controls limit China access; Japan subsidies and TSMC dominance drive capex volatility
Inspection demand tracks wafer-fab capex cycles; node shifts (EUV) expand TAM while 2023–24 softness gives modest 2025 recovery. Yen at ~145–155 JPY/USD creates FX swing; hedges and contracts mitigate. CHIPS-like subsidies (US $52.7B, EU €43B) boost multi‑year tool visibility; TSMC ≈56% share; lead times 20–30 weeks.
| Metric | Value |
|---|---|
| Yen | 145–155 JPY/USD |
| US CHIPS | $52.7B |
| EU Chips | €43B |
| TSMC share | ≈56% |
| Lead times | 20–30 wks |
What You See Is What You Get
Lasertec PESTLE Analysis
The preview shown here is the exact document you’ll receive after purchase—fully formatted and ready to use. The Lasertec PESTLE Analysis delivers clear political, economic, social, technological, legal and environmental insights tailored to Lasertec, highlighting key drivers and risks. It includes strategic implications and action points for decision-makers. No placeholders; instant download after payment.











