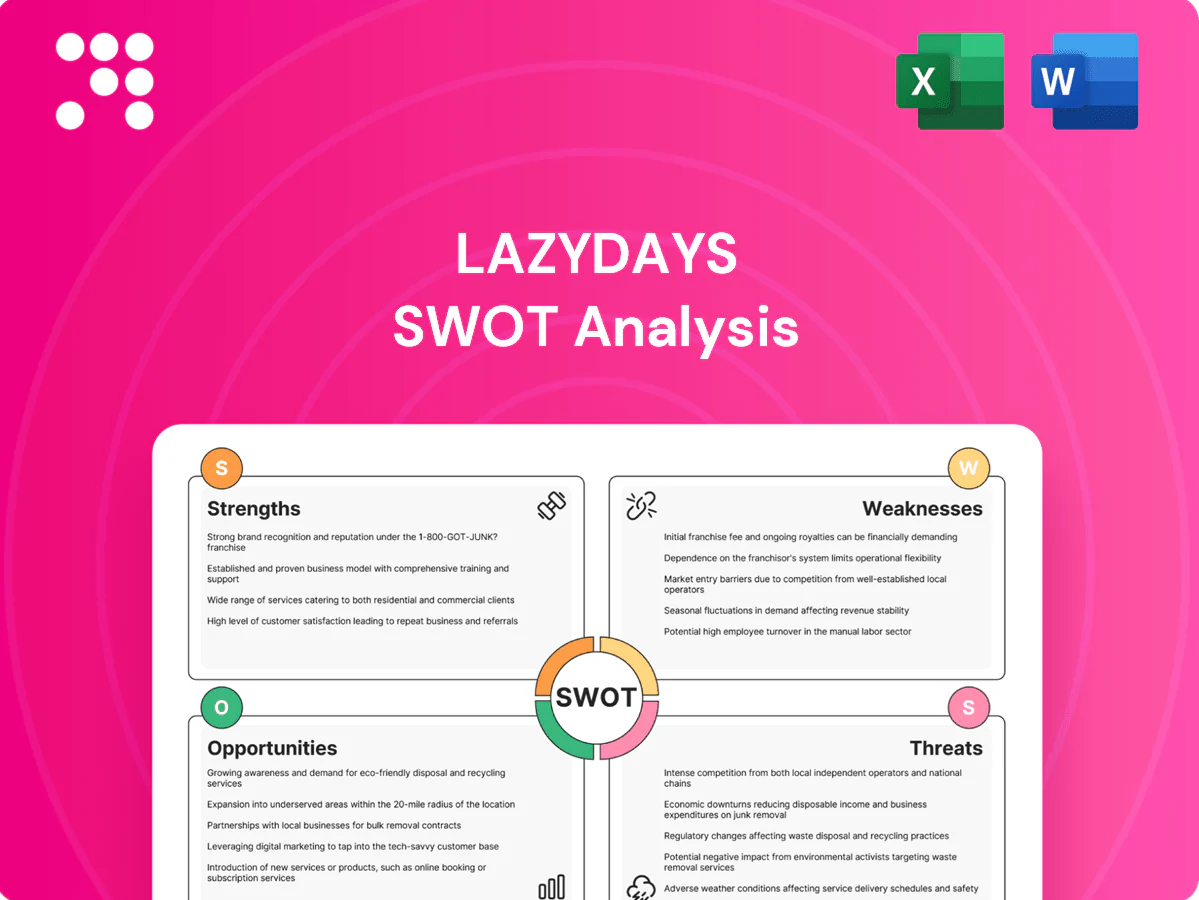
Lazydays SWOT Analysis

Make Insightful Decisions Backed by Expert Research
Lazydays benefits from strong brand recognition in the RV market, extensive dealership and service networks, and growing aftermarket opportunities. However, cyclical consumer demand and supply-chain volatility pose risks. Want the full strategic picture? Purchase the complete SWOT analysis for a research-backed, editable report and Excel tools to plan and invest with confidence.
Strengths

Extensive multi-location dealership network
Wide geographic coverage with over 10 dealership locations increases brand visibility and customer access across key U.S. RV markets. The larger footprint supports scale efficiencies in procurement, marketing and logistics, lowering per-unit costs. It enables inventory rebalancing among stores to match regional demand, improving turns. The network effect strengthens bargaining power with suppliers and lenders.
Comprehensive end-to-end offering
Lazydays (NASDAQ: LAZY) sells new and used RVs and complements them with service, parts, accessories, rentals, financing and insurance, creating a one-stop model that boosts customer convenience and wallet share. High attachment rates on F&I, extended warranties and accessories lift gross margins. Cross-selling across the ownership lifecycle enhances retention and referral potential.

Diverse OEM relationships and broad inventory mix
Diverse OEM relationships let Lazydays source models across towables and motorhomes to match varied budgets and use cases, supporting faster inventory turns when buyer preference shifts; the RV industry saw over 350,000 wholesale shipments in 2023 (RVIA), underscoring demand volatility. Broad assortments reduce reliance on any single brand’s cycle and strong OEM ties improve allocation during tight supply.

Recognized brand with enthusiast community
Lazydays is a recognized, publicly traded RV dealer (NASDAQ: LAZY) whose owner-focused events, education programs and online communities deepen engagement and after-sales loyalty, reducing perceived risk on high‑value purchases. Trusted reputation and brand equity support stronger pricing power and higher lead-to-sale conversion versus smaller independents. Community-driven referrals and repeat customers lower acquisition costs and lengthen customer lifetime value.
- Brand: public ticker LAZY
- Engagement: events + owner communities
- Benefit: pricing power & higher conversion
- Outcome: lower acquisition, higher LTV
Recurring, higher-margin service and F&I revenues
Service, parts and protection-product sales at Lazydays produce steadier cash flows than unit sales, with management reporting that after-sales channels contributed roughly 30% of revenue and materially higher gross margins in FY2024.
Higher-margin service and F&I mix boosted company profitability through 2024, anchoring long-term customer relationships via service capacity and improving per-unit economics through F&I expertise and better close rates.
- Recurring revenue: ~30% of 2024 revenue
- Higher gross margins: service/parts vs units
- Service capacity = customer retention
- F&I expertise = improved close rates & per-unit profit
10+ dealerships lower per-unit costs; after-sales (~30%) boost margins and retention
Lazydays (NASDAQ: LAZY) leverages 10+ dealership locations and diverse OEM relationships to lower per-unit costs and rebalance inventory regionally. A one-stop model (sales, service, parts, F&I) drives higher margins and retention; after-sales accounted for ~30% of revenue in FY2024. Strong brand, events and owner communities increase pricing power and conversion versus independents.
| Metric | Value | Note |
|---|---|---|
| Dealerships | 10+ | National coverage |
| After-sales rev | ~30% | FY2024 |
| Public ticker | LAZY | Nasdaq |
| RV industry | 350,000 | 2023 wholesale shipments (RVIA) |
What is included in the product
 Detailed Word Document
Delivers a strategic overview of Lazydays’s internal and external business factors, outlining strengths, weaknesses, opportunities, and threats to assess growth drivers, operational gaps, and market risks.

 Customizable Excel Spreadsheet
Provides a concise, visual SWOT matrix tailored to Lazydays for rapid identification and resolution of strategic pain points, enabling quick edits and integration into presentations and reports.
Weaknesses

High exposure to cyclical, discretionary spending
High exposure to cyclical, discretionary spending leaves Lazydays vulnerable because RV purchases are large, deferrable outlays tied closely to consumer confidence. Macroeconomic slowdowns can sharply compress unit volumes and force price markdowns. Rapid declines in used-inventory values during downcycles heighten margin risk and complicate forecasting and capacity planning.
Capital-intensive inventory and floorplan dependence
Carrying a broad RV selection requires heavy working capital and reliance on floorplan financing, which in adverse cycles raises interest expense and carrying costs and compresses margins. Slow turns force discounts or write-downs when inventory mix is misaligned. Liquidity can tighten quickly if lenders tighten floorplan terms or pull credit in a downturn, increasing refinancing risk and cash strain.

Operational complexity across dispersed locations
Standardizing processes, training, and CX across Lazydays’ dispersed footprint is difficult at scale; inconsistent local demand and labor availability—after RV shipments peaked near 600,000 units in 2021—create performance variability. Ongoing systems integration for CRM, inventory, and service scheduling demands continuous IT investment, and execution risk rises sharply during rapid expansion or acquisitions.

Limited diversification beyond RV retail
Core revenues remain concentrated in RV retail, with the business deriving the majority of sales from vehicle and service operations, exposing Lazydays to demand swings if outdoor travel preferences shift or fuel and travel costs rise.
- Revenue concentration: majority from RV retail
- Demand risk: sensitive to outdoor travel trends
- Limited diversification into adjacent verticals
- Higher risk vs multi-category retailers
Sensitivity to used vehicle residual values
Lazydays faces material sensitivity to used-RV residuals: swings in trade-in and used pricing compress gross profit and extend turn times, with used RV wholesale values retreating roughly 15–25% from 2022 peaks into 2024 across industry indices. Appraisal errors drive margin leakage and aged inventory, and repossession upticks in 2023–24 amplified exposure, forcing faster repricing and remarketing.
- Trade-in pricing volatility — higher turn times
- Appraisal errors — margin leakage, aged stock
- Rapid market resets — need agile pricing
- Elevated repossessions 2023–24 — increased exposure
RV cyclicality: used values down 15-25%, rising rates and working-capital stress
High cyclicality: RV shipments peaked near 600,000 units in 2021, leaving Lazydays exposed to demand swings. Used-RV values fell ~15–25% from 2022 peaks into 2024, compressing gross margins and extending turns. Heavy working capital and floorplan reliance increased interest expense as benchmark rates rose toward ~5% in 2023–24. Operational variability across locations raises execution and integration risk.
| Metric | 2021–24 |
|---|---|
| Industry shipments | ~600,000 (2021 peak) |
| Used RV value change | -15–25% (2022→2024) |
| Benchmark rates | ~5% (2023–24) |
Same Document Delivered
Lazydays SWOT Analysis
This is the actual SWOT analysis document you’ll receive upon purchase—no surprises, just professional quality. The preview below is taken directly from the full Lazydays SWOT report you'll get, with strengths, weaknesses, opportunities and threats fully detailed. Purchase unlocks the editable, complete version for immediate download.

Make Insightful Decisions Backed by Expert Research
Lazydays benefits from strong brand recognition in the RV market, extensive dealership and service networks, and growing aftermarket opportunities. However, cyclical consumer demand and supply-chain volatility pose risks. Want the full strategic picture? Purchase the complete SWOT analysis for a research-backed, editable report and Excel tools to plan and invest with confidence.
Strengths
Extensive multi-location dealership network
Wide geographic coverage with over 10 dealership locations increases brand visibility and customer access across key U.S. RV markets. The larger footprint supports scale efficiencies in procurement, marketing and logistics, lowering per-unit costs. It enables inventory rebalancing among stores to match regional demand, improving turns. The network effect strengthens bargaining power with suppliers and lenders.
Comprehensive end-to-end offering
Lazydays (NASDAQ: LAZY) sells new and used RVs and complements them with service, parts, accessories, rentals, financing and insurance, creating a one-stop model that boosts customer convenience and wallet share. High attachment rates on F&I, extended warranties and accessories lift gross margins. Cross-selling across the ownership lifecycle enhances retention and referral potential.
Diverse OEM relationships and broad inventory mix
Diverse OEM relationships let Lazydays source models across towables and motorhomes to match varied budgets and use cases, supporting faster inventory turns when buyer preference shifts; the RV industry saw over 350,000 wholesale shipments in 2023 (RVIA), underscoring demand volatility. Broad assortments reduce reliance on any single brand’s cycle and strong OEM ties improve allocation during tight supply.
Recognized brand with enthusiast community
Lazydays is a recognized, publicly traded RV dealer (NASDAQ: LAZY) whose owner-focused events, education programs and online communities deepen engagement and after-sales loyalty, reducing perceived risk on high‑value purchases. Trusted reputation and brand equity support stronger pricing power and higher lead-to-sale conversion versus smaller independents. Community-driven referrals and repeat customers lower acquisition costs and lengthen customer lifetime value.
- Brand: public ticker LAZY
- Engagement: events + owner communities
- Benefit: pricing power & higher conversion
- Outcome: lower acquisition, higher LTV
Recurring, higher-margin service and F&I revenues
Service, parts and protection-product sales at Lazydays produce steadier cash flows than unit sales, with management reporting that after-sales channels contributed roughly 30% of revenue and materially higher gross margins in FY2024.
Higher-margin service and F&I mix boosted company profitability through 2024, anchoring long-term customer relationships via service capacity and improving per-unit economics through F&I expertise and better close rates.
- Recurring revenue: ~30% of 2024 revenue
- Higher gross margins: service/parts vs units
- Service capacity = customer retention
- F&I expertise = improved close rates & per-unit profit
10+ dealerships lower per-unit costs; after-sales (~30%) boost margins and retention
Lazydays (NASDAQ: LAZY) leverages 10+ dealership locations and diverse OEM relationships to lower per-unit costs and rebalance inventory regionally. A one-stop model (sales, service, parts, F&I) drives higher margins and retention; after-sales accounted for ~30% of revenue in FY2024. Strong brand, events and owner communities increase pricing power and conversion versus independents.
| Metric | Value | Note |
|---|---|---|
| Dealerships | 10+ | National coverage |
| After-sales rev | ~30% | FY2024 |
| Public ticker | LAZY | Nasdaq |
| RV industry | 350,000 | 2023 wholesale shipments (RVIA) |
What is included in the product
Detailed Word Document
Delivers a strategic overview of Lazydays’s internal and external business factors, outlining strengths, weaknesses, opportunities, and threats to assess growth drivers, operational gaps, and market risks.
Customizable Excel Spreadsheet
Provides a concise, visual SWOT matrix tailored to Lazydays for rapid identification and resolution of strategic pain points, enabling quick edits and integration into presentations and reports.
Weaknesses
High exposure to cyclical, discretionary spending
High exposure to cyclical, discretionary spending leaves Lazydays vulnerable because RV purchases are large, deferrable outlays tied closely to consumer confidence. Macroeconomic slowdowns can sharply compress unit volumes and force price markdowns. Rapid declines in used-inventory values during downcycles heighten margin risk and complicate forecasting and capacity planning.
Capital-intensive inventory and floorplan dependence
Carrying a broad RV selection requires heavy working capital and reliance on floorplan financing, which in adverse cycles raises interest expense and carrying costs and compresses margins. Slow turns force discounts or write-downs when inventory mix is misaligned. Liquidity can tighten quickly if lenders tighten floorplan terms or pull credit in a downturn, increasing refinancing risk and cash strain.
Operational complexity across dispersed locations
Standardizing processes, training, and CX across Lazydays’ dispersed footprint is difficult at scale; inconsistent local demand and labor availability—after RV shipments peaked near 600,000 units in 2021—create performance variability. Ongoing systems integration for CRM, inventory, and service scheduling demands continuous IT investment, and execution risk rises sharply during rapid expansion or acquisitions.
Limited diversification beyond RV retail
Core revenues remain concentrated in RV retail, with the business deriving the majority of sales from vehicle and service operations, exposing Lazydays to demand swings if outdoor travel preferences shift or fuel and travel costs rise.
- Revenue concentration: majority from RV retail
- Demand risk: sensitive to outdoor travel trends
- Limited diversification into adjacent verticals
- Higher risk vs multi-category retailers
Sensitivity to used vehicle residual values
Lazydays faces material sensitivity to used-RV residuals: swings in trade-in and used pricing compress gross profit and extend turn times, with used RV wholesale values retreating roughly 15–25% from 2022 peaks into 2024 across industry indices. Appraisal errors drive margin leakage and aged inventory, and repossession upticks in 2023–24 amplified exposure, forcing faster repricing and remarketing.
- Trade-in pricing volatility — higher turn times
- Appraisal errors — margin leakage, aged stock
- Rapid market resets — need agile pricing
- Elevated repossessions 2023–24 — increased exposure
RV cyclicality: used values down 15-25%, rising rates and working-capital stress
High cyclicality: RV shipments peaked near 600,000 units in 2021, leaving Lazydays exposed to demand swings. Used-RV values fell ~15–25% from 2022 peaks into 2024, compressing gross margins and extending turns. Heavy working capital and floorplan reliance increased interest expense as benchmark rates rose toward ~5% in 2023–24. Operational variability across locations raises execution and integration risk.
| Metric | 2021–24 |
|---|---|
| Industry shipments | ~600,000 (2021 peak) |
| Used RV value change | -15–25% (2022→2024) |
| Benchmark rates | ~5% (2023–24) |
Same Document Delivered
Lazydays SWOT Analysis
This is the actual SWOT analysis document you’ll receive upon purchase—no surprises, just professional quality. The preview below is taken directly from the full Lazydays SWOT report you'll get, with strengths, weaknesses, opportunities and threats fully detailed. Purchase unlocks the editable, complete version for immediate download.
Original: $10.00
-65%$10.00
$3.50Description
Make Insightful Decisions Backed by Expert Research
Lazydays benefits from strong brand recognition in the RV market, extensive dealership and service networks, and growing aftermarket opportunities. However, cyclical consumer demand and supply-chain volatility pose risks. Want the full strategic picture? Purchase the complete SWOT analysis for a research-backed, editable report and Excel tools to plan and invest with confidence.
Strengths
Extensive multi-location dealership network
Wide geographic coverage with over 10 dealership locations increases brand visibility and customer access across key U.S. RV markets. The larger footprint supports scale efficiencies in procurement, marketing and logistics, lowering per-unit costs. It enables inventory rebalancing among stores to match regional demand, improving turns. The network effect strengthens bargaining power with suppliers and lenders.
Comprehensive end-to-end offering
Lazydays (NASDAQ: LAZY) sells new and used RVs and complements them with service, parts, accessories, rentals, financing and insurance, creating a one-stop model that boosts customer convenience and wallet share. High attachment rates on F&I, extended warranties and accessories lift gross margins. Cross-selling across the ownership lifecycle enhances retention and referral potential.
Diverse OEM relationships and broad inventory mix
Diverse OEM relationships let Lazydays source models across towables and motorhomes to match varied budgets and use cases, supporting faster inventory turns when buyer preference shifts; the RV industry saw over 350,000 wholesale shipments in 2023 (RVIA), underscoring demand volatility. Broad assortments reduce reliance on any single brand’s cycle and strong OEM ties improve allocation during tight supply.
Recognized brand with enthusiast community
Lazydays is a recognized, publicly traded RV dealer (NASDAQ: LAZY) whose owner-focused events, education programs and online communities deepen engagement and after-sales loyalty, reducing perceived risk on high‑value purchases. Trusted reputation and brand equity support stronger pricing power and higher lead-to-sale conversion versus smaller independents. Community-driven referrals and repeat customers lower acquisition costs and lengthen customer lifetime value.
- Brand: public ticker LAZY
- Engagement: events + owner communities
- Benefit: pricing power & higher conversion
- Outcome: lower acquisition, higher LTV
Recurring, higher-margin service and F&I revenues
Service, parts and protection-product sales at Lazydays produce steadier cash flows than unit sales, with management reporting that after-sales channels contributed roughly 30% of revenue and materially higher gross margins in FY2024.
Higher-margin service and F&I mix boosted company profitability through 2024, anchoring long-term customer relationships via service capacity and improving per-unit economics through F&I expertise and better close rates.
- Recurring revenue: ~30% of 2024 revenue
- Higher gross margins: service/parts vs units
- Service capacity = customer retention
- F&I expertise = improved close rates & per-unit profit
10+ dealerships lower per-unit costs; after-sales (~30%) boost margins and retention
Lazydays (NASDAQ: LAZY) leverages 10+ dealership locations and diverse OEM relationships to lower per-unit costs and rebalance inventory regionally. A one-stop model (sales, service, parts, F&I) drives higher margins and retention; after-sales accounted for ~30% of revenue in FY2024. Strong brand, events and owner communities increase pricing power and conversion versus independents.
| Metric | Value | Note |
|---|---|---|
| Dealerships | 10+ | National coverage |
| After-sales rev | ~30% | FY2024 |
| Public ticker | LAZY | Nasdaq |
| RV industry | 350,000 | 2023 wholesale shipments (RVIA) |
What is included in the product
Detailed Word Document
Delivers a strategic overview of Lazydays’s internal and external business factors, outlining strengths, weaknesses, opportunities, and threats to assess growth drivers, operational gaps, and market risks.
Customizable Excel Spreadsheet
Provides a concise, visual SWOT matrix tailored to Lazydays for rapid identification and resolution of strategic pain points, enabling quick edits and integration into presentations and reports.
Weaknesses
High exposure to cyclical, discretionary spending
High exposure to cyclical, discretionary spending leaves Lazydays vulnerable because RV purchases are large, deferrable outlays tied closely to consumer confidence. Macroeconomic slowdowns can sharply compress unit volumes and force price markdowns. Rapid declines in used-inventory values during downcycles heighten margin risk and complicate forecasting and capacity planning.
Capital-intensive inventory and floorplan dependence
Carrying a broad RV selection requires heavy working capital and reliance on floorplan financing, which in adverse cycles raises interest expense and carrying costs and compresses margins. Slow turns force discounts or write-downs when inventory mix is misaligned. Liquidity can tighten quickly if lenders tighten floorplan terms or pull credit in a downturn, increasing refinancing risk and cash strain.
Operational complexity across dispersed locations
Standardizing processes, training, and CX across Lazydays’ dispersed footprint is difficult at scale; inconsistent local demand and labor availability—after RV shipments peaked near 600,000 units in 2021—create performance variability. Ongoing systems integration for CRM, inventory, and service scheduling demands continuous IT investment, and execution risk rises sharply during rapid expansion or acquisitions.
Limited diversification beyond RV retail
Core revenues remain concentrated in RV retail, with the business deriving the majority of sales from vehicle and service operations, exposing Lazydays to demand swings if outdoor travel preferences shift or fuel and travel costs rise.
- Revenue concentration: majority from RV retail
- Demand risk: sensitive to outdoor travel trends
- Limited diversification into adjacent verticals
- Higher risk vs multi-category retailers
Sensitivity to used vehicle residual values
Lazydays faces material sensitivity to used-RV residuals: swings in trade-in and used pricing compress gross profit and extend turn times, with used RV wholesale values retreating roughly 15–25% from 2022 peaks into 2024 across industry indices. Appraisal errors drive margin leakage and aged inventory, and repossession upticks in 2023–24 amplified exposure, forcing faster repricing and remarketing.
- Trade-in pricing volatility — higher turn times
- Appraisal errors — margin leakage, aged stock
- Rapid market resets — need agile pricing
- Elevated repossessions 2023–24 — increased exposure
RV cyclicality: used values down 15-25%, rising rates and working-capital stress
High cyclicality: RV shipments peaked near 600,000 units in 2021, leaving Lazydays exposed to demand swings. Used-RV values fell ~15–25% from 2022 peaks into 2024, compressing gross margins and extending turns. Heavy working capital and floorplan reliance increased interest expense as benchmark rates rose toward ~5% in 2023–24. Operational variability across locations raises execution and integration risk.
| Metric | 2021–24 |
|---|---|
| Industry shipments | ~600,000 (2021 peak) |
| Used RV value change | -15–25% (2022→2024) |
| Benchmark rates | ~5% (2023–24) |
Same Document Delivered
Lazydays SWOT Analysis
This is the actual SWOT analysis document you’ll receive upon purchase—no surprises, just professional quality. The preview below is taken directly from the full Lazydays SWOT report you'll get, with strengths, weaknesses, opportunities and threats fully detailed. Purchase unlocks the editable, complete version for immediate download.











