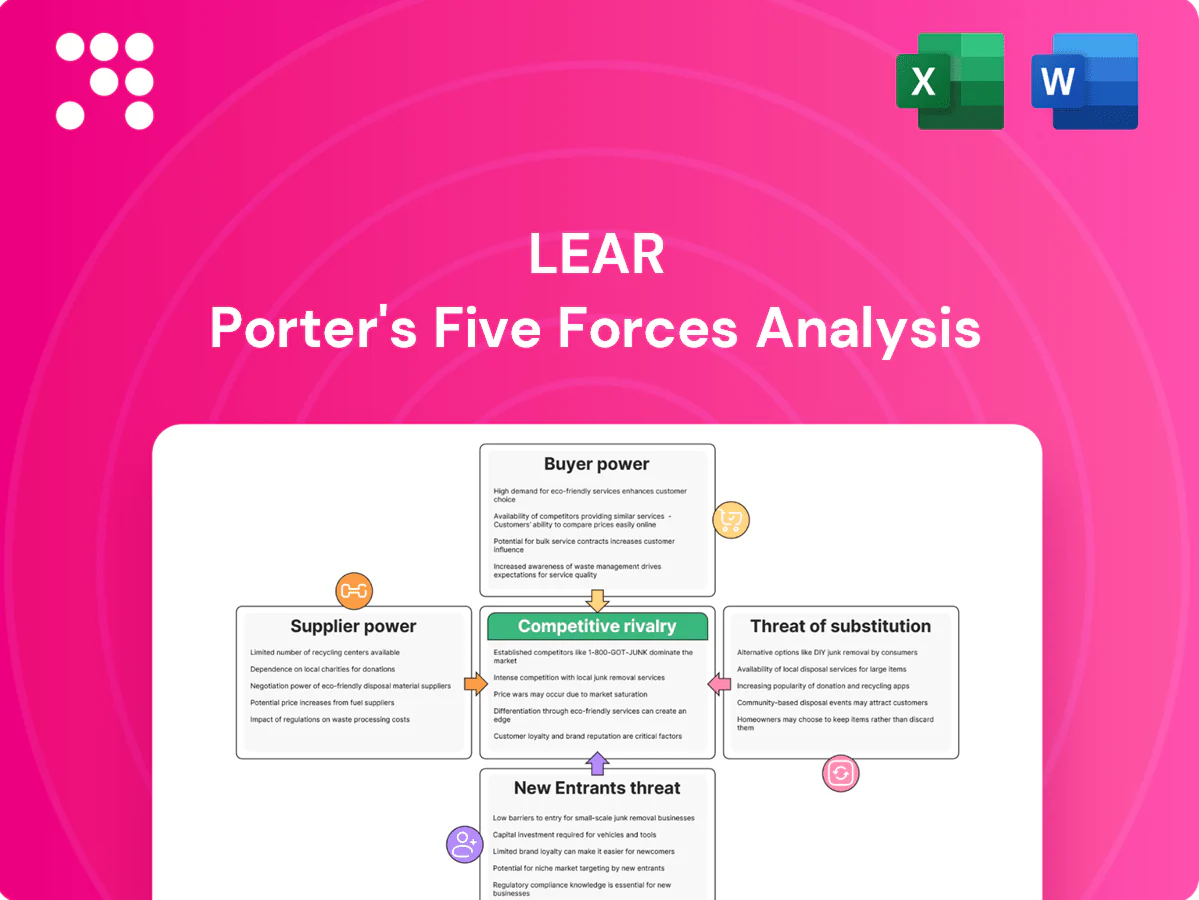
Lear Porter's Five Forces Analysis

Don't Miss the Bigger Picture
Lear faces mixed pressures: strong supplier negotiation on specialized components, moderate buyer power from automakers, and rising threats from EV-focused entrants and substitutes. This snapshot highlights key competitive dynamics and strategic risks. Unlock the full Porter's Five Forces Analysis for force-by-force ratings, visuals, and actionable insights to guide investment or strategy decisions.
Suppliers Bargaining Power

Critical raw materials concentration
Critical inputs—seat-foam chemicals, copper, resins and semiconductor content—come from a relatively concentrated supplier base, raising switching costs and price exposure; LME copper averaged about US$9,500/tonne in 2024 and semiconductor content exceeded roughly US$600 per vehicle that year. Specialty chemicals and connectors frequently have few qualified global vendors, concentrating bargaining power. Any disruption or allocation can compress margins and delay deliveries. Lear uses dual-sourcing and long-term agreements but cannot fully eliminate concentration risk.
Electronics and chip dependency
E-Systems depends on MCUs, power electronics and sensors that faced cyclical shortages and foundry concentration (TSMC ~53% wafer foundry share in 2024), letting suppliers tighten lead times and pricing; MCU lead times averaged ~16 weeks in 2024. Tier-2 chipmakers wield leverage via extended lead times and price premia, while 6–12 month qualification cycles impede rapid supplier changes. Strategic safety stock and design-for-substitution mitigate risk but raise inventory days by ~30–60 days, increasing working capital needs.

Tooling and bespoke components
Custom tooling for seating frames, mechanisms and wire-harness assemblies typically runs from $500k–$2M per program and PPAP/validation often adds $100k–$500k, creating significant amortization-led lock-in. Mid-program supplier switches commonly risk launch delays measured in months and incremental costs often in the $1M–$5M range. This gives select suppliers leverage to extract change-order premiums and engineering charges.

Logistics and regionalization
Near-shore build requirements and JIT delivery in 2024 increase Lear Porter's dependence on local logistics and sub-suppliers, concentrating leverage with regional carriers and first-tier vendors. Freight volatility and border constraints through 2024 have shifted negotiating power toward carriers and compliant regional suppliers, while OEM-mandated localization narrows supplier pools. Multi-region footprints lower disruption risk but raise coordination and cost complexity.
- Near-shore/JIT: raises local dependency
- Freight volatility 2024: shifts power to carriers
- OEM localization: reduces supplier options
- Multi-region: lowers risk, increases complexity
Sustainability and compliance demands
Sustainability, traceability and human-rights compliance shrink Lear Porter’s eligible supplier pool as REACH, RoHS and the EU Battery Regulation (2023/1542) raise qualification hurdles; certified ESG attributes often win contracts and price premiums. Non-compliant sources become unviable, concentrating demand and increasing remaining suppliers’ leverage.
- Traceability mandates limit suppliers
- REACH/RoHS/Battery rules raise entry cost
- ESG certification = premium/preference
- Fewer compliant suppliers = greater bargaining power
Supply squeeze: US$9,500/t, foundry ~53%
Supplier power is high: LME copper ~US$9,500/t (2024) and semiconductor content >US$600/vehicle raise cost exposure; TSMC ~53% foundry share and MCU lead times ~16 weeks (2024) concentrate leverage. Tooling costs US$0.5–2M per program create lock‑in; ESG/regulation shrink qualified pool.
| Metric | 2024 Value |
|---|---|
| Copper (LME) | US$9,500/t |
| Semiconductor content/vehicle | >US$600 |
| TSMC wafer share | ~53% |
| MCU lead times | ~16 weeks |
| Tooling cost/program | US$0.5–2M |
What is included in the product
 Detailed Word Document
Analyzes the five forces shaping Lear’s competitive landscape—supplier and buyer power, industry rivalry, threat of new entrants and substitutes—to assess pricing pressure, margin risk and strategic positioning. Identifies disruptive technologies and market dynamics that threaten or protect Lear; delivered in fully editable Word format for investor decks, business plans, or internal strategy use.

 Customizable Excel Spreadsheet
Lear Porter's Five Forces Analysis condenses competitive pressure into a single, customizable dashboard so teams quickly identify threats and opportunities; includes instant spider/radar visuals and clean layouts ready for decks or integration into broader reports.
Customers Bargaining Power

OEM consolidation and scale
Global automakers buy in very high volumes and remain concentrated, with the top 10 OEMs accounting for roughly 60% of global light-vehicle production in 2024, enabling tough pricing, penalties and annual cost-down targets commonly in the 3–5% range. Platform awards can be winner-take-most and often exceed $1 billion, forcing Lear to compete aggressively on price, quality and launch performance, which structurally elevates buyer power.
Design control and specification
OEMs dictate vehicle architectures, seat specs and electrical interfaces, limiting supplier differentiation; the global automotive seating market was valued at $38.5 billion in 2024, concentrating buying power with top OEMs. Early engineering involvement helps but OEMs retain sourcing gates and control engineering changes, often enforcing post-award value engineering. Cost transparency and open-book quoting in 2024 compressed supplier margins, frequently into low single digits.

Dual-sourcing and resourcing threats
OEMs regularly dual-source seats and harnesses, typically keeping two qualified suppliers to retain leverage; with global EV sales ~14.5 million in 2024 this drives faster program timelines. Performance lapses prompt mid-cycle re-sourcing to rivals, and many EV programs now use sourcing cycles under 18 months, increasing churn risk. Lear must maintain flawless quality and on-time delivery to avoid share loss.

Localization and price indexation
Buyers enforce local content, FX clauses, and commodity index pass-throughs that shift cost volatility to suppliers; indexation eases short-term swings but OEMs commonly cap recoveries and delay adjustments, squeezing working capital and margins. Regional content rules such as USMCA and EU origin requirements limit Lear’s footprint flexibility, so negotiation outcomes directly drive margin trajectory.
- Local content constraints reduce relocation optionality
- FX/commodity pass-throughs transfer price risk
- OEM caps/delays limit recovery speed
- Contract wins/losses materially affect margins
Aftermarket and software upsell limits
Lear reported 2024 sales of about $20.1 billion, with OEM B2B comprising the vast majority of revenue, leaving limited aftermarket leverage. Seat features and E-Systems software typically remain OEM-controlled, capping recurring revenue opportunities for Tier-1s. Increasing over-the-air feature delivery can let automakers bypass Tier-1 upsell, concentrating bargaining power with OEMs.
- OEM share ~majority of sales
- Recurring software/aftermarket <10% of revenue
- OTA can sidestep Tier-1 upsell
- Bargaining power concentrated with automakers
Top OEMs dominate seating: ~$38.5B market, >$1B platform bids, EVs ~14.5M spur sourcing churn
Global OEMs (top 10 ≈60% production) exert strong price/award leverage; Lear faces winner-take-most platform bids >$1B and 3–5% annual cost-downs. 2024 seat market ~$38.5B; Lear sales ~$20.1B with OEM B2B dominant, recurring software <10%, EVs 14.5M in 2024 accelerate sourcing churn.
| Metric | 2024 |
|---|---|
| Top 10 OEM share | ~60% |
| Lear sales | $20.1B |
| Seating market | $38.5B |
| Global EV sales | ~14.5M |
Preview Before You Purchase
Lear Porter's Five Forces Analysis
You're viewing Lear Porter’s Five Forces Analysis and this preview is the exact, fully formatted document you'll receive immediately after purchase. It contains the complete strategic assessment—no placeholders, no mockups. The file is ready for download and use the moment you buy, delivering the final, professionally prepared analysis for your decision-making needs.

Don't Miss the Bigger Picture
Lear faces mixed pressures: strong supplier negotiation on specialized components, moderate buyer power from automakers, and rising threats from EV-focused entrants and substitutes. This snapshot highlights key competitive dynamics and strategic risks. Unlock the full Porter's Five Forces Analysis for force-by-force ratings, visuals, and actionable insights to guide investment or strategy decisions.
Suppliers Bargaining Power
Critical raw materials concentration
Critical inputs—seat-foam chemicals, copper, resins and semiconductor content—come from a relatively concentrated supplier base, raising switching costs and price exposure; LME copper averaged about US$9,500/tonne in 2024 and semiconductor content exceeded roughly US$600 per vehicle that year. Specialty chemicals and connectors frequently have few qualified global vendors, concentrating bargaining power. Any disruption or allocation can compress margins and delay deliveries. Lear uses dual-sourcing and long-term agreements but cannot fully eliminate concentration risk.
Electronics and chip dependency
E-Systems depends on MCUs, power electronics and sensors that faced cyclical shortages and foundry concentration (TSMC ~53% wafer foundry share in 2024), letting suppliers tighten lead times and pricing; MCU lead times averaged ~16 weeks in 2024. Tier-2 chipmakers wield leverage via extended lead times and price premia, while 6–12 month qualification cycles impede rapid supplier changes. Strategic safety stock and design-for-substitution mitigate risk but raise inventory days by ~30–60 days, increasing working capital needs.
Tooling and bespoke components
Custom tooling for seating frames, mechanisms and wire-harness assemblies typically runs from $500k–$2M per program and PPAP/validation often adds $100k–$500k, creating significant amortization-led lock-in. Mid-program supplier switches commonly risk launch delays measured in months and incremental costs often in the $1M–$5M range. This gives select suppliers leverage to extract change-order premiums and engineering charges.
Logistics and regionalization
Near-shore build requirements and JIT delivery in 2024 increase Lear Porter's dependence on local logistics and sub-suppliers, concentrating leverage with regional carriers and first-tier vendors. Freight volatility and border constraints through 2024 have shifted negotiating power toward carriers and compliant regional suppliers, while OEM-mandated localization narrows supplier pools. Multi-region footprints lower disruption risk but raise coordination and cost complexity.
- Near-shore/JIT: raises local dependency
- Freight volatility 2024: shifts power to carriers
- OEM localization: reduces supplier options
- Multi-region: lowers risk, increases complexity
Sustainability and compliance demands
Sustainability, traceability and human-rights compliance shrink Lear Porter’s eligible supplier pool as REACH, RoHS and the EU Battery Regulation (2023/1542) raise qualification hurdles; certified ESG attributes often win contracts and price premiums. Non-compliant sources become unviable, concentrating demand and increasing remaining suppliers’ leverage.
- Traceability mandates limit suppliers
- REACH/RoHS/Battery rules raise entry cost
- ESG certification = premium/preference
- Fewer compliant suppliers = greater bargaining power
Supply squeeze: US$9,500/t, foundry ~53%
Supplier power is high: LME copper ~US$9,500/t (2024) and semiconductor content >US$600/vehicle raise cost exposure; TSMC ~53% foundry share and MCU lead times ~16 weeks (2024) concentrate leverage. Tooling costs US$0.5–2M per program create lock‑in; ESG/regulation shrink qualified pool.
| Metric | 2024 Value |
|---|---|
| Copper (LME) | US$9,500/t |
| Semiconductor content/vehicle | >US$600 |
| TSMC wafer share | ~53% |
| MCU lead times | ~16 weeks |
| Tooling cost/program | US$0.5–2M |
What is included in the product
Detailed Word Document
Analyzes the five forces shaping Lear’s competitive landscape—supplier and buyer power, industry rivalry, threat of new entrants and substitutes—to assess pricing pressure, margin risk and strategic positioning. Identifies disruptive technologies and market dynamics that threaten or protect Lear; delivered in fully editable Word format for investor decks, business plans, or internal strategy use.
Customizable Excel Spreadsheet
Lear Porter's Five Forces Analysis condenses competitive pressure into a single, customizable dashboard so teams quickly identify threats and opportunities; includes instant spider/radar visuals and clean layouts ready for decks or integration into broader reports.
Customers Bargaining Power
OEM consolidation and scale
Global automakers buy in very high volumes and remain concentrated, with the top 10 OEMs accounting for roughly 60% of global light-vehicle production in 2024, enabling tough pricing, penalties and annual cost-down targets commonly in the 3–5% range. Platform awards can be winner-take-most and often exceed $1 billion, forcing Lear to compete aggressively on price, quality and launch performance, which structurally elevates buyer power.
Design control and specification
OEMs dictate vehicle architectures, seat specs and electrical interfaces, limiting supplier differentiation; the global automotive seating market was valued at $38.5 billion in 2024, concentrating buying power with top OEMs. Early engineering involvement helps but OEMs retain sourcing gates and control engineering changes, often enforcing post-award value engineering. Cost transparency and open-book quoting in 2024 compressed supplier margins, frequently into low single digits.
Dual-sourcing and resourcing threats
OEMs regularly dual-source seats and harnesses, typically keeping two qualified suppliers to retain leverage; with global EV sales ~14.5 million in 2024 this drives faster program timelines. Performance lapses prompt mid-cycle re-sourcing to rivals, and many EV programs now use sourcing cycles under 18 months, increasing churn risk. Lear must maintain flawless quality and on-time delivery to avoid share loss.
Localization and price indexation
Buyers enforce local content, FX clauses, and commodity index pass-throughs that shift cost volatility to suppliers; indexation eases short-term swings but OEMs commonly cap recoveries and delay adjustments, squeezing working capital and margins. Regional content rules such as USMCA and EU origin requirements limit Lear’s footprint flexibility, so negotiation outcomes directly drive margin trajectory.
- Local content constraints reduce relocation optionality
- FX/commodity pass-throughs transfer price risk
- OEM caps/delays limit recovery speed
- Contract wins/losses materially affect margins
Aftermarket and software upsell limits
Lear reported 2024 sales of about $20.1 billion, with OEM B2B comprising the vast majority of revenue, leaving limited aftermarket leverage. Seat features and E-Systems software typically remain OEM-controlled, capping recurring revenue opportunities for Tier-1s. Increasing over-the-air feature delivery can let automakers bypass Tier-1 upsell, concentrating bargaining power with OEMs.
- OEM share ~majority of sales
- Recurring software/aftermarket <10% of revenue
- OTA can sidestep Tier-1 upsell
- Bargaining power concentrated with automakers
Top OEMs dominate seating: ~$38.5B market, >$1B platform bids, EVs ~14.5M spur sourcing churn
Global OEMs (top 10 ≈60% production) exert strong price/award leverage; Lear faces winner-take-most platform bids >$1B and 3–5% annual cost-downs. 2024 seat market ~$38.5B; Lear sales ~$20.1B with OEM B2B dominant, recurring software <10%, EVs 14.5M in 2024 accelerate sourcing churn.
| Metric | 2024 |
|---|---|
| Top 10 OEM share | ~60% |
| Lear sales | $20.1B |
| Seating market | $38.5B |
| Global EV sales | ~14.5M |
Preview Before You Purchase
Lear Porter's Five Forces Analysis
You're viewing Lear Porter’s Five Forces Analysis and this preview is the exact, fully formatted document you'll receive immediately after purchase. It contains the complete strategic assessment—no placeholders, no mockups. The file is ready for download and use the moment you buy, delivering the final, professionally prepared analysis for your decision-making needs.
Description
Don't Miss the Bigger Picture
Lear faces mixed pressures: strong supplier negotiation on specialized components, moderate buyer power from automakers, and rising threats from EV-focused entrants and substitutes. This snapshot highlights key competitive dynamics and strategic risks. Unlock the full Porter's Five Forces Analysis for force-by-force ratings, visuals, and actionable insights to guide investment or strategy decisions.
Suppliers Bargaining Power
Critical raw materials concentration
Critical inputs—seat-foam chemicals, copper, resins and semiconductor content—come from a relatively concentrated supplier base, raising switching costs and price exposure; LME copper averaged about US$9,500/tonne in 2024 and semiconductor content exceeded roughly US$600 per vehicle that year. Specialty chemicals and connectors frequently have few qualified global vendors, concentrating bargaining power. Any disruption or allocation can compress margins and delay deliveries. Lear uses dual-sourcing and long-term agreements but cannot fully eliminate concentration risk.
Electronics and chip dependency
E-Systems depends on MCUs, power electronics and sensors that faced cyclical shortages and foundry concentration (TSMC ~53% wafer foundry share in 2024), letting suppliers tighten lead times and pricing; MCU lead times averaged ~16 weeks in 2024. Tier-2 chipmakers wield leverage via extended lead times and price premia, while 6–12 month qualification cycles impede rapid supplier changes. Strategic safety stock and design-for-substitution mitigate risk but raise inventory days by ~30–60 days, increasing working capital needs.
Tooling and bespoke components
Custom tooling for seating frames, mechanisms and wire-harness assemblies typically runs from $500k–$2M per program and PPAP/validation often adds $100k–$500k, creating significant amortization-led lock-in. Mid-program supplier switches commonly risk launch delays measured in months and incremental costs often in the $1M–$5M range. This gives select suppliers leverage to extract change-order premiums and engineering charges.
Logistics and regionalization
Near-shore build requirements and JIT delivery in 2024 increase Lear Porter's dependence on local logistics and sub-suppliers, concentrating leverage with regional carriers and first-tier vendors. Freight volatility and border constraints through 2024 have shifted negotiating power toward carriers and compliant regional suppliers, while OEM-mandated localization narrows supplier pools. Multi-region footprints lower disruption risk but raise coordination and cost complexity.
- Near-shore/JIT: raises local dependency
- Freight volatility 2024: shifts power to carriers
- OEM localization: reduces supplier options
- Multi-region: lowers risk, increases complexity
Sustainability and compliance demands
Sustainability, traceability and human-rights compliance shrink Lear Porter’s eligible supplier pool as REACH, RoHS and the EU Battery Regulation (2023/1542) raise qualification hurdles; certified ESG attributes often win contracts and price premiums. Non-compliant sources become unviable, concentrating demand and increasing remaining suppliers’ leverage.
- Traceability mandates limit suppliers
- REACH/RoHS/Battery rules raise entry cost
- ESG certification = premium/preference
- Fewer compliant suppliers = greater bargaining power
Supply squeeze: US$9,500/t, foundry ~53%
Supplier power is high: LME copper ~US$9,500/t (2024) and semiconductor content >US$600/vehicle raise cost exposure; TSMC ~53% foundry share and MCU lead times ~16 weeks (2024) concentrate leverage. Tooling costs US$0.5–2M per program create lock‑in; ESG/regulation shrink qualified pool.
| Metric | 2024 Value |
|---|---|
| Copper (LME) | US$9,500/t |
| Semiconductor content/vehicle | >US$600 |
| TSMC wafer share | ~53% |
| MCU lead times | ~16 weeks |
| Tooling cost/program | US$0.5–2M |
What is included in the product
Detailed Word Document
Analyzes the five forces shaping Lear’s competitive landscape—supplier and buyer power, industry rivalry, threat of new entrants and substitutes—to assess pricing pressure, margin risk and strategic positioning. Identifies disruptive technologies and market dynamics that threaten or protect Lear; delivered in fully editable Word format for investor decks, business plans, or internal strategy use.
Customizable Excel Spreadsheet
Lear Porter's Five Forces Analysis condenses competitive pressure into a single, customizable dashboard so teams quickly identify threats and opportunities; includes instant spider/radar visuals and clean layouts ready for decks or integration into broader reports.
Customers Bargaining Power
OEM consolidation and scale
Global automakers buy in very high volumes and remain concentrated, with the top 10 OEMs accounting for roughly 60% of global light-vehicle production in 2024, enabling tough pricing, penalties and annual cost-down targets commonly in the 3–5% range. Platform awards can be winner-take-most and often exceed $1 billion, forcing Lear to compete aggressively on price, quality and launch performance, which structurally elevates buyer power.
Design control and specification
OEMs dictate vehicle architectures, seat specs and electrical interfaces, limiting supplier differentiation; the global automotive seating market was valued at $38.5 billion in 2024, concentrating buying power with top OEMs. Early engineering involvement helps but OEMs retain sourcing gates and control engineering changes, often enforcing post-award value engineering. Cost transparency and open-book quoting in 2024 compressed supplier margins, frequently into low single digits.
Dual-sourcing and resourcing threats
OEMs regularly dual-source seats and harnesses, typically keeping two qualified suppliers to retain leverage; with global EV sales ~14.5 million in 2024 this drives faster program timelines. Performance lapses prompt mid-cycle re-sourcing to rivals, and many EV programs now use sourcing cycles under 18 months, increasing churn risk. Lear must maintain flawless quality and on-time delivery to avoid share loss.
Localization and price indexation
Buyers enforce local content, FX clauses, and commodity index pass-throughs that shift cost volatility to suppliers; indexation eases short-term swings but OEMs commonly cap recoveries and delay adjustments, squeezing working capital and margins. Regional content rules such as USMCA and EU origin requirements limit Lear’s footprint flexibility, so negotiation outcomes directly drive margin trajectory.
- Local content constraints reduce relocation optionality
- FX/commodity pass-throughs transfer price risk
- OEM caps/delays limit recovery speed
- Contract wins/losses materially affect margins
Aftermarket and software upsell limits
Lear reported 2024 sales of about $20.1 billion, with OEM B2B comprising the vast majority of revenue, leaving limited aftermarket leverage. Seat features and E-Systems software typically remain OEM-controlled, capping recurring revenue opportunities for Tier-1s. Increasing over-the-air feature delivery can let automakers bypass Tier-1 upsell, concentrating bargaining power with OEMs.
- OEM share ~majority of sales
- Recurring software/aftermarket <10% of revenue
- OTA can sidestep Tier-1 upsell
- Bargaining power concentrated with automakers
Top OEMs dominate seating: ~$38.5B market, >$1B platform bids, EVs ~14.5M spur sourcing churn
Global OEMs (top 10 ≈60% production) exert strong price/award leverage; Lear faces winner-take-most platform bids >$1B and 3–5% annual cost-downs. 2024 seat market ~$38.5B; Lear sales ~$20.1B with OEM B2B dominant, recurring software <10%, EVs 14.5M in 2024 accelerate sourcing churn.
| Metric | 2024 |
|---|---|
| Top 10 OEM share | ~60% |
| Lear sales | $20.1B |
| Seating market | $38.5B |
| Global EV sales | ~14.5M |
Preview Before You Purchase
Lear Porter's Five Forces Analysis
You're viewing Lear Porter’s Five Forces Analysis and this preview is the exact, fully formatted document you'll receive immediately after purchase. It contains the complete strategic assessment—no placeholders, no mockups. The file is ready for download and use the moment you buy, delivering the final, professionally prepared analysis for your decision-making needs.











