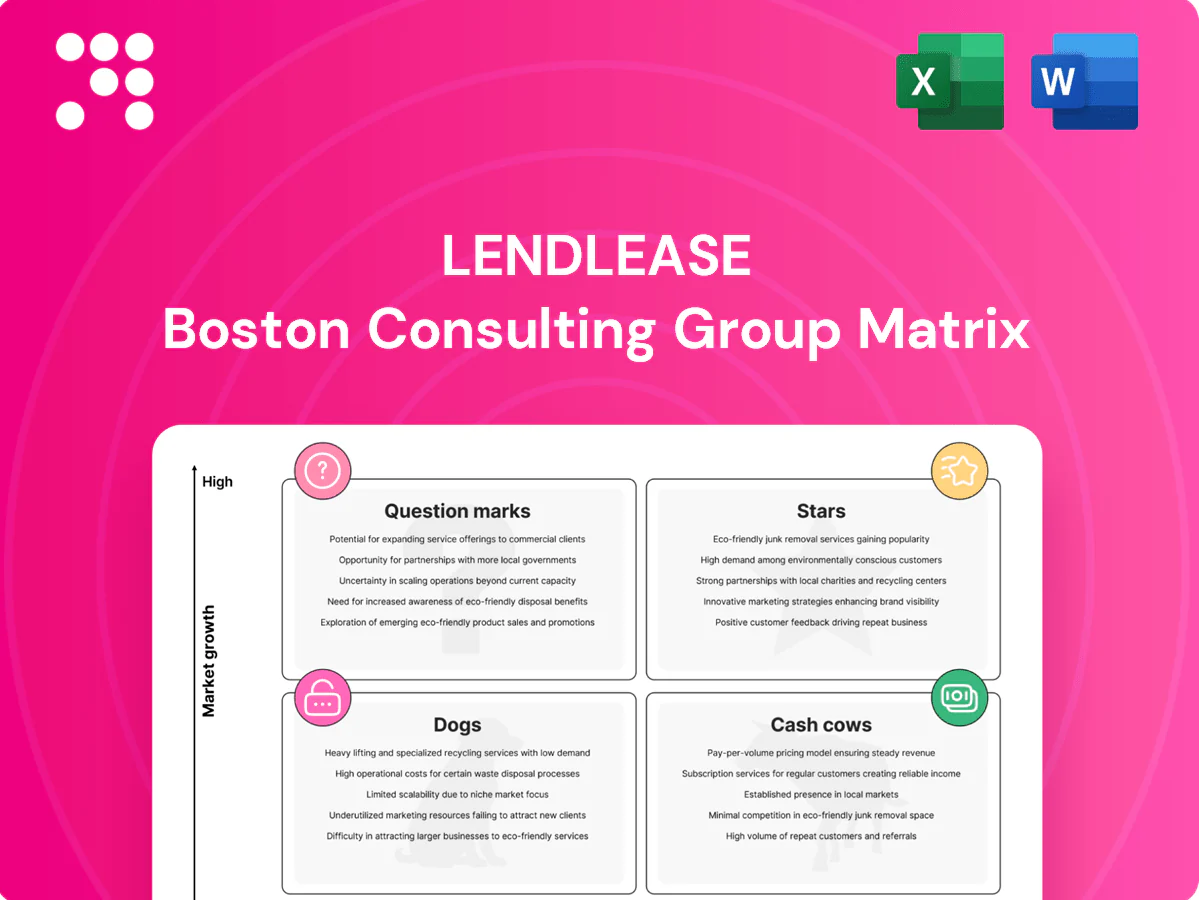
LendLease Boston Consulting Group Matrix

Unlock Strategic Clarity
Curious where LendLease’s assets sit—Stars, Cash Cows, Dogs or Question Marks? Our LendLease BCG Matrix preview hints at the shifts, but the full report lays out quadrant-by-quadrant placements, data-backed recommendations, and a clear playbook to reallocate capital and boost returns. Buy the complete BCG Matrix to get a polished Word report plus an editable Excel summary—ready to present and act on today.
Stars

Urban regeneration flagships
Large mixed-use precincts in tier-1 cities sit in fast-growing demand pockets—examples include Barangaroo (circa A$6 billion) and Elephant & Castle (circa £1.5 billion), where Lendlease holds strong positions and brand permission, so market share is high. These schemes often soak cash for 5–15 years but momentum, superior placemaking and scale can flip them into future Cash Cows. Keep fueling marketing, strategic partnerships and delivery speed to shorten payback and maximise NOI growth.
Integrated dev + construction engine
Owning the full stack lets Lendlease win complex work and control outcomes in high‑growth urban cores, aligning with a 2024 global urbanization level of roughly 57% that keeps demand concentrated in cities.
Scale plus reputation drives leadership share in major mixed‑use and regeneration projects, especially across Australia, UK and US markets where integrated delivery premiums persist.
It is capital‑hungry and coordination‑heavy, so cash in ≈ cash out for extended phases; continual investment is required to protect the edge and compound wins.

Sustainability leadership offerings
Net-zero precincts and green construction are accelerating as buildings and construction accounted for about 37% of global energy-related CO2 emissions by 2024, driving strong client demand. Lendlease’s track record positions it as the leader’s share candidate and it is frequently first‑shortlisted on major precinct and net‑zero bids. Premium pricing exists but higher delivery costs and upfront capital intensity are cash‑consuming today. Strategy: double down investment while market adoption and contract pipelines expand.

Tier‑1 city mixed‑use pipelines
Tier‑1 city mixed‑use pipeline remains resilient as prime locations continue to absorb product across cycles; growth stayed solid with Lendlease reporting a development pipeline of about A$14bn in 2024, giving scale rivals struggle to match. Pre‑leasing, placemaking and curated tenancy raise up‑front costs, so continued investment is required to lock in long‑term cash flows.
- Prime absorption: sustained
- Pipeline 2024: ~A$14bn
- Upfront costs: high (pre‑lease, placemaking)
- Strategy: keep investing to secure cash flows
Institutional capital partnerships
Global institutional capital increasingly targets scaled ESG-aligned real assets, with demand rising in 2024 as pension and sovereign funds shift allocation toward real estate and infrastructure; Lendlease’s A$62bn funds under management and track record secure a leader’s seat in club deals and pooled vehicles. Set-up and seeding require cash upfront, but nurturing these programs converts them into durable, fee-rich platforms.
- scale-driven ESG demand
- leader in club deals
- upfront seeding costs
- convert to fee-rich platforms
Tier‑1 mixed‑use: long runway (5–15y), A$14bn pipeline, A$62bn FUM, net‑zero tailwinds
Tier‑1 mixed‑use precincts (eg Barangaroo ~A$6bn, Elephant & Castle ~£1.5bn) sit in fast‑growing urban demand pockets and hold high market share; long cash burn (5–15y) but can become Cash Cows with placemaking and speed. Lendlease reported ~A$14bn development pipeline and A$62bn FUM in 2024; buildings/construction ~37% of CO2 emissions drives net‑zero demand. Strategy: continue capital deployment to shorten payback and capture premium NOI.
| Metric | 2024 | Note |
|---|---|---|
| Key projects | Barangaroo A$6bn; Elephant & Castle £1.5bn | High share |
| Pipeline | A$14bn | Development scale |
| FUM | A$62bn | Funds/platforms |
| Sector CO2 | ≈37% | drives net‑zero demand |
What is included in the product
 Detailed Word Document
BCG Matrix for LendLease: maps units into Stars, Cash Cows, Question Marks, Dogs and gives clear invest, hold or divest guidance.

 Customizable Excel Spreadsheet
One-page LendLease BCG matrix to pinpoint weak units and speed strategic reallocations for clear, quick decisions.
Cash Cows

Stabilized income assets
Completed, leased buildings in mature submarkets generated stable cash in 2024, with portfolio occupancy above 90% driving predictable NOI; growth is low but operational margins remain healthy through active asset management. Maintenance capex is mostly routine and forecastable, promotional leasing costs minimal, allowing managers to milk fees and NOI while pursuing modest efficiency gains.
Established masterplanned communities
Later‑phase land and housing releases in proven estates deliver repeatable margins, with Lendlease in 2024 continuing to prioritise settlements across its masterplanned communities to lock in cashflow. Market growth tapers but Lendlease retains high share by brand recognition and scale, reducing sales and marketing intensity. With lighter promotional spend, the strategy is to harvest cash and fine‑tune infrastructure spend to smooth resident churn.

Repeat‑client construction programs
Framework repeat-client construction programs with blue-chip clients in stable sectors provide predictable volume and contract certainty; in 2024 Lendlease continued to leverage long-term frameworks across public infrastructure and health sectors. Market growth is flat in 2024, but Lendlease retains a meaningful share via secured frameworks and renewal pipeline. Working capital needs are established and risks are contract-priced; management must maintain discipline and prioritise margin over volume.

Asset & funds management fees
Existing Lendlease asset & funds management vehicles delivered recurring base and performance fees in FY24, supported by AUM of about AUD 62bn and fee revenue near AUD 570m, giving a stable cash-cow profile with modest growth.
Low incremental cost to serve and strong placement within core clients mean protecting relationships and tightening cost-to-serve will maximize free cash generation; let the cash drop to fund growth or pay down balance sheet.
- FY24 AUM ~ AUD 62bn
- FY24 fee revenue ~ AUD 570m
- Low incremental cost; high margin
- Priorities: protect relationships, tighten costs, harvest cash
Long‑term ops/PPP services
Operating contracts on delivered assets deliver steady, contract-backed service income, making long-term ops/PPP a classic cash cow for LendLease; market expansion is slow and share is entrenched by multi-year contracts, so growth is incremental. Limited promotion is required—focus is on delivery quality, operational KPIs and renewing contracts. Continuous process optimization and scale efficiencies widen margins.
- Revenue stability: contract-backed service fees
- Marketing low: retention over acquisition
- Margin levers: process improvements, scale
Cash harvesting: >90% occ, AUM AUD 62bn, fees AUD 570m
In FY24 Lendlease cash cows—completed leased buildings, later‑phase housing, framework construction and asset/fund management—generated stable, high‑margin cashflow with portfolio occupancy >90%, AUM ~AUD 62bn and fee revenue ~AUD 570m. Growth is low; focus is harvesting cash, tight cost‑to‑serve and contract renewals to maximize free cash and pay down balance sheet.
| Metric | FY24 |
|---|---|
| Occupancy | >90% |
| AUM | AUD 62bn |
| Fee revenue | AUD 570m |
Full Transparency, Always
LendLease BCG Matrix
The LendLease BCG Matrix you're previewing is the exact file you'll receive after purchase. No watermarks, no demo labels—just a fully formatted, analysis-ready report tailored to LendLease's portfolio. Once bought, the final document is immediately downloadable and editable for presentations or strategic planning. It's the same professional deliverable our team prepared—no surprises, just clarity.

Unlock Strategic Clarity
Curious where LendLease’s assets sit—Stars, Cash Cows, Dogs or Question Marks? Our LendLease BCG Matrix preview hints at the shifts, but the full report lays out quadrant-by-quadrant placements, data-backed recommendations, and a clear playbook to reallocate capital and boost returns. Buy the complete BCG Matrix to get a polished Word report plus an editable Excel summary—ready to present and act on today.
Stars
Urban regeneration flagships
Large mixed-use precincts in tier-1 cities sit in fast-growing demand pockets—examples include Barangaroo (circa A$6 billion) and Elephant & Castle (circa £1.5 billion), where Lendlease holds strong positions and brand permission, so market share is high. These schemes often soak cash for 5–15 years but momentum, superior placemaking and scale can flip them into future Cash Cows. Keep fueling marketing, strategic partnerships and delivery speed to shorten payback and maximise NOI growth.
Integrated dev + construction engine
Owning the full stack lets Lendlease win complex work and control outcomes in high‑growth urban cores, aligning with a 2024 global urbanization level of roughly 57% that keeps demand concentrated in cities.
Scale plus reputation drives leadership share in major mixed‑use and regeneration projects, especially across Australia, UK and US markets where integrated delivery premiums persist.
It is capital‑hungry and coordination‑heavy, so cash in ≈ cash out for extended phases; continual investment is required to protect the edge and compound wins.
Sustainability leadership offerings
Net-zero precincts and green construction are accelerating as buildings and construction accounted for about 37% of global energy-related CO2 emissions by 2024, driving strong client demand. Lendlease’s track record positions it as the leader’s share candidate and it is frequently first‑shortlisted on major precinct and net‑zero bids. Premium pricing exists but higher delivery costs and upfront capital intensity are cash‑consuming today. Strategy: double down investment while market adoption and contract pipelines expand.
Tier‑1 city mixed‑use pipelines
Tier‑1 city mixed‑use pipeline remains resilient as prime locations continue to absorb product across cycles; growth stayed solid with Lendlease reporting a development pipeline of about A$14bn in 2024, giving scale rivals struggle to match. Pre‑leasing, placemaking and curated tenancy raise up‑front costs, so continued investment is required to lock in long‑term cash flows.
- Prime absorption: sustained
- Pipeline 2024: ~A$14bn
- Upfront costs: high (pre‑lease, placemaking)
- Strategy: keep investing to secure cash flows
Institutional capital partnerships
Global institutional capital increasingly targets scaled ESG-aligned real assets, with demand rising in 2024 as pension and sovereign funds shift allocation toward real estate and infrastructure; Lendlease’s A$62bn funds under management and track record secure a leader’s seat in club deals and pooled vehicles. Set-up and seeding require cash upfront, but nurturing these programs converts them into durable, fee-rich platforms.
- scale-driven ESG demand
- leader in club deals
- upfront seeding costs
- convert to fee-rich platforms
Tier‑1 mixed‑use: long runway (5–15y), A$14bn pipeline, A$62bn FUM, net‑zero tailwinds
Tier‑1 mixed‑use precincts (eg Barangaroo ~A$6bn, Elephant & Castle ~£1.5bn) sit in fast‑growing urban demand pockets and hold high market share; long cash burn (5–15y) but can become Cash Cows with placemaking and speed. Lendlease reported ~A$14bn development pipeline and A$62bn FUM in 2024; buildings/construction ~37% of CO2 emissions drives net‑zero demand. Strategy: continue capital deployment to shorten payback and capture premium NOI.
| Metric | 2024 | Note |
|---|---|---|
| Key projects | Barangaroo A$6bn; Elephant & Castle £1.5bn | High share |
| Pipeline | A$14bn | Development scale |
| FUM | A$62bn | Funds/platforms |
| Sector CO2 | ≈37% | drives net‑zero demand |
What is included in the product
Detailed Word Document
BCG Matrix for LendLease: maps units into Stars, Cash Cows, Question Marks, Dogs and gives clear invest, hold or divest guidance.
Customizable Excel Spreadsheet
One-page LendLease BCG matrix to pinpoint weak units and speed strategic reallocations for clear, quick decisions.
Cash Cows
Stabilized income assets
Completed, leased buildings in mature submarkets generated stable cash in 2024, with portfolio occupancy above 90% driving predictable NOI; growth is low but operational margins remain healthy through active asset management. Maintenance capex is mostly routine and forecastable, promotional leasing costs minimal, allowing managers to milk fees and NOI while pursuing modest efficiency gains.
Established masterplanned communities
Later‑phase land and housing releases in proven estates deliver repeatable margins, with Lendlease in 2024 continuing to prioritise settlements across its masterplanned communities to lock in cashflow. Market growth tapers but Lendlease retains high share by brand recognition and scale, reducing sales and marketing intensity. With lighter promotional spend, the strategy is to harvest cash and fine‑tune infrastructure spend to smooth resident churn.
Repeat‑client construction programs
Framework repeat-client construction programs with blue-chip clients in stable sectors provide predictable volume and contract certainty; in 2024 Lendlease continued to leverage long-term frameworks across public infrastructure and health sectors. Market growth is flat in 2024, but Lendlease retains a meaningful share via secured frameworks and renewal pipeline. Working capital needs are established and risks are contract-priced; management must maintain discipline and prioritise margin over volume.
Asset & funds management fees
Existing Lendlease asset & funds management vehicles delivered recurring base and performance fees in FY24, supported by AUM of about AUD 62bn and fee revenue near AUD 570m, giving a stable cash-cow profile with modest growth.
Low incremental cost to serve and strong placement within core clients mean protecting relationships and tightening cost-to-serve will maximize free cash generation; let the cash drop to fund growth or pay down balance sheet.
- FY24 AUM ~ AUD 62bn
- FY24 fee revenue ~ AUD 570m
- Low incremental cost; high margin
- Priorities: protect relationships, tighten costs, harvest cash
Long‑term ops/PPP services
Operating contracts on delivered assets deliver steady, contract-backed service income, making long-term ops/PPP a classic cash cow for LendLease; market expansion is slow and share is entrenched by multi-year contracts, so growth is incremental. Limited promotion is required—focus is on delivery quality, operational KPIs and renewing contracts. Continuous process optimization and scale efficiencies widen margins.
- Revenue stability: contract-backed service fees
- Marketing low: retention over acquisition
- Margin levers: process improvements, scale
Cash harvesting: >90% occ, AUM AUD 62bn, fees AUD 570m
In FY24 Lendlease cash cows—completed leased buildings, later‑phase housing, framework construction and asset/fund management—generated stable, high‑margin cashflow with portfolio occupancy >90%, AUM ~AUD 62bn and fee revenue ~AUD 570m. Growth is low; focus is harvesting cash, tight cost‑to‑serve and contract renewals to maximize free cash and pay down balance sheet.
| Metric | FY24 |
|---|---|
| Occupancy | >90% |
| AUM | AUD 62bn |
| Fee revenue | AUD 570m |
Full Transparency, Always
LendLease BCG Matrix
The LendLease BCG Matrix you're previewing is the exact file you'll receive after purchase. No watermarks, no demo labels—just a fully formatted, analysis-ready report tailored to LendLease's portfolio. Once bought, the final document is immediately downloadable and editable for presentations or strategic planning. It's the same professional deliverable our team prepared—no surprises, just clarity.
Original: $10.00
-65%$10.00
$3.50Description
Unlock Strategic Clarity
Curious where LendLease’s assets sit—Stars, Cash Cows, Dogs or Question Marks? Our LendLease BCG Matrix preview hints at the shifts, but the full report lays out quadrant-by-quadrant placements, data-backed recommendations, and a clear playbook to reallocate capital and boost returns. Buy the complete BCG Matrix to get a polished Word report plus an editable Excel summary—ready to present and act on today.
Stars
Urban regeneration flagships
Large mixed-use precincts in tier-1 cities sit in fast-growing demand pockets—examples include Barangaroo (circa A$6 billion) and Elephant & Castle (circa £1.5 billion), where Lendlease holds strong positions and brand permission, so market share is high. These schemes often soak cash for 5–15 years but momentum, superior placemaking and scale can flip them into future Cash Cows. Keep fueling marketing, strategic partnerships and delivery speed to shorten payback and maximise NOI growth.
Integrated dev + construction engine
Owning the full stack lets Lendlease win complex work and control outcomes in high‑growth urban cores, aligning with a 2024 global urbanization level of roughly 57% that keeps demand concentrated in cities.
Scale plus reputation drives leadership share in major mixed‑use and regeneration projects, especially across Australia, UK and US markets where integrated delivery premiums persist.
It is capital‑hungry and coordination‑heavy, so cash in ≈ cash out for extended phases; continual investment is required to protect the edge and compound wins.
Sustainability leadership offerings
Net-zero precincts and green construction are accelerating as buildings and construction accounted for about 37% of global energy-related CO2 emissions by 2024, driving strong client demand. Lendlease’s track record positions it as the leader’s share candidate and it is frequently first‑shortlisted on major precinct and net‑zero bids. Premium pricing exists but higher delivery costs and upfront capital intensity are cash‑consuming today. Strategy: double down investment while market adoption and contract pipelines expand.
Tier‑1 city mixed‑use pipelines
Tier‑1 city mixed‑use pipeline remains resilient as prime locations continue to absorb product across cycles; growth stayed solid with Lendlease reporting a development pipeline of about A$14bn in 2024, giving scale rivals struggle to match. Pre‑leasing, placemaking and curated tenancy raise up‑front costs, so continued investment is required to lock in long‑term cash flows.
- Prime absorption: sustained
- Pipeline 2024: ~A$14bn
- Upfront costs: high (pre‑lease, placemaking)
- Strategy: keep investing to secure cash flows
Institutional capital partnerships
Global institutional capital increasingly targets scaled ESG-aligned real assets, with demand rising in 2024 as pension and sovereign funds shift allocation toward real estate and infrastructure; Lendlease’s A$62bn funds under management and track record secure a leader’s seat in club deals and pooled vehicles. Set-up and seeding require cash upfront, but nurturing these programs converts them into durable, fee-rich platforms.
- scale-driven ESG demand
- leader in club deals
- upfront seeding costs
- convert to fee-rich platforms
Tier‑1 mixed‑use: long runway (5–15y), A$14bn pipeline, A$62bn FUM, net‑zero tailwinds
Tier‑1 mixed‑use precincts (eg Barangaroo ~A$6bn, Elephant & Castle ~£1.5bn) sit in fast‑growing urban demand pockets and hold high market share; long cash burn (5–15y) but can become Cash Cows with placemaking and speed. Lendlease reported ~A$14bn development pipeline and A$62bn FUM in 2024; buildings/construction ~37% of CO2 emissions drives net‑zero demand. Strategy: continue capital deployment to shorten payback and capture premium NOI.
| Metric | 2024 | Note |
|---|---|---|
| Key projects | Barangaroo A$6bn; Elephant & Castle £1.5bn | High share |
| Pipeline | A$14bn | Development scale |
| FUM | A$62bn | Funds/platforms |
| Sector CO2 | ≈37% | drives net‑zero demand |
What is included in the product
Detailed Word Document
BCG Matrix for LendLease: maps units into Stars, Cash Cows, Question Marks, Dogs and gives clear invest, hold or divest guidance.
Customizable Excel Spreadsheet
One-page LendLease BCG matrix to pinpoint weak units and speed strategic reallocations for clear, quick decisions.
Cash Cows
Stabilized income assets
Completed, leased buildings in mature submarkets generated stable cash in 2024, with portfolio occupancy above 90% driving predictable NOI; growth is low but operational margins remain healthy through active asset management. Maintenance capex is mostly routine and forecastable, promotional leasing costs minimal, allowing managers to milk fees and NOI while pursuing modest efficiency gains.
Established masterplanned communities
Later‑phase land and housing releases in proven estates deliver repeatable margins, with Lendlease in 2024 continuing to prioritise settlements across its masterplanned communities to lock in cashflow. Market growth tapers but Lendlease retains high share by brand recognition and scale, reducing sales and marketing intensity. With lighter promotional spend, the strategy is to harvest cash and fine‑tune infrastructure spend to smooth resident churn.
Repeat‑client construction programs
Framework repeat-client construction programs with blue-chip clients in stable sectors provide predictable volume and contract certainty; in 2024 Lendlease continued to leverage long-term frameworks across public infrastructure and health sectors. Market growth is flat in 2024, but Lendlease retains a meaningful share via secured frameworks and renewal pipeline. Working capital needs are established and risks are contract-priced; management must maintain discipline and prioritise margin over volume.
Asset & funds management fees
Existing Lendlease asset & funds management vehicles delivered recurring base and performance fees in FY24, supported by AUM of about AUD 62bn and fee revenue near AUD 570m, giving a stable cash-cow profile with modest growth.
Low incremental cost to serve and strong placement within core clients mean protecting relationships and tightening cost-to-serve will maximize free cash generation; let the cash drop to fund growth or pay down balance sheet.
- FY24 AUM ~ AUD 62bn
- FY24 fee revenue ~ AUD 570m
- Low incremental cost; high margin
- Priorities: protect relationships, tighten costs, harvest cash
Long‑term ops/PPP services
Operating contracts on delivered assets deliver steady, contract-backed service income, making long-term ops/PPP a classic cash cow for LendLease; market expansion is slow and share is entrenched by multi-year contracts, so growth is incremental. Limited promotion is required—focus is on delivery quality, operational KPIs and renewing contracts. Continuous process optimization and scale efficiencies widen margins.
- Revenue stability: contract-backed service fees
- Marketing low: retention over acquisition
- Margin levers: process improvements, scale
Cash harvesting: >90% occ, AUM AUD 62bn, fees AUD 570m
In FY24 Lendlease cash cows—completed leased buildings, later‑phase housing, framework construction and asset/fund management—generated stable, high‑margin cashflow with portfolio occupancy >90%, AUM ~AUD 62bn and fee revenue ~AUD 570m. Growth is low; focus is harvesting cash, tight cost‑to‑serve and contract renewals to maximize free cash and pay down balance sheet.
| Metric | FY24 |
|---|---|
| Occupancy | >90% |
| AUM | AUD 62bn |
| Fee revenue | AUD 570m |
Full Transparency, Always
LendLease BCG Matrix
The LendLease BCG Matrix you're previewing is the exact file you'll receive after purchase. No watermarks, no demo labels—just a fully formatted, analysis-ready report tailored to LendLease's portfolio. Once bought, the final document is immediately downloadable and editable for presentations or strategic planning. It's the same professional deliverable our team prepared—no surprises, just clarity.











