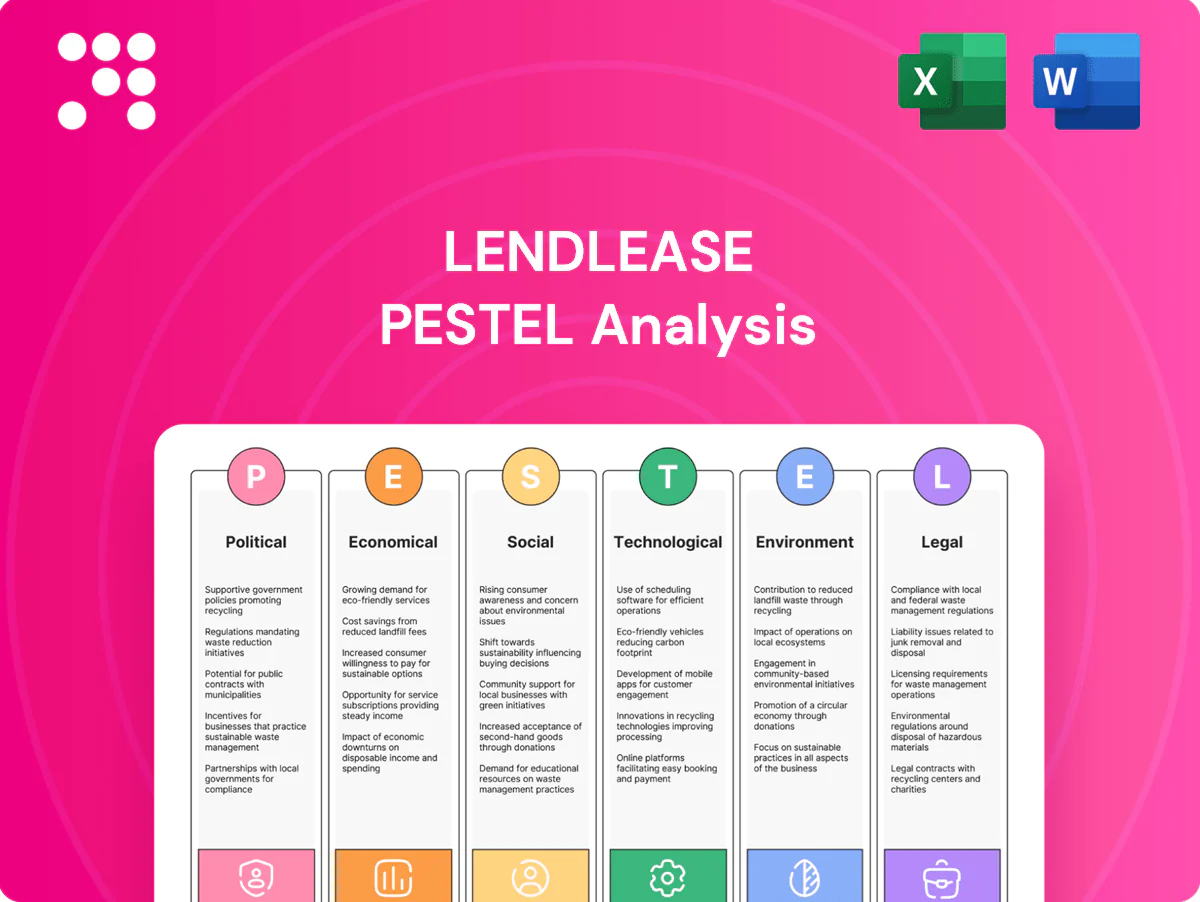
LendLease PESTLE Analysis

Your Shortcut to Market Insight Starts Here
Unlock strategic clarity with our PESTLE Analysis of LendLease—mapping political, economic, social, technological, legal, and environmental forces that will shape its next moves. Ideal for investors, advisors, and executives, this concise briefing highlights risks and growth levers you can act on today. Purchase the full, editable report for the complete, actionable intelligence.
Political factors

Public–private partnership dynamics
Lendlease frequently partners with governments on regeneration and infrastructure, exposing its pipeline to shifting public priorities; at June 2024 its development pipeline exceeded A$20 billion, heightening sensitivity to policy change. Changes in leadership or funding can alter project scope, timelines and margins. Stable relationships and transparent governance are critical for pipeline visibility, and diversifying counterparties and geographies reduces concentration risk.
Urban planning and approvals
Planning approvals for Lendlease projects are often lengthy and politicized, commonly adding 6–18 months to delivery and increasing cost of capital; delays affected several Australian precincts in 2023–24. Policy swings on density, heritage and transport can alter developable GFA by as much as 20–30%, unlocking or stalling precinct revenue. Early stakeholder engagement and consent de‑risking cut approval overruns materially, while scenario planning for conditions and appeals preserves delivery certainty.

Infrastructure and housing policy
Government stimulus for transport, social housing and climate adaptation can catalyse demand—Infrastructure Australia lists a priority pipeline exceeding A$100bn (2024) and the UK Affordable Homes Programme is funded at £11.5bn (2021–26). Conversely, austerity or reallocation can compress the opportunity set and shorten delivery windows. Aligning bids to affordability, resilience and local job outcomes improves win rates. Monitoring budget cycles and spending reviews sharpens bid timing and resource allocation.

Geopolitics and trade exposure
Lendlease’s multi-region operations across Australia, Asia, Europe and the Americas expose projects to tariffs, sanctions and local procurement preferences that can increase costs and approval timelines. Supply-chain friction for concrete, steel and façade systems raises schedule and budget risk, prompting contingency pricing and longer lead times. Local content rules in key markets drive contractor selection and design adjustments; strategic sourcing and local partner networks mitigate disruption.
- Regions: four (Australia, Asia, Europe, Americas)
- Key risks: tariffs, sanctions, procurement preferences
- Supply-chain impact: higher costs, timeline risk for materials
- Mitigant: strategic sourcing and local partner networks
Tax and investment incentives
Incentives for green buildings and urban renewal lift project IRRs by improving leaseability and lowering operating costs, while changes to stamp duty, land tax or depreciation rules materially affect buyer demand and asset valuations across Lendlease portfolios. Navigating divergent tax regimes in Australia, UK and US requires specialized deal structuring and transfer-pricing expertise. Active policy advocacy helps shape planning outcomes and competitive positioning.
- Tax incentives: influence demand and valuation
- Depreciation/stamp duty: alter buyer economics
- Cross-market structuring: necessary for consistency
- Policy advocacy: shapes planning and competitiveness
A$20bn+ pipeline risk: 6–18m delays could cut GFA 20–30%
Lendlease’s A$20bn+ development pipeline (Jun 2024) makes it highly sensitive to shifting public priorities, approvals and funding changes. Planning delays (commonly 6–18 months) and policy swings can alter developable GFA 20–30%, affecting timelines and margins. Multi-region exposure (Australia, Asia, Europe, Americas) raises tariff, local-content and procurement risks; green incentives and tax rules materially change asset IRRs.
| Metric | Value |
|---|---|
| Development pipeline | A$20bn+ |
| Planning delays | 6–18 months |
| GFA impact | 20–30% |
| Regions | 4 |
| Infra pipeline (Aus) | A$100bn (2024) |
| UK affordable homes | £11.5bn (2021–26) |
What is included in the product
 Detailed Word Document
Explores how external macro-environmental factors uniquely affect LendLease across Political, Economic, Social, Technological, Environmental and Legal dimensions, with data-backed trends and region-specific regulatory context. Designed for executives and investors, it provides forward-looking insights and actionable scenarios, ready to insert into plans, decks or reports.

 Customizable Excel Spreadsheet
A concise, visually segmented LendLease PESTLE summary that eases meeting prep and stakeholder alignment by highlighting key political, economic, social, technological, legal and environmental risks—editable for region- or business-line specifics and drop-in ready for presentations or client reports.
Economic factors

Interest rates and cap rates
Rate paths drive financing costs and asset valuations: US Fed funds at 5.25–5.50% and 10‑yr yields near 4% in mid‑2025 are elevating borrowing costs and valuation discounting. Cap rate expansion of roughly 100–150 bps in major office markets since 2021 has compressed development margins and fund IRRs. Active hedging and phased launches mitigate exposure, while pivots to rental or pre‑sold product stabilise cash flows.
Construction inflation and labor
Material and labor cost volatility—global construction cost inflation averaged 6–10% in major markets in 2023–24 (Turner & Townsend 2024)—raises risks for guaranteed maximum price and lump‑sum contracts for LendLease. Tight labor markets (Australia unemployment ~3.7% in 2024) compress schedules and contingency buffers. Collaborative procurement and early contractor involvement improve cost certainty, while productivity tools and modularisation can cut onsite labor by up to 30%.

Real estate demand cycles
Real estate demand cycles show office, residential, retail and logistics moving asynchronously, and in 2024 Lendlease mitigates timing risk via pre-sales, pre-lets and anchor tenants that materially reduce take-up exposure. Diversification across sectors and tenures smooths earnings volatility while dynamic pricing and phased releases preserve absorption and protect margins during uneven market recovery.

FX and multi-market exposure
- FX exposure: AUD/GBP/USD
- Risk: margin erosion from mismatches
- Mitigation: natural hedges + derivatives
- Strategy: capital recycling to rebalance weights
Capital availability and cost
Fundraising conditions directly shape Lendlease Investment Management fee growth and co-invest capacity; global real estate fundraising fell about 18% in 2024 while RBA cash rate was 4.35% (June 2025), tightening cost of capital and pressuring fee momentum. Tighter credit cycles delayed buyer settlements and developer finance, but Lendlease’s strong balance sheet and strategic partners position it to pursue counter‑cyclical acquisitions. A transparent track record has sustained LP commitments through volatility.
- Fundraising: global real estate fundraising -18% in 2024
- Rate backdrop: RBA cash rate 4.35% (Jun 2025)
- Balance sheet: enables counter‑cyclical M&A and co‑invest
- Track record: supports continued LP commitments
A$20bn+ pipeline risk: 6–18m delays could cut GFA 20–30%
Higher rates (US Fed 5.25–5.50% mid‑2025; 10y ~4%) and RBA cash 4.35% (Jun 2025) lift financing costs and compress development IRRs; cap rates have widened ~100–150bps since 2021. Construction inflation 6–10% (2023–24) and tight Aussie labour (~3.7% 2024) raise delivery risk. Fundraising fell ~18% in 2024; FX (AUD/GBP/USD) and hedges shape margin volatility.
| Metric | Value |
|---|---|
| US Fed funds | 5.25–5.50% (mid‑2025) |
| 10‑yr yield | ~4% (mid‑2025) |
| RBA cash rate | 4.35% (Jun 2025) |
| Fundraising | -18% (2024) |
| Construction inflation | 6–10% (2023–24) |
| Unemployment AUS | ~3.7% (2024) |
| Cap‑rate shift | +100–150bps since 2021 |
Full Version Awaits
LendLease PESTLE Analysis
The LendLease PESTLE Analysis preview shown here is the exact document you’ll receive after purchase—fully formatted and ready to use. This real screenshot reflects the final file with complete political, economic, social, technological, legal and environmental insights. No placeholders, no surprises—download the same finished report upon checkout.

Your Shortcut to Market Insight Starts Here
Unlock strategic clarity with our PESTLE Analysis of LendLease—mapping political, economic, social, technological, legal, and environmental forces that will shape its next moves. Ideal for investors, advisors, and executives, this concise briefing highlights risks and growth levers you can act on today. Purchase the full, editable report for the complete, actionable intelligence.
Political factors
Public–private partnership dynamics
Lendlease frequently partners with governments on regeneration and infrastructure, exposing its pipeline to shifting public priorities; at June 2024 its development pipeline exceeded A$20 billion, heightening sensitivity to policy change. Changes in leadership or funding can alter project scope, timelines and margins. Stable relationships and transparent governance are critical for pipeline visibility, and diversifying counterparties and geographies reduces concentration risk.
Urban planning and approvals
Planning approvals for Lendlease projects are often lengthy and politicized, commonly adding 6–18 months to delivery and increasing cost of capital; delays affected several Australian precincts in 2023–24. Policy swings on density, heritage and transport can alter developable GFA by as much as 20–30%, unlocking or stalling precinct revenue. Early stakeholder engagement and consent de‑risking cut approval overruns materially, while scenario planning for conditions and appeals preserves delivery certainty.
Infrastructure and housing policy
Government stimulus for transport, social housing and climate adaptation can catalyse demand—Infrastructure Australia lists a priority pipeline exceeding A$100bn (2024) and the UK Affordable Homes Programme is funded at £11.5bn (2021–26). Conversely, austerity or reallocation can compress the opportunity set and shorten delivery windows. Aligning bids to affordability, resilience and local job outcomes improves win rates. Monitoring budget cycles and spending reviews sharpens bid timing and resource allocation.
Geopolitics and trade exposure
Lendlease’s multi-region operations across Australia, Asia, Europe and the Americas expose projects to tariffs, sanctions and local procurement preferences that can increase costs and approval timelines. Supply-chain friction for concrete, steel and façade systems raises schedule and budget risk, prompting contingency pricing and longer lead times. Local content rules in key markets drive contractor selection and design adjustments; strategic sourcing and local partner networks mitigate disruption.
- Regions: four (Australia, Asia, Europe, Americas)
- Key risks: tariffs, sanctions, procurement preferences
- Supply-chain impact: higher costs, timeline risk for materials
- Mitigant: strategic sourcing and local partner networks
Tax and investment incentives
Incentives for green buildings and urban renewal lift project IRRs by improving leaseability and lowering operating costs, while changes to stamp duty, land tax or depreciation rules materially affect buyer demand and asset valuations across Lendlease portfolios. Navigating divergent tax regimes in Australia, UK and US requires specialized deal structuring and transfer-pricing expertise. Active policy advocacy helps shape planning outcomes and competitive positioning.
- Tax incentives: influence demand and valuation
- Depreciation/stamp duty: alter buyer economics
- Cross-market structuring: necessary for consistency
- Policy advocacy: shapes planning and competitiveness
A$20bn+ pipeline risk: 6–18m delays could cut GFA 20–30%
Lendlease’s A$20bn+ development pipeline (Jun 2024) makes it highly sensitive to shifting public priorities, approvals and funding changes. Planning delays (commonly 6–18 months) and policy swings can alter developable GFA 20–30%, affecting timelines and margins. Multi-region exposure (Australia, Asia, Europe, Americas) raises tariff, local-content and procurement risks; green incentives and tax rules materially change asset IRRs.
| Metric | Value |
|---|---|
| Development pipeline | A$20bn+ |
| Planning delays | 6–18 months |
| GFA impact | 20–30% |
| Regions | 4 |
| Infra pipeline (Aus) | A$100bn (2024) |
| UK affordable homes | £11.5bn (2021–26) |
What is included in the product
Detailed Word Document
Explores how external macro-environmental factors uniquely affect LendLease across Political, Economic, Social, Technological, Environmental and Legal dimensions, with data-backed trends and region-specific regulatory context. Designed for executives and investors, it provides forward-looking insights and actionable scenarios, ready to insert into plans, decks or reports.
Customizable Excel Spreadsheet
A concise, visually segmented LendLease PESTLE summary that eases meeting prep and stakeholder alignment by highlighting key political, economic, social, technological, legal and environmental risks—editable for region- or business-line specifics and drop-in ready for presentations or client reports.
Economic factors
Interest rates and cap rates
Rate paths drive financing costs and asset valuations: US Fed funds at 5.25–5.50% and 10‑yr yields near 4% in mid‑2025 are elevating borrowing costs and valuation discounting. Cap rate expansion of roughly 100–150 bps in major office markets since 2021 has compressed development margins and fund IRRs. Active hedging and phased launches mitigate exposure, while pivots to rental or pre‑sold product stabilise cash flows.
Construction inflation and labor
Material and labor cost volatility—global construction cost inflation averaged 6–10% in major markets in 2023–24 (Turner & Townsend 2024)—raises risks for guaranteed maximum price and lump‑sum contracts for LendLease. Tight labor markets (Australia unemployment ~3.7% in 2024) compress schedules and contingency buffers. Collaborative procurement and early contractor involvement improve cost certainty, while productivity tools and modularisation can cut onsite labor by up to 30%.
Real estate demand cycles
Real estate demand cycles show office, residential, retail and logistics moving asynchronously, and in 2024 Lendlease mitigates timing risk via pre-sales, pre-lets and anchor tenants that materially reduce take-up exposure. Diversification across sectors and tenures smooths earnings volatility while dynamic pricing and phased releases preserve absorption and protect margins during uneven market recovery.
FX and multi-market exposure
- FX exposure: AUD/GBP/USD
- Risk: margin erosion from mismatches
- Mitigation: natural hedges + derivatives
- Strategy: capital recycling to rebalance weights
Capital availability and cost
Fundraising conditions directly shape Lendlease Investment Management fee growth and co-invest capacity; global real estate fundraising fell about 18% in 2024 while RBA cash rate was 4.35% (June 2025), tightening cost of capital and pressuring fee momentum. Tighter credit cycles delayed buyer settlements and developer finance, but Lendlease’s strong balance sheet and strategic partners position it to pursue counter‑cyclical acquisitions. A transparent track record has sustained LP commitments through volatility.
- Fundraising: global real estate fundraising -18% in 2024
- Rate backdrop: RBA cash rate 4.35% (Jun 2025)
- Balance sheet: enables counter‑cyclical M&A and co‑invest
- Track record: supports continued LP commitments
A$20bn+ pipeline risk: 6–18m delays could cut GFA 20–30%
Higher rates (US Fed 5.25–5.50% mid‑2025; 10y ~4%) and RBA cash 4.35% (Jun 2025) lift financing costs and compress development IRRs; cap rates have widened ~100–150bps since 2021. Construction inflation 6–10% (2023–24) and tight Aussie labour (~3.7% 2024) raise delivery risk. Fundraising fell ~18% in 2024; FX (AUD/GBP/USD) and hedges shape margin volatility.
| Metric | Value |
|---|---|
| US Fed funds | 5.25–5.50% (mid‑2025) |
| 10‑yr yield | ~4% (mid‑2025) |
| RBA cash rate | 4.35% (Jun 2025) |
| Fundraising | -18% (2024) |
| Construction inflation | 6–10% (2023–24) |
| Unemployment AUS | ~3.7% (2024) |
| Cap‑rate shift | +100–150bps since 2021 |
Full Version Awaits
LendLease PESTLE Analysis
The LendLease PESTLE Analysis preview shown here is the exact document you’ll receive after purchase—fully formatted and ready to use. This real screenshot reflects the final file with complete political, economic, social, technological, legal and environmental insights. No placeholders, no surprises—download the same finished report upon checkout.
Original: $10.00
-65%$10.00
$3.50Description
Your Shortcut to Market Insight Starts Here
Unlock strategic clarity with our PESTLE Analysis of LendLease—mapping political, economic, social, technological, legal, and environmental forces that will shape its next moves. Ideal for investors, advisors, and executives, this concise briefing highlights risks and growth levers you can act on today. Purchase the full, editable report for the complete, actionable intelligence.
Political factors
Public–private partnership dynamics
Lendlease frequently partners with governments on regeneration and infrastructure, exposing its pipeline to shifting public priorities; at June 2024 its development pipeline exceeded A$20 billion, heightening sensitivity to policy change. Changes in leadership or funding can alter project scope, timelines and margins. Stable relationships and transparent governance are critical for pipeline visibility, and diversifying counterparties and geographies reduces concentration risk.
Urban planning and approvals
Planning approvals for Lendlease projects are often lengthy and politicized, commonly adding 6–18 months to delivery and increasing cost of capital; delays affected several Australian precincts in 2023–24. Policy swings on density, heritage and transport can alter developable GFA by as much as 20–30%, unlocking or stalling precinct revenue. Early stakeholder engagement and consent de‑risking cut approval overruns materially, while scenario planning for conditions and appeals preserves delivery certainty.
Infrastructure and housing policy
Government stimulus for transport, social housing and climate adaptation can catalyse demand—Infrastructure Australia lists a priority pipeline exceeding A$100bn (2024) and the UK Affordable Homes Programme is funded at £11.5bn (2021–26). Conversely, austerity or reallocation can compress the opportunity set and shorten delivery windows. Aligning bids to affordability, resilience and local job outcomes improves win rates. Monitoring budget cycles and spending reviews sharpens bid timing and resource allocation.
Geopolitics and trade exposure
Lendlease’s multi-region operations across Australia, Asia, Europe and the Americas expose projects to tariffs, sanctions and local procurement preferences that can increase costs and approval timelines. Supply-chain friction for concrete, steel and façade systems raises schedule and budget risk, prompting contingency pricing and longer lead times. Local content rules in key markets drive contractor selection and design adjustments; strategic sourcing and local partner networks mitigate disruption.
- Regions: four (Australia, Asia, Europe, Americas)
- Key risks: tariffs, sanctions, procurement preferences
- Supply-chain impact: higher costs, timeline risk for materials
- Mitigant: strategic sourcing and local partner networks
Tax and investment incentives
Incentives for green buildings and urban renewal lift project IRRs by improving leaseability and lowering operating costs, while changes to stamp duty, land tax or depreciation rules materially affect buyer demand and asset valuations across Lendlease portfolios. Navigating divergent tax regimes in Australia, UK and US requires specialized deal structuring and transfer-pricing expertise. Active policy advocacy helps shape planning outcomes and competitive positioning.
- Tax incentives: influence demand and valuation
- Depreciation/stamp duty: alter buyer economics
- Cross-market structuring: necessary for consistency
- Policy advocacy: shapes planning and competitiveness
A$20bn+ pipeline risk: 6–18m delays could cut GFA 20–30%
Lendlease’s A$20bn+ development pipeline (Jun 2024) makes it highly sensitive to shifting public priorities, approvals and funding changes. Planning delays (commonly 6–18 months) and policy swings can alter developable GFA 20–30%, affecting timelines and margins. Multi-region exposure (Australia, Asia, Europe, Americas) raises tariff, local-content and procurement risks; green incentives and tax rules materially change asset IRRs.
| Metric | Value |
|---|---|
| Development pipeline | A$20bn+ |
| Planning delays | 6–18 months |
| GFA impact | 20–30% |
| Regions | 4 |
| Infra pipeline (Aus) | A$100bn (2024) |
| UK affordable homes | £11.5bn (2021–26) |
What is included in the product
Detailed Word Document
Explores how external macro-environmental factors uniquely affect LendLease across Political, Economic, Social, Technological, Environmental and Legal dimensions, with data-backed trends and region-specific regulatory context. Designed for executives and investors, it provides forward-looking insights and actionable scenarios, ready to insert into plans, decks or reports.
Customizable Excel Spreadsheet
A concise, visually segmented LendLease PESTLE summary that eases meeting prep and stakeholder alignment by highlighting key political, economic, social, technological, legal and environmental risks—editable for region- or business-line specifics and drop-in ready for presentations or client reports.
Economic factors
Interest rates and cap rates
Rate paths drive financing costs and asset valuations: US Fed funds at 5.25–5.50% and 10‑yr yields near 4% in mid‑2025 are elevating borrowing costs and valuation discounting. Cap rate expansion of roughly 100–150 bps in major office markets since 2021 has compressed development margins and fund IRRs. Active hedging and phased launches mitigate exposure, while pivots to rental or pre‑sold product stabilise cash flows.
Construction inflation and labor
Material and labor cost volatility—global construction cost inflation averaged 6–10% in major markets in 2023–24 (Turner & Townsend 2024)—raises risks for guaranteed maximum price and lump‑sum contracts for LendLease. Tight labor markets (Australia unemployment ~3.7% in 2024) compress schedules and contingency buffers. Collaborative procurement and early contractor involvement improve cost certainty, while productivity tools and modularisation can cut onsite labor by up to 30%.
Real estate demand cycles
Real estate demand cycles show office, residential, retail and logistics moving asynchronously, and in 2024 Lendlease mitigates timing risk via pre-sales, pre-lets and anchor tenants that materially reduce take-up exposure. Diversification across sectors and tenures smooths earnings volatility while dynamic pricing and phased releases preserve absorption and protect margins during uneven market recovery.
FX and multi-market exposure
- FX exposure: AUD/GBP/USD
- Risk: margin erosion from mismatches
- Mitigation: natural hedges + derivatives
- Strategy: capital recycling to rebalance weights
Capital availability and cost
Fundraising conditions directly shape Lendlease Investment Management fee growth and co-invest capacity; global real estate fundraising fell about 18% in 2024 while RBA cash rate was 4.35% (June 2025), tightening cost of capital and pressuring fee momentum. Tighter credit cycles delayed buyer settlements and developer finance, but Lendlease’s strong balance sheet and strategic partners position it to pursue counter‑cyclical acquisitions. A transparent track record has sustained LP commitments through volatility.
- Fundraising: global real estate fundraising -18% in 2024
- Rate backdrop: RBA cash rate 4.35% (Jun 2025)
- Balance sheet: enables counter‑cyclical M&A and co‑invest
- Track record: supports continued LP commitments
A$20bn+ pipeline risk: 6–18m delays could cut GFA 20–30%
Higher rates (US Fed 5.25–5.50% mid‑2025; 10y ~4%) and RBA cash 4.35% (Jun 2025) lift financing costs and compress development IRRs; cap rates have widened ~100–150bps since 2021. Construction inflation 6–10% (2023–24) and tight Aussie labour (~3.7% 2024) raise delivery risk. Fundraising fell ~18% in 2024; FX (AUD/GBP/USD) and hedges shape margin volatility.
| Metric | Value |
|---|---|
| US Fed funds | 5.25–5.50% (mid‑2025) |
| 10‑yr yield | ~4% (mid‑2025) |
| RBA cash rate | 4.35% (Jun 2025) |
| Fundraising | -18% (2024) |
| Construction inflation | 6–10% (2023–24) |
| Unemployment AUS | ~3.7% (2024) |
| Cap‑rate shift | +100–150bps since 2021 |
Full Version Awaits
LendLease PESTLE Analysis
The LendLease PESTLE Analysis preview shown here is the exact document you’ll receive after purchase—fully formatted and ready to use. This real screenshot reflects the final file with complete political, economic, social, technological, legal and environmental insights. No placeholders, no surprises—download the same finished report upon checkout.











