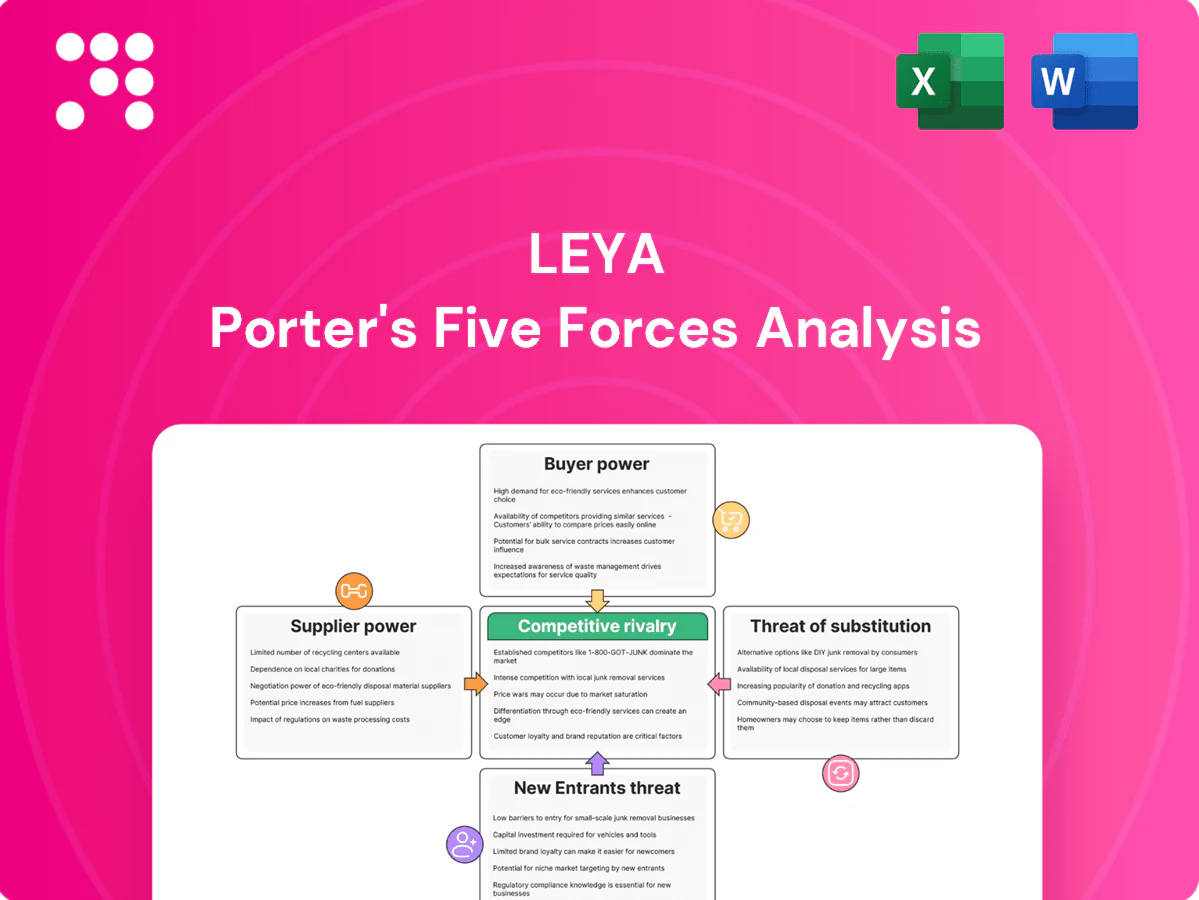
LeYa Porter's Five Forces Analysis

Don't Miss the Bigger Picture
LeYa’s Porter's Five Forces snapshot highlights competitive intensity, supplier and buyer leverage, and substitute risks shaping its margins and growth. The brief identifies key pressures but omits force-by-force ratings, visuals, and quantified implications. Ready for deeper, decision-ready insight? Unlock the full Porter's Five Forces Analysis for a consultant-grade, data-driven breakdown tailored to LeYa.
Suppliers Bargaining Power

Key authors’ leverage
Star authors and leading educators can command advances often ranging from 10,000 to 200,000 euros and royalties of roughly 8–15%, plus dedicated marketing commitments that can exceed 50,000 euros per title. Their switching or exclusive deals can shift 25–60% of a course literature list, materially affecting sales. LeYa mitigates this with multi-genre portfolios and nurturing debut talent to diversify risk, while long-term contracts and enhanced editorial support lower churn and stabilize revenues.
Paper & printing constraints
Paper price volatility and capacity bottlenecks have strengthened input power for mills and printers, tightening margins for LeYa and boosting supplier leverage. ESG-certified paper requirements shrink qualified vendor pools, increasing dependence on select certified mills. Multi-sourcing and long-term volume agreements are essential cost-stabilizers, while nearshoring and lead-time planning protect critical back-to-school fulfillment windows.

Digital platforms & tech
App stores, DRM providers and e-learning tech vendors impose fee structures and technical standards that shape margins. Apple and Google historically levy up to 30% commission while offering 15% reduced tiers for qualifying developers (Small Business/first $1M). Platform algorithms drive discoverability and effectively alter sales splits. Owning direct channels and interoperable formats, plus strategic partnerships, reduces dependence and offsets take-rate pressure.

Distribution and logistics
Wholesalers and last-mile carriers drive availability and returns economics; last-mile accounted for roughly 50-55% of delivery costs in 2024. Textbook seasonal spikes around fall term can lift volumes 30-50%, increasing carriers' leverage. Better forecasting and vendor-managed inventory (VMI) shift costs and reduce stockouts. Diversifying carriers and offering click-and-collect lower disruption and peak surcharges.
- Wholesalers/last-mile influence availability & returns
- Fall spikes raise carrier leverage ~30-50%
- Forecasting & VMI balance supplier power
- Diversify carriers + click-and-collect to dampen risk
Illustrators & specialists
Niche academic editors, illustrators, and rights holders command high bargaining power on flagship LeYa titles because specialized pedagogy and IP drive adoption; scarcity rises when curriculum reforms require rapid, localized expertise. Framework agreements and talent pipelines have lowered one-off sourcing costs and delivery risk, while co-development models tie incentives and schedules to mitigate delays and margin erosion.
- Specialist sourcing: reduces time-to-market
- Frameworks: stabilize costs and availability
- Co-development: aligns royalties and timelines
Author advances, royalties and paper shortages squeeze margins; platform fees and last-mile surge
Star authors demand advances of €10k–€200k and royalties of 8–15%, shifting 25–60% of course adoptions; certified paper constraints and mill bottlenecks raised input leverage in 2024. App stores take up to 30% (15% reduced tier). Last-mile was ~50–55% of delivery cost in 2024; fall spikes lift carrier leverage 30–50%.
| Supplier | 2024 metric |
|---|---|
| Authors | Advances €10k–200k, royalties 8–15% |
| Paper/mills | Certified supply tightness ↑ |
| Platforms | Take-rate 15–30% |
| Logistics | Last-mile 50–55%, peak +30–50% |
What is included in the product
 Detailed Word Document
Tailored Porter's Five Forces analysis for LeYa that uncovers key competitive drivers, buyer and supplier power, entry barriers, and substitutes, identifies disruptive threats and strategic opportunities, and supports investor materials, strategy decks, and academic use.

 Customizable Excel Spreadsheet
One-sheet LeYa Porter's Five Forces that distills competitive pressures into an actionable radar chart—ideal for fast strategic decisions, slide-ready summaries, and easy customization without complex tools.
Customers Bargaining Power

Schools and ministries
Public procurement and curriculum adoption concentrate buying power in schools and ministries, with adoption cycles typically every 3–5 years, making approval lists decisive for textbook volumes and print runs. Concentrated buyers show high price sensitivity, so bundled digital + print offers increase perceived value and help secure larger contracts. Demonstrable pedagogical outcomes and compliance with national standards drive retention and renewal in subsequent cycles.
Bookstores and chains
Large Portuguese and international chains negotiate deep discounts (commonly 30–50%), extended payment terms (60–120 days) and generous returns; shelf space and promotions determine velocity for general-interest titles and can drive 20–60% of unit sales. Data-sharing on assortments often trades 5–15% margin for volume gains. Omnichannel coordination has cut duplicate returns by roughly 10–20% in recent retailer reports.

Online marketplaces
Marketplaces enforce pricing transparency and commissions (Amazon referral fees average ~15% in 2024), compressing margins. Customer reviews and algorithmic rankings sway demand fast—about 89% of buyers consult reviews (2024), amplifying volatility. Brands use direct-to-consumer storefronts to hedge dependency, while subscription and pre-order tactics increase predictable revenue and inventory visibility.

Parents and students
Parents and students exert strong price sensitivity, with 2024 surveys showing about 68% compare publishers before buying; budget constraints increase churn. Demand for durable print, ancillary materials and digital access raises expectations and shifts bargaining toward bundled offerings. Value packs and timed access codes help justify premium pricing and clear outcomes/usability drive positive word-of-mouth.
Libraries and institutions
Libraries and institutions exert strong bargaining power by negotiating multi-year licenses and lending terms for print and e-books, often securing discounts in practice via consortia; usage caps and choices between perpetual access versus subscription models materially affect publisher revenue streams in 2024. Flexible, patron-driven or short-term loan licensing increases institutional adoption, while rich, accessible metadata remains a key selection criterion.
- Negotiation: multi-year licenses common
- Revenue impact: perpetual vs subscription models
- Adoption boost: flexible licensing
- Selection driver: metadata quality/availability
Approval lists drive volumes: 3–5 yr, discounts 30–50%
Public procurement and curriculum adoption concentrate buying power (cycles 3–5 yrs), making approval lists decisive for volumes and print runs.
Retail chains push deep discounts (30–50%) and long payment terms (60–120 days); marketplaces compress margins (Amazon avg 15% referral fee in 2024).
Consumers compare publishers (~68% in 2024), prefer bundled print+digital; libraries negotiate multi-year licenses, shifting revenue models.
| Buyer | 2024 stat | Impact |
|---|---|---|
| Procurement | 3–5 yr cycles | Controls volumes |
| Retail | 30–50% discounts | Margin pressure |
| Consumers | 68% compare | Price sensitivity |
Full Version Awaits
LeYa Porter's Five Forces Analysis
This preview is the exact LeYa Porter's Five Forces Analysis you'll receive after purchase—no samples or placeholders. The file is fully formatted and ready for immediate download and use the moment you complete payment. What you see here is the final deliverable, complete and professional.

Don't Miss the Bigger Picture
LeYa’s Porter's Five Forces snapshot highlights competitive intensity, supplier and buyer leverage, and substitute risks shaping its margins and growth. The brief identifies key pressures but omits force-by-force ratings, visuals, and quantified implications. Ready for deeper, decision-ready insight? Unlock the full Porter's Five Forces Analysis for a consultant-grade, data-driven breakdown tailored to LeYa.
Suppliers Bargaining Power
Key authors’ leverage
Star authors and leading educators can command advances often ranging from 10,000 to 200,000 euros and royalties of roughly 8–15%, plus dedicated marketing commitments that can exceed 50,000 euros per title. Their switching or exclusive deals can shift 25–60% of a course literature list, materially affecting sales. LeYa mitigates this with multi-genre portfolios and nurturing debut talent to diversify risk, while long-term contracts and enhanced editorial support lower churn and stabilize revenues.
Paper & printing constraints
Paper price volatility and capacity bottlenecks have strengthened input power for mills and printers, tightening margins for LeYa and boosting supplier leverage. ESG-certified paper requirements shrink qualified vendor pools, increasing dependence on select certified mills. Multi-sourcing and long-term volume agreements are essential cost-stabilizers, while nearshoring and lead-time planning protect critical back-to-school fulfillment windows.
Digital platforms & tech
App stores, DRM providers and e-learning tech vendors impose fee structures and technical standards that shape margins. Apple and Google historically levy up to 30% commission while offering 15% reduced tiers for qualifying developers (Small Business/first $1M). Platform algorithms drive discoverability and effectively alter sales splits. Owning direct channels and interoperable formats, plus strategic partnerships, reduces dependence and offsets take-rate pressure.
Distribution and logistics
Wholesalers and last-mile carriers drive availability and returns economics; last-mile accounted for roughly 50-55% of delivery costs in 2024. Textbook seasonal spikes around fall term can lift volumes 30-50%, increasing carriers' leverage. Better forecasting and vendor-managed inventory (VMI) shift costs and reduce stockouts. Diversifying carriers and offering click-and-collect lower disruption and peak surcharges.
- Wholesalers/last-mile influence availability & returns
- Fall spikes raise carrier leverage ~30-50%
- Forecasting & VMI balance supplier power
- Diversify carriers + click-and-collect to dampen risk
Illustrators & specialists
Niche academic editors, illustrators, and rights holders command high bargaining power on flagship LeYa titles because specialized pedagogy and IP drive adoption; scarcity rises when curriculum reforms require rapid, localized expertise. Framework agreements and talent pipelines have lowered one-off sourcing costs and delivery risk, while co-development models tie incentives and schedules to mitigate delays and margin erosion.
- Specialist sourcing: reduces time-to-market
- Frameworks: stabilize costs and availability
- Co-development: aligns royalties and timelines
Author advances, royalties and paper shortages squeeze margins; platform fees and last-mile surge
Star authors demand advances of €10k–€200k and royalties of 8–15%, shifting 25–60% of course adoptions; certified paper constraints and mill bottlenecks raised input leverage in 2024. App stores take up to 30% (15% reduced tier). Last-mile was ~50–55% of delivery cost in 2024; fall spikes lift carrier leverage 30–50%.
| Supplier | 2024 metric |
|---|---|
| Authors | Advances €10k–200k, royalties 8–15% |
| Paper/mills | Certified supply tightness ↑ |
| Platforms | Take-rate 15–30% |
| Logistics | Last-mile 50–55%, peak +30–50% |
What is included in the product
Detailed Word Document
Tailored Porter's Five Forces analysis for LeYa that uncovers key competitive drivers, buyer and supplier power, entry barriers, and substitutes, identifies disruptive threats and strategic opportunities, and supports investor materials, strategy decks, and academic use.
Customizable Excel Spreadsheet
One-sheet LeYa Porter's Five Forces that distills competitive pressures into an actionable radar chart—ideal for fast strategic decisions, slide-ready summaries, and easy customization without complex tools.
Customers Bargaining Power
Schools and ministries
Public procurement and curriculum adoption concentrate buying power in schools and ministries, with adoption cycles typically every 3–5 years, making approval lists decisive for textbook volumes and print runs. Concentrated buyers show high price sensitivity, so bundled digital + print offers increase perceived value and help secure larger contracts. Demonstrable pedagogical outcomes and compliance with national standards drive retention and renewal in subsequent cycles.
Bookstores and chains
Large Portuguese and international chains negotiate deep discounts (commonly 30–50%), extended payment terms (60–120 days) and generous returns; shelf space and promotions determine velocity for general-interest titles and can drive 20–60% of unit sales. Data-sharing on assortments often trades 5–15% margin for volume gains. Omnichannel coordination has cut duplicate returns by roughly 10–20% in recent retailer reports.
Online marketplaces
Marketplaces enforce pricing transparency and commissions (Amazon referral fees average ~15% in 2024), compressing margins. Customer reviews and algorithmic rankings sway demand fast—about 89% of buyers consult reviews (2024), amplifying volatility. Brands use direct-to-consumer storefronts to hedge dependency, while subscription and pre-order tactics increase predictable revenue and inventory visibility.
Parents and students
Parents and students exert strong price sensitivity, with 2024 surveys showing about 68% compare publishers before buying; budget constraints increase churn. Demand for durable print, ancillary materials and digital access raises expectations and shifts bargaining toward bundled offerings. Value packs and timed access codes help justify premium pricing and clear outcomes/usability drive positive word-of-mouth.
Libraries and institutions
Libraries and institutions exert strong bargaining power by negotiating multi-year licenses and lending terms for print and e-books, often securing discounts in practice via consortia; usage caps and choices between perpetual access versus subscription models materially affect publisher revenue streams in 2024. Flexible, patron-driven or short-term loan licensing increases institutional adoption, while rich, accessible metadata remains a key selection criterion.
- Negotiation: multi-year licenses common
- Revenue impact: perpetual vs subscription models
- Adoption boost: flexible licensing
- Selection driver: metadata quality/availability
Approval lists drive volumes: 3–5 yr, discounts 30–50%
Public procurement and curriculum adoption concentrate buying power (cycles 3–5 yrs), making approval lists decisive for volumes and print runs.
Retail chains push deep discounts (30–50%) and long payment terms (60–120 days); marketplaces compress margins (Amazon avg 15% referral fee in 2024).
Consumers compare publishers (~68% in 2024), prefer bundled print+digital; libraries negotiate multi-year licenses, shifting revenue models.
| Buyer | 2024 stat | Impact |
|---|---|---|
| Procurement | 3–5 yr cycles | Controls volumes |
| Retail | 30–50% discounts | Margin pressure |
| Consumers | 68% compare | Price sensitivity |
Full Version Awaits
LeYa Porter's Five Forces Analysis
This preview is the exact LeYa Porter's Five Forces Analysis you'll receive after purchase—no samples or placeholders. The file is fully formatted and ready for immediate download and use the moment you complete payment. What you see here is the final deliverable, complete and professional.
Description
Don't Miss the Bigger Picture
LeYa’s Porter's Five Forces snapshot highlights competitive intensity, supplier and buyer leverage, and substitute risks shaping its margins and growth. The brief identifies key pressures but omits force-by-force ratings, visuals, and quantified implications. Ready for deeper, decision-ready insight? Unlock the full Porter's Five Forces Analysis for a consultant-grade, data-driven breakdown tailored to LeYa.
Suppliers Bargaining Power
Key authors’ leverage
Star authors and leading educators can command advances often ranging from 10,000 to 200,000 euros and royalties of roughly 8–15%, plus dedicated marketing commitments that can exceed 50,000 euros per title. Their switching or exclusive deals can shift 25–60% of a course literature list, materially affecting sales. LeYa mitigates this with multi-genre portfolios and nurturing debut talent to diversify risk, while long-term contracts and enhanced editorial support lower churn and stabilize revenues.
Paper & printing constraints
Paper price volatility and capacity bottlenecks have strengthened input power for mills and printers, tightening margins for LeYa and boosting supplier leverage. ESG-certified paper requirements shrink qualified vendor pools, increasing dependence on select certified mills. Multi-sourcing and long-term volume agreements are essential cost-stabilizers, while nearshoring and lead-time planning protect critical back-to-school fulfillment windows.
Digital platforms & tech
App stores, DRM providers and e-learning tech vendors impose fee structures and technical standards that shape margins. Apple and Google historically levy up to 30% commission while offering 15% reduced tiers for qualifying developers (Small Business/first $1M). Platform algorithms drive discoverability and effectively alter sales splits. Owning direct channels and interoperable formats, plus strategic partnerships, reduces dependence and offsets take-rate pressure.
Distribution and logistics
Wholesalers and last-mile carriers drive availability and returns economics; last-mile accounted for roughly 50-55% of delivery costs in 2024. Textbook seasonal spikes around fall term can lift volumes 30-50%, increasing carriers' leverage. Better forecasting and vendor-managed inventory (VMI) shift costs and reduce stockouts. Diversifying carriers and offering click-and-collect lower disruption and peak surcharges.
- Wholesalers/last-mile influence availability & returns
- Fall spikes raise carrier leverage ~30-50%
- Forecasting & VMI balance supplier power
- Diversify carriers + click-and-collect to dampen risk
Illustrators & specialists
Niche academic editors, illustrators, and rights holders command high bargaining power on flagship LeYa titles because specialized pedagogy and IP drive adoption; scarcity rises when curriculum reforms require rapid, localized expertise. Framework agreements and talent pipelines have lowered one-off sourcing costs and delivery risk, while co-development models tie incentives and schedules to mitigate delays and margin erosion.
- Specialist sourcing: reduces time-to-market
- Frameworks: stabilize costs and availability
- Co-development: aligns royalties and timelines
Author advances, royalties and paper shortages squeeze margins; platform fees and last-mile surge
Star authors demand advances of €10k–€200k and royalties of 8–15%, shifting 25–60% of course adoptions; certified paper constraints and mill bottlenecks raised input leverage in 2024. App stores take up to 30% (15% reduced tier). Last-mile was ~50–55% of delivery cost in 2024; fall spikes lift carrier leverage 30–50%.
| Supplier | 2024 metric |
|---|---|
| Authors | Advances €10k–200k, royalties 8–15% |
| Paper/mills | Certified supply tightness ↑ |
| Platforms | Take-rate 15–30% |
| Logistics | Last-mile 50–55%, peak +30–50% |
What is included in the product
Detailed Word Document
Tailored Porter's Five Forces analysis for LeYa that uncovers key competitive drivers, buyer and supplier power, entry barriers, and substitutes, identifies disruptive threats and strategic opportunities, and supports investor materials, strategy decks, and academic use.
Customizable Excel Spreadsheet
One-sheet LeYa Porter's Five Forces that distills competitive pressures into an actionable radar chart—ideal for fast strategic decisions, slide-ready summaries, and easy customization without complex tools.
Customers Bargaining Power
Schools and ministries
Public procurement and curriculum adoption concentrate buying power in schools and ministries, with adoption cycles typically every 3–5 years, making approval lists decisive for textbook volumes and print runs. Concentrated buyers show high price sensitivity, so bundled digital + print offers increase perceived value and help secure larger contracts. Demonstrable pedagogical outcomes and compliance with national standards drive retention and renewal in subsequent cycles.
Bookstores and chains
Large Portuguese and international chains negotiate deep discounts (commonly 30–50%), extended payment terms (60–120 days) and generous returns; shelf space and promotions determine velocity for general-interest titles and can drive 20–60% of unit sales. Data-sharing on assortments often trades 5–15% margin for volume gains. Omnichannel coordination has cut duplicate returns by roughly 10–20% in recent retailer reports.
Online marketplaces
Marketplaces enforce pricing transparency and commissions (Amazon referral fees average ~15% in 2024), compressing margins. Customer reviews and algorithmic rankings sway demand fast—about 89% of buyers consult reviews (2024), amplifying volatility. Brands use direct-to-consumer storefronts to hedge dependency, while subscription and pre-order tactics increase predictable revenue and inventory visibility.
Parents and students
Parents and students exert strong price sensitivity, with 2024 surveys showing about 68% compare publishers before buying; budget constraints increase churn. Demand for durable print, ancillary materials and digital access raises expectations and shifts bargaining toward bundled offerings. Value packs and timed access codes help justify premium pricing and clear outcomes/usability drive positive word-of-mouth.
Libraries and institutions
Libraries and institutions exert strong bargaining power by negotiating multi-year licenses and lending terms for print and e-books, often securing discounts in practice via consortia; usage caps and choices between perpetual access versus subscription models materially affect publisher revenue streams in 2024. Flexible, patron-driven or short-term loan licensing increases institutional adoption, while rich, accessible metadata remains a key selection criterion.
- Negotiation: multi-year licenses common
- Revenue impact: perpetual vs subscription models
- Adoption boost: flexible licensing
- Selection driver: metadata quality/availability
Approval lists drive volumes: 3–5 yr, discounts 30–50%
Public procurement and curriculum adoption concentrate buying power (cycles 3–5 yrs), making approval lists decisive for volumes and print runs.
Retail chains push deep discounts (30–50%) and long payment terms (60–120 days); marketplaces compress margins (Amazon avg 15% referral fee in 2024).
Consumers compare publishers (~68% in 2024), prefer bundled print+digital; libraries negotiate multi-year licenses, shifting revenue models.
| Buyer | 2024 stat | Impact |
|---|---|---|
| Procurement | 3–5 yr cycles | Controls volumes |
| Retail | 30–50% discounts | Margin pressure |
| Consumers | 68% compare | Price sensitivity |
Full Version Awaits
LeYa Porter's Five Forces Analysis
This preview is the exact LeYa Porter's Five Forces Analysis you'll receive after purchase—no samples or placeholders. The file is fully formatted and ready for immediate download and use the moment you complete payment. What you see here is the final deliverable, complete and professional.











