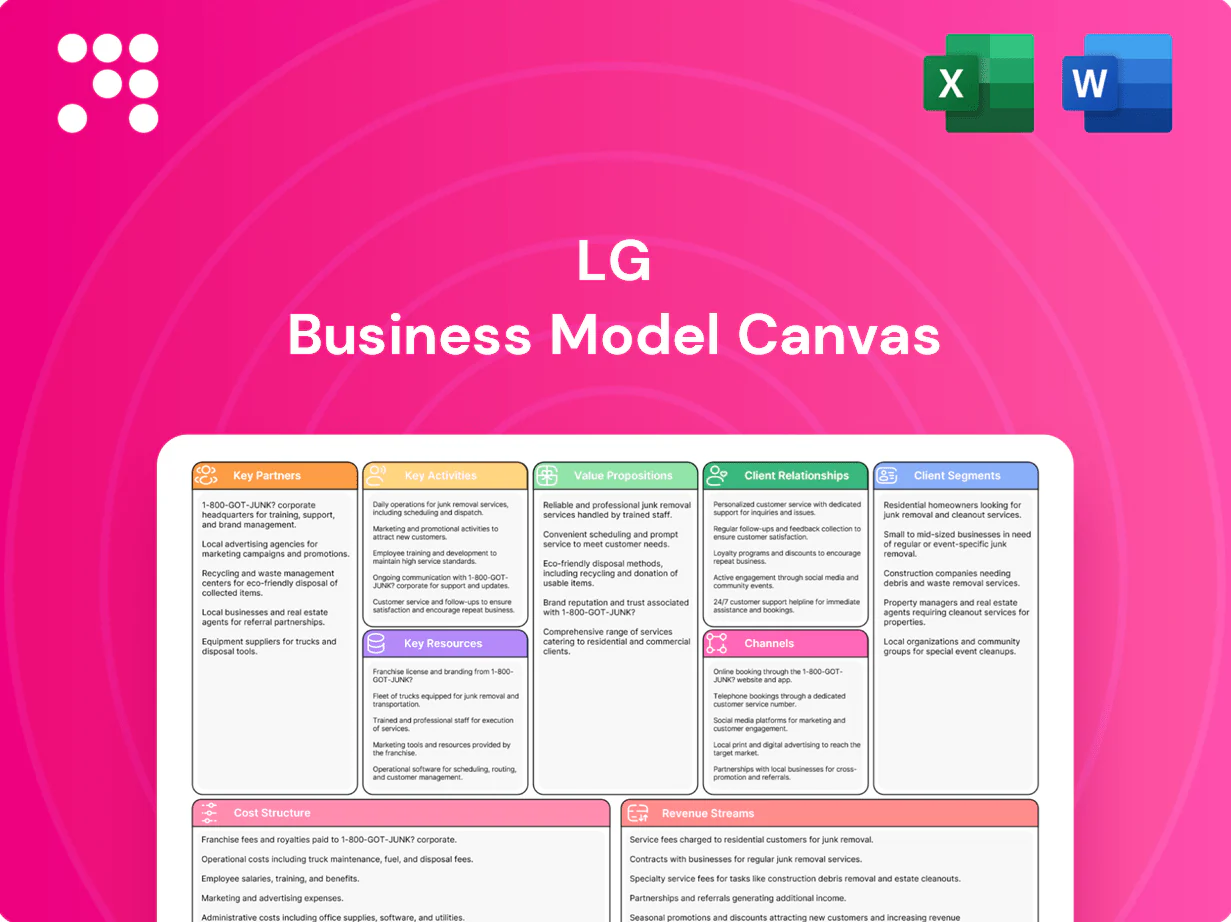
LG Business Model Canvas

Unlock the strategic playbook: Business Model Canvas to scale value and monetize innovation
Unlock LG’s strategic playbook with our Business Model Canvas—three to five concise sections that reveal how LG creates value, scales operations, and monetizes innovation. Ideal for investors, consultants, and founders, the full downloadable Canvas (Word & Excel) delivers a section-by-section blueprint for benchmarking and strategic planning—get it to transform insight into action.
Partnerships

Strategic component and materials suppliers
LG relies on global suppliers for semiconductors, display panels, sensors, cathode/anode materials and specialty chemicals; in 2024 LG maintained multi-year procurement relationships to secure critical inputs. Long-term agreements lock volume, pricing and priority allocations in tight markets, while joint qualification and co-development programs boost performance and yield. Multi-sourcing across regions mitigates geopolitical and supply-chain risks.
Telecom infrastructure and regulatory partners
Network equipment vendors and tower companies enable LG Uplus 5G and FTTx rollout, with shared tower/RAN deals in 2024 cutting deployment capex by up to 40% per operator and accelerating site buildouts. Spectrum coordination with regulators secures coverage, capacity, and licence compliance critical for urban 5G and rural FTTx targets. Roaming and MVNO agreements expand reach cost-effectively, increasing service footprint without proportional capex. Shared infrastructure partnerships lower unit costs and speed time-to-market for new services.

Software, content, and platform ecosystems
LG’s webOS Smart TV and partner app stores (standard 70/30 storefront splits) plus licensing of major streamers enrich device value and retention. Cloud partners (AWS, Azure, GCP collectively >60% market share in 2024) enable OTT scale and firmware rollouts. Voice assistants, home-platform and AI partners deepen engagement through personalized UX. Joint roadmaps preserve feature parity, timely security updates and shared revenue incentives.

Automotive and industrial JV alliances
- Co-investment: risk-share, faster standards
- Supply contracts: 5–10 year terms
- Compliance: ISO 26262, UNECE R155/R157
Universities, labs, and startup ecosystems
External R&D partnerships with universities, national labs, and startup ecosystems accelerate breakthroughs in batteries, displays, AI, and biochemistry, while incubation and CVC investments create option value in emerging domains and new markets. IP co-creation and licensing strengthen technological defensibility and revenue streams, and structured talent pipelines from academia ensure skilled hires for future growth.
- R&D acceleration
- CVC option value
- IP co-creation
- Talent pipeline
Multi-year supply contracts and shared infra cut capex up to 40%
LG leverages multi-year supplier contracts (5–10 yr) and multi-sourcing to secure semiconductors, panels and EV modules; 2024 procurement emphasized priority allocations. Shared tower/RAN deals cut deployment capex by up to 40% and MVNO/roaming expand reach. WebOS app splits 70/30; cloud partners AWS/Azure/GCP >60% market share in 2024 support OTT scale.
| Metric | 2024 |
|---|---|
| Capex saving (shared infra) | up to 40% |
| App store split | 70/30 |
| Cloud partner market share | >60% |
| Supply contract length | 5–10 yrs |
What is included in the product
 Detailed Word Document
A comprehensive, pre-written Business Model Canvas for LG covering customer segments, channels, value propositions, key activities, partners, revenue streams and cost structure, with SWOT-linked insights and a polished format for investors and analysts.

 Customizable Excel Spreadsheet
Condenses LG's strategy into a digestible, editable one-page canvas that saves hours of structuring and is perfect for boardrooms or team collaboration.
Activities

Portfolio strategy and capital allocation
As a holding company, LG allocates capital across electronics, chemicals and telecom, prioritizing businesses that deliver ROIC above 10% and demonstrable synergies; in 2024 this shaped increased allocation to EV battery adjacencies and premium appliances. M&A, carve-outs and joint ventures are used to reweight the portfolio, with multiple transactions in 2024 focused on scale and technology access. Dividend policy and selective debt financing sustain balance-sheet flexibility and liquidity buffers to support strategic moves.
R&D and product innovation
Core labs at LG drive advances in materials, OLED/QD displays, AI and connectivity, supported by KRW 1.2 trillion in R&D investment in 2024. Customer insights inform design priorities for performance, sustainability and usability, contributing to higher NPS in tested segments. Rapid prototyping and iterative testing cut time-to-market by up to 30%. Active standards participation ensures interoperability across ecosystems.

Manufacturing and supply chain orchestration
LG scales TV, appliance, component and material production across more than 70 global plants, applying lean practices to sustain throughput while supporting 2024 consolidated revenues of KRW 74.6 trillion. Supplier management balances cost, quality and resilience across a multi-thousand supplier base, with strategic dual-sourcing to cut disruption risk. Advanced forecasting and logistics trim inventory and lead times, improving turns and working capital. ESG sourcing and operations follow binding targets and supplier audits to ensure compliance.

Brand, marketing, and channel management
Unified branding elevates LG's premium positioning across appliances and TVs, driving higher ASPs; omnichannel campaigns convert awareness into sales with global e‑commerce at about 23% of retail in 2024 (Statista). Retail, carrier, and distributor programs increase shelf and bundled presence, while targeted pricing and promotions protect mix and margins.
- Brand premium: higher ASPs
- Omnichannel: 23% e‑commerce 2024
- Channels: retail/carrier/distributor
- Pricing: margin & mix management
Customer service and network operations
After-sales service sustains loyalty and lowers churn by offering repair networks, field technicians and remote diagnostics that increase device uptime; LG aligns telecom NOC operations to meet industry SLA targets (eg 99.9% availability) and reduce MTTR. Continuous feedback loops from service channels feed product and process improvements, supporting repeat purchases and warranty cost control.
- Repair network coverage: global service centers and field teams
- Telecom NOC: 99.9% availability target
- MTTR focus: industry benchmark <2 hours
- Feedback loop: service → product R&D
Capital shift to EV battery adjacencies and premium appliances; ROIC >10%
As a holding company LG allocates capital across electronics, chemicals and telecom, targeting ROIC >10% and shifted investment to EV battery adjacencies and premium appliances in 2024. Core labs led R&D of KRW 1.2 trillion in 2024 advancing OLED/QD, materials and AI; 70+ global plants supported KRW 74.6 trillion revenue. After-sales service and telecom NOC aim 99.9% availability and MTTR <2h.
| Metric | 2024 |
|---|---|
| Revenue | KRW 74.6 trillion |
| R&D | KRW 1.2 trillion |
| E‑commerce | 23% |
| Plants | 70+ |
| ROIC target | >10% |
| NOC SLA | 99.9% |
| MTTR | <2 hours |
Full Document Unlocks After Purchase
Business Model Canvas
The document you're previewing is the exact LG Business Model Canvas you'll receive after purchase. This preview is not a mockup—it's a direct snapshot of the final, editable file. Upon buying, you'll instantly download the same complete document, ready to edit, present, and apply.

Unlock the strategic playbook: Business Model Canvas to scale value and monetize innovation
Unlock LG’s strategic playbook with our Business Model Canvas—three to five concise sections that reveal how LG creates value, scales operations, and monetizes innovation. Ideal for investors, consultants, and founders, the full downloadable Canvas (Word & Excel) delivers a section-by-section blueprint for benchmarking and strategic planning—get it to transform insight into action.
Partnerships
Strategic component and materials suppliers
LG relies on global suppliers for semiconductors, display panels, sensors, cathode/anode materials and specialty chemicals; in 2024 LG maintained multi-year procurement relationships to secure critical inputs. Long-term agreements lock volume, pricing and priority allocations in tight markets, while joint qualification and co-development programs boost performance and yield. Multi-sourcing across regions mitigates geopolitical and supply-chain risks.
Telecom infrastructure and regulatory partners
Network equipment vendors and tower companies enable LG Uplus 5G and FTTx rollout, with shared tower/RAN deals in 2024 cutting deployment capex by up to 40% per operator and accelerating site buildouts. Spectrum coordination with regulators secures coverage, capacity, and licence compliance critical for urban 5G and rural FTTx targets. Roaming and MVNO agreements expand reach cost-effectively, increasing service footprint without proportional capex. Shared infrastructure partnerships lower unit costs and speed time-to-market for new services.
Software, content, and platform ecosystems
LG’s webOS Smart TV and partner app stores (standard 70/30 storefront splits) plus licensing of major streamers enrich device value and retention. Cloud partners (AWS, Azure, GCP collectively >60% market share in 2024) enable OTT scale and firmware rollouts. Voice assistants, home-platform and AI partners deepen engagement through personalized UX. Joint roadmaps preserve feature parity, timely security updates and shared revenue incentives.
Automotive and industrial JV alliances
- Co-investment: risk-share, faster standards
- Supply contracts: 5–10 year terms
- Compliance: ISO 26262, UNECE R155/R157
Universities, labs, and startup ecosystems
External R&D partnerships with universities, national labs, and startup ecosystems accelerate breakthroughs in batteries, displays, AI, and biochemistry, while incubation and CVC investments create option value in emerging domains and new markets. IP co-creation and licensing strengthen technological defensibility and revenue streams, and structured talent pipelines from academia ensure skilled hires for future growth.
- R&D acceleration
- CVC option value
- IP co-creation
- Talent pipeline
Multi-year supply contracts and shared infra cut capex up to 40%
LG leverages multi-year supplier contracts (5–10 yr) and multi-sourcing to secure semiconductors, panels and EV modules; 2024 procurement emphasized priority allocations. Shared tower/RAN deals cut deployment capex by up to 40% and MVNO/roaming expand reach. WebOS app splits 70/30; cloud partners AWS/Azure/GCP >60% market share in 2024 support OTT scale.
| Metric | 2024 |
|---|---|
| Capex saving (shared infra) | up to 40% |
| App store split | 70/30 |
| Cloud partner market share | >60% |
| Supply contract length | 5–10 yrs |
What is included in the product
Detailed Word Document
A comprehensive, pre-written Business Model Canvas for LG covering customer segments, channels, value propositions, key activities, partners, revenue streams and cost structure, with SWOT-linked insights and a polished format for investors and analysts.
Customizable Excel Spreadsheet
Condenses LG's strategy into a digestible, editable one-page canvas that saves hours of structuring and is perfect for boardrooms or team collaboration.
Activities
Portfolio strategy and capital allocation
As a holding company, LG allocates capital across electronics, chemicals and telecom, prioritizing businesses that deliver ROIC above 10% and demonstrable synergies; in 2024 this shaped increased allocation to EV battery adjacencies and premium appliances. M&A, carve-outs and joint ventures are used to reweight the portfolio, with multiple transactions in 2024 focused on scale and technology access. Dividend policy and selective debt financing sustain balance-sheet flexibility and liquidity buffers to support strategic moves.
R&D and product innovation
Core labs at LG drive advances in materials, OLED/QD displays, AI and connectivity, supported by KRW 1.2 trillion in R&D investment in 2024. Customer insights inform design priorities for performance, sustainability and usability, contributing to higher NPS in tested segments. Rapid prototyping and iterative testing cut time-to-market by up to 30%. Active standards participation ensures interoperability across ecosystems.
Manufacturing and supply chain orchestration
LG scales TV, appliance, component and material production across more than 70 global plants, applying lean practices to sustain throughput while supporting 2024 consolidated revenues of KRW 74.6 trillion. Supplier management balances cost, quality and resilience across a multi-thousand supplier base, with strategic dual-sourcing to cut disruption risk. Advanced forecasting and logistics trim inventory and lead times, improving turns and working capital. ESG sourcing and operations follow binding targets and supplier audits to ensure compliance.
Brand, marketing, and channel management
Unified branding elevates LG's premium positioning across appliances and TVs, driving higher ASPs; omnichannel campaigns convert awareness into sales with global e‑commerce at about 23% of retail in 2024 (Statista). Retail, carrier, and distributor programs increase shelf and bundled presence, while targeted pricing and promotions protect mix and margins.
- Brand premium: higher ASPs
- Omnichannel: 23% e‑commerce 2024
- Channels: retail/carrier/distributor
- Pricing: margin & mix management
Customer service and network operations
After-sales service sustains loyalty and lowers churn by offering repair networks, field technicians and remote diagnostics that increase device uptime; LG aligns telecom NOC operations to meet industry SLA targets (eg 99.9% availability) and reduce MTTR. Continuous feedback loops from service channels feed product and process improvements, supporting repeat purchases and warranty cost control.
- Repair network coverage: global service centers and field teams
- Telecom NOC: 99.9% availability target
- MTTR focus: industry benchmark <2 hours
- Feedback loop: service → product R&D
Capital shift to EV battery adjacencies and premium appliances; ROIC >10%
As a holding company LG allocates capital across electronics, chemicals and telecom, targeting ROIC >10% and shifted investment to EV battery adjacencies and premium appliances in 2024. Core labs led R&D of KRW 1.2 trillion in 2024 advancing OLED/QD, materials and AI; 70+ global plants supported KRW 74.6 trillion revenue. After-sales service and telecom NOC aim 99.9% availability and MTTR <2h.
| Metric | 2024 |
|---|---|
| Revenue | KRW 74.6 trillion |
| R&D | KRW 1.2 trillion |
| E‑commerce | 23% |
| Plants | 70+ |
| ROIC target | >10% |
| NOC SLA | 99.9% |
| MTTR | <2 hours |
Full Document Unlocks After Purchase
Business Model Canvas
The document you're previewing is the exact LG Business Model Canvas you'll receive after purchase. This preview is not a mockup—it's a direct snapshot of the final, editable file. Upon buying, you'll instantly download the same complete document, ready to edit, present, and apply.
Original: $10.00
-65%$10.00
$3.50Description
Unlock the strategic playbook: Business Model Canvas to scale value and monetize innovation
Unlock LG’s strategic playbook with our Business Model Canvas—three to five concise sections that reveal how LG creates value, scales operations, and monetizes innovation. Ideal for investors, consultants, and founders, the full downloadable Canvas (Word & Excel) delivers a section-by-section blueprint for benchmarking and strategic planning—get it to transform insight into action.
Partnerships
Strategic component and materials suppliers
LG relies on global suppliers for semiconductors, display panels, sensors, cathode/anode materials and specialty chemicals; in 2024 LG maintained multi-year procurement relationships to secure critical inputs. Long-term agreements lock volume, pricing and priority allocations in tight markets, while joint qualification and co-development programs boost performance and yield. Multi-sourcing across regions mitigates geopolitical and supply-chain risks.
Telecom infrastructure and regulatory partners
Network equipment vendors and tower companies enable LG Uplus 5G and FTTx rollout, with shared tower/RAN deals in 2024 cutting deployment capex by up to 40% per operator and accelerating site buildouts. Spectrum coordination with regulators secures coverage, capacity, and licence compliance critical for urban 5G and rural FTTx targets. Roaming and MVNO agreements expand reach cost-effectively, increasing service footprint without proportional capex. Shared infrastructure partnerships lower unit costs and speed time-to-market for new services.
Software, content, and platform ecosystems
LG’s webOS Smart TV and partner app stores (standard 70/30 storefront splits) plus licensing of major streamers enrich device value and retention. Cloud partners (AWS, Azure, GCP collectively >60% market share in 2024) enable OTT scale and firmware rollouts. Voice assistants, home-platform and AI partners deepen engagement through personalized UX. Joint roadmaps preserve feature parity, timely security updates and shared revenue incentives.
Automotive and industrial JV alliances
- Co-investment: risk-share, faster standards
- Supply contracts: 5–10 year terms
- Compliance: ISO 26262, UNECE R155/R157
Universities, labs, and startup ecosystems
External R&D partnerships with universities, national labs, and startup ecosystems accelerate breakthroughs in batteries, displays, AI, and biochemistry, while incubation and CVC investments create option value in emerging domains and new markets. IP co-creation and licensing strengthen technological defensibility and revenue streams, and structured talent pipelines from academia ensure skilled hires for future growth.
- R&D acceleration
- CVC option value
- IP co-creation
- Talent pipeline
Multi-year supply contracts and shared infra cut capex up to 40%
LG leverages multi-year supplier contracts (5–10 yr) and multi-sourcing to secure semiconductors, panels and EV modules; 2024 procurement emphasized priority allocations. Shared tower/RAN deals cut deployment capex by up to 40% and MVNO/roaming expand reach. WebOS app splits 70/30; cloud partners AWS/Azure/GCP >60% market share in 2024 support OTT scale.
| Metric | 2024 |
|---|---|
| Capex saving (shared infra) | up to 40% |
| App store split | 70/30 |
| Cloud partner market share | >60% |
| Supply contract length | 5–10 yrs |
What is included in the product
Detailed Word Document
A comprehensive, pre-written Business Model Canvas for LG covering customer segments, channels, value propositions, key activities, partners, revenue streams and cost structure, with SWOT-linked insights and a polished format for investors and analysts.
Customizable Excel Spreadsheet
Condenses LG's strategy into a digestible, editable one-page canvas that saves hours of structuring and is perfect for boardrooms or team collaboration.
Activities
Portfolio strategy and capital allocation
As a holding company, LG allocates capital across electronics, chemicals and telecom, prioritizing businesses that deliver ROIC above 10% and demonstrable synergies; in 2024 this shaped increased allocation to EV battery adjacencies and premium appliances. M&A, carve-outs and joint ventures are used to reweight the portfolio, with multiple transactions in 2024 focused on scale and technology access. Dividend policy and selective debt financing sustain balance-sheet flexibility and liquidity buffers to support strategic moves.
R&D and product innovation
Core labs at LG drive advances in materials, OLED/QD displays, AI and connectivity, supported by KRW 1.2 trillion in R&D investment in 2024. Customer insights inform design priorities for performance, sustainability and usability, contributing to higher NPS in tested segments. Rapid prototyping and iterative testing cut time-to-market by up to 30%. Active standards participation ensures interoperability across ecosystems.
Manufacturing and supply chain orchestration
LG scales TV, appliance, component and material production across more than 70 global plants, applying lean practices to sustain throughput while supporting 2024 consolidated revenues of KRW 74.6 trillion. Supplier management balances cost, quality and resilience across a multi-thousand supplier base, with strategic dual-sourcing to cut disruption risk. Advanced forecasting and logistics trim inventory and lead times, improving turns and working capital. ESG sourcing and operations follow binding targets and supplier audits to ensure compliance.
Brand, marketing, and channel management
Unified branding elevates LG's premium positioning across appliances and TVs, driving higher ASPs; omnichannel campaigns convert awareness into sales with global e‑commerce at about 23% of retail in 2024 (Statista). Retail, carrier, and distributor programs increase shelf and bundled presence, while targeted pricing and promotions protect mix and margins.
- Brand premium: higher ASPs
- Omnichannel: 23% e‑commerce 2024
- Channels: retail/carrier/distributor
- Pricing: margin & mix management
Customer service and network operations
After-sales service sustains loyalty and lowers churn by offering repair networks, field technicians and remote diagnostics that increase device uptime; LG aligns telecom NOC operations to meet industry SLA targets (eg 99.9% availability) and reduce MTTR. Continuous feedback loops from service channels feed product and process improvements, supporting repeat purchases and warranty cost control.
- Repair network coverage: global service centers and field teams
- Telecom NOC: 99.9% availability target
- MTTR focus: industry benchmark <2 hours
- Feedback loop: service → product R&D
Capital shift to EV battery adjacencies and premium appliances; ROIC >10%
As a holding company LG allocates capital across electronics, chemicals and telecom, targeting ROIC >10% and shifted investment to EV battery adjacencies and premium appliances in 2024. Core labs led R&D of KRW 1.2 trillion in 2024 advancing OLED/QD, materials and AI; 70+ global plants supported KRW 74.6 trillion revenue. After-sales service and telecom NOC aim 99.9% availability and MTTR <2h.
| Metric | 2024 |
|---|---|
| Revenue | KRW 74.6 trillion |
| R&D | KRW 1.2 trillion |
| E‑commerce | 23% |
| Plants | 70+ |
| ROIC target | >10% |
| NOC SLA | 99.9% |
| MTTR | <2 hours |
Full Document Unlocks After Purchase
Business Model Canvas
The document you're previewing is the exact LG Business Model Canvas you'll receive after purchase. This preview is not a mockup—it's a direct snapshot of the final, editable file. Upon buying, you'll instantly download the same complete document, ready to edit, present, and apply.











