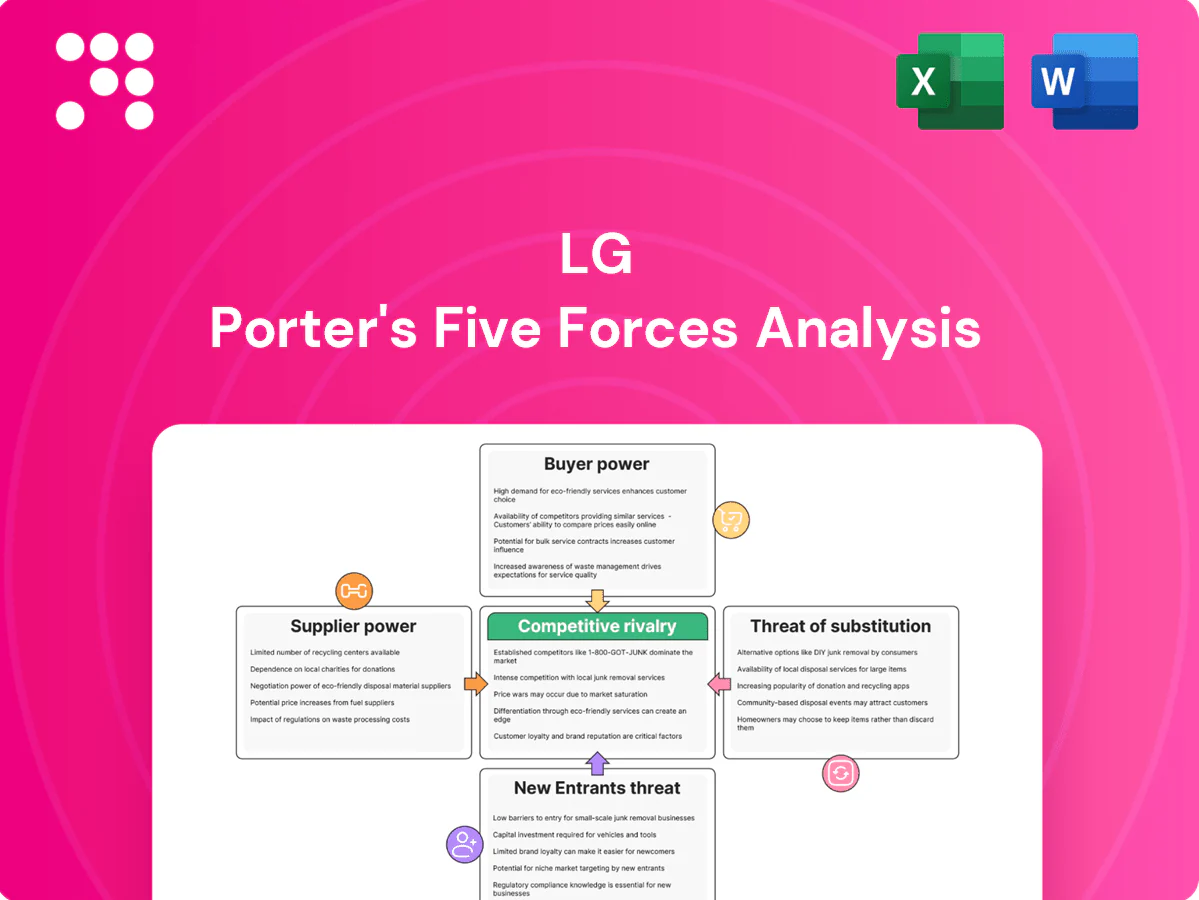
LG Porter's Five Forces Analysis

Don't Miss the Bigger Picture
LG faces varied competitive pressures—from supplier bargaining in components to intense rivalry across appliances, TVs and EV components—and shifting substitute threats as tech and brands converge. This snapshot outlines force interactions and strategic pain points, but surface-level nuances remain hidden. Unlock the full Porter's Five Forces Analysis to get force-by-force ratings, visuals and actionable strategy recommendations. Purchase the complete report for a consultant-grade, ready-to-use briefing.
Suppliers Bargaining Power

Advanced components
LG relies on specialized suppliers for semiconductors, displays, battery materials and rare earths, concentrating bargaining power. Qualification cycles and high switching costs keep approved vendors entrenched; TSMC held about 54% of foundry market share in 2023 and China produced 63% of rare earths in 2023. Supply tightness in chips and cathode materials can trigger pricing pressure and allocation risk; long-term contracts and dual-sourcing partly mitigate but do not eliminate supplier leverage.
Commodity volatility
Petrochemical feedstocks, metals and energy inputs expose LG Chem and LG Electronics to sharp swings—Brent averaged about $86/bbl in 2024 and copper roughly $9,300/t—leading suppliers to pass through cost rises quickly and compress margins in down-cycles. Hedging and scale purchasing reduce volatility but basis risk and contract lags persist. Regional energy price differentials (e.g., Asia LNG premia vs US gas) further shift cost curves and supplier clout.

Process IP and tooling
Equipment makers (lithography, deposition, automation) and proprietary process licensors concentrate power through unique IP—ASML controls over 90% of EUV lithography and EUV scanners run near $200m each—while custom tooling creates lock-in and 18–36 month lead times. Capacity additions require supplier cooperation and capex alignment; the global semiconductor equipment market was roughly $100bn in 2024, so dependency can delay ramps and shift value capture upstream.

Geopolitical concentration
Material and component supply chains are concentrated in East Asia and select mining geographies: TSMC ~54% global foundry share and China ~60–80% of rare earth processing and ~70% of battery precursor refining (2024). Trade controls, export restrictions and logistics shocks since 2020 have amplified supplier leverage. Localization, strategic stockpiles and nearshoring (CHIPS Act $52B; EU CRM rules) cut risk but take years to mature.
- Concentration: TSMC 54%
- Processing: China 60–80%
- Battery inputs: China ~70%
- Policy buffers: CHIPS $52B
ESG and compliance
Rising 2024 standards for cobalt, lithium and labor practices have narrowed LG’s approved supplier pool, making compliant suppliers more selective and boosting their pricing power. Growing audit and traceability demands lengthen switching times and raise compliance costs. LG’s integrated governance improves negotiation leverage, yet the compliant supplier base remains constrained.
Concentrated supplier power and commodity swings tighten margins for consumer electronics leaders
LG faces concentrated supplier power in semiconductors, displays, battery precursors and rare earths, raising switching costs and allocation risk; TSMC held ~54% foundry share (2023) and China dominated rare earths (~63% 2023). Input price swings (Brent ~$86/bbl in 2024; copper ~$9,300/t 2024) and proprietary equipment (ASML >90% EUV) compress margins despite hedging and nearshoring efforts.
| Supplier | Key stat | Impact |
|---|---|---|
| TSMC | ~54% foundry (2023) | High bargaining power |
| China rare earths | ~63% (2023) | Supply concentration |
| ASML | >90% EUV | Equipment lock-in |
| Energy/metal | Brent ~$86/bbl (2024) | Cost pass-through |
What is included in the product
 Detailed Word Document
Uncovers competitive drivers and market entry risks tailored to LG, evaluating supplier and buyer power, substitutes, new entrants, and rivalry while identifying disruptive threats and strategic levers to protect market share.

 Customizable Excel Spreadsheet
Clear one-sheet Porter’s Five Forces for LG that instantly visualizes competitive pressure via an editable spider chart and customizable force levels—perfect for quick deck-ready decisions. No macros, simple data swaps, and seamless integration with Excel dashboards or the companion Word report to relieve analysis bottlenecks.
Customers Bargaining Power

Retail consolidation
Big-box retailers, carriers and e-commerce platforms aggregate electronics demand, with Amazon holding roughly 38% of US e-commerce marketplace share in 2024, enabling tough pricing, slotting fees and promotional terms. Algorithmic merchandising and retailer private labels further compress margins and shelf visibility. LG offsets pressure by leveraging strong brand equity and expanding direct-to-consumer channels to rebalance its sales mix.
Informed consumers
Transparent online reviews and price-comparison tools mean 92% of consumers consult reviews in 2024, lowering search costs and sharpening price sensitivity; feature parity across TVs and appliances compresses margins as specs converge. Warranty/service expectations (over 60% cite service as decisive) and loyalty programs/ecosystem tie-ins (members spend ~20% more) moderate pure price bargaining.

Enterprise procurement
Enterprise procurement drives strong buyer leverage as industrial clients negotiate multi-year contracts, typically 3–5 years, for materials and network services; RFP-driven processes commoditize specs and shift focus to total cost of ownership. Volume-based discounts often exceed 10% and strict SLAs transfer performance risk to suppliers, while solution bundling and performance guarantees are used to defend margins.

Switching ease
Demand cyclicality
Macro slowdowns and elongated replacement cycles have made buyers more price-aggressive as firms face weaker demand following a 3.0% global GDP growth in 2024 (IMF); promotional peaks have reset consumer expectations for regular discounts, and inventory overhangs give buyers timing power to wait for markdowns; forecast collaboration and dynamic pricing are increasingly used to smooth this volatility.
- Demand cyclicality: buyers push harder on price
- 3.0% global GDP (IMF, 2024)
- Promotional peaks condition discount expectations
- Inventory overhangs = buyer timing power
- Forecast collaboration + dynamic pricing to reduce swings
Concentrated platforms compress margins; review-driven shoppers increase price sensitivity
Retailers and platforms (Amazon ~38% US e-commerce, 2024) and algorithmic merchandising concentrate bargaining power, compressing margins. Online reviews (92% consult, 2024) and feature parity raise price sensitivity, while warranties and loyalty programs limit pure price pressure. Enterprise RFPs and volume discounts (>10%) further strengthen buyers; replacement cycles ~3 years and trade-in ~25% accelerate churn.
| Metric | 2024 |
|---|---|
| Amazon US e‑commerce share | ~38% |
| Consumers consulting reviews | 92% |
| Replacement cycle | ~3 yrs |
| Trade‑in participation | ~25% |
Preview Before You Purchase
LG Porter's Five Forces Analysis
This LG Porter's Five Forces Analysis preview is the exact document you'll receive upon purchase—fully authored, formatted and complete. No placeholders or samples are shown. Buy and download to get this identical, ready-to-use file instantly.

Don't Miss the Bigger Picture
LG faces varied competitive pressures—from supplier bargaining in components to intense rivalry across appliances, TVs and EV components—and shifting substitute threats as tech and brands converge. This snapshot outlines force interactions and strategic pain points, but surface-level nuances remain hidden. Unlock the full Porter's Five Forces Analysis to get force-by-force ratings, visuals and actionable strategy recommendations. Purchase the complete report for a consultant-grade, ready-to-use briefing.
Suppliers Bargaining Power
Advanced components
LG relies on specialized suppliers for semiconductors, displays, battery materials and rare earths, concentrating bargaining power. Qualification cycles and high switching costs keep approved vendors entrenched; TSMC held about 54% of foundry market share in 2023 and China produced 63% of rare earths in 2023. Supply tightness in chips and cathode materials can trigger pricing pressure and allocation risk; long-term contracts and dual-sourcing partly mitigate but do not eliminate supplier leverage.
Commodity volatility
Petrochemical feedstocks, metals and energy inputs expose LG Chem and LG Electronics to sharp swings—Brent averaged about $86/bbl in 2024 and copper roughly $9,300/t—leading suppliers to pass through cost rises quickly and compress margins in down-cycles. Hedging and scale purchasing reduce volatility but basis risk and contract lags persist. Regional energy price differentials (e.g., Asia LNG premia vs US gas) further shift cost curves and supplier clout.
Process IP and tooling
Equipment makers (lithography, deposition, automation) and proprietary process licensors concentrate power through unique IP—ASML controls over 90% of EUV lithography and EUV scanners run near $200m each—while custom tooling creates lock-in and 18–36 month lead times. Capacity additions require supplier cooperation and capex alignment; the global semiconductor equipment market was roughly $100bn in 2024, so dependency can delay ramps and shift value capture upstream.
Geopolitical concentration
Material and component supply chains are concentrated in East Asia and select mining geographies: TSMC ~54% global foundry share and China ~60–80% of rare earth processing and ~70% of battery precursor refining (2024). Trade controls, export restrictions and logistics shocks since 2020 have amplified supplier leverage. Localization, strategic stockpiles and nearshoring (CHIPS Act $52B; EU CRM rules) cut risk but take years to mature.
- Concentration: TSMC 54%
- Processing: China 60–80%
- Battery inputs: China ~70%
- Policy buffers: CHIPS $52B
ESG and compliance
Rising 2024 standards for cobalt, lithium and labor practices have narrowed LG’s approved supplier pool, making compliant suppliers more selective and boosting their pricing power. Growing audit and traceability demands lengthen switching times and raise compliance costs. LG’s integrated governance improves negotiation leverage, yet the compliant supplier base remains constrained.
Concentrated supplier power and commodity swings tighten margins for consumer electronics leaders
LG faces concentrated supplier power in semiconductors, displays, battery precursors and rare earths, raising switching costs and allocation risk; TSMC held ~54% foundry share (2023) and China dominated rare earths (~63% 2023). Input price swings (Brent ~$86/bbl in 2024; copper ~$9,300/t 2024) and proprietary equipment (ASML >90% EUV) compress margins despite hedging and nearshoring efforts.
| Supplier | Key stat | Impact |
|---|---|---|
| TSMC | ~54% foundry (2023) | High bargaining power |
| China rare earths | ~63% (2023) | Supply concentration |
| ASML | >90% EUV | Equipment lock-in |
| Energy/metal | Brent ~$86/bbl (2024) | Cost pass-through |
What is included in the product
Detailed Word Document
Uncovers competitive drivers and market entry risks tailored to LG, evaluating supplier and buyer power, substitutes, new entrants, and rivalry while identifying disruptive threats and strategic levers to protect market share.
Customizable Excel Spreadsheet
Clear one-sheet Porter’s Five Forces for LG that instantly visualizes competitive pressure via an editable spider chart and customizable force levels—perfect for quick deck-ready decisions. No macros, simple data swaps, and seamless integration with Excel dashboards or the companion Word report to relieve analysis bottlenecks.
Customers Bargaining Power
Retail consolidation
Big-box retailers, carriers and e-commerce platforms aggregate electronics demand, with Amazon holding roughly 38% of US e-commerce marketplace share in 2024, enabling tough pricing, slotting fees and promotional terms. Algorithmic merchandising and retailer private labels further compress margins and shelf visibility. LG offsets pressure by leveraging strong brand equity and expanding direct-to-consumer channels to rebalance its sales mix.
Informed consumers
Transparent online reviews and price-comparison tools mean 92% of consumers consult reviews in 2024, lowering search costs and sharpening price sensitivity; feature parity across TVs and appliances compresses margins as specs converge. Warranty/service expectations (over 60% cite service as decisive) and loyalty programs/ecosystem tie-ins (members spend ~20% more) moderate pure price bargaining.
Enterprise procurement
Enterprise procurement drives strong buyer leverage as industrial clients negotiate multi-year contracts, typically 3–5 years, for materials and network services; RFP-driven processes commoditize specs and shift focus to total cost of ownership. Volume-based discounts often exceed 10% and strict SLAs transfer performance risk to suppliers, while solution bundling and performance guarantees are used to defend margins.
Switching ease
Demand cyclicality
Macro slowdowns and elongated replacement cycles have made buyers more price-aggressive as firms face weaker demand following a 3.0% global GDP growth in 2024 (IMF); promotional peaks have reset consumer expectations for regular discounts, and inventory overhangs give buyers timing power to wait for markdowns; forecast collaboration and dynamic pricing are increasingly used to smooth this volatility.
- Demand cyclicality: buyers push harder on price
- 3.0% global GDP (IMF, 2024)
- Promotional peaks condition discount expectations
- Inventory overhangs = buyer timing power
- Forecast collaboration + dynamic pricing to reduce swings
Concentrated platforms compress margins; review-driven shoppers increase price sensitivity
Retailers and platforms (Amazon ~38% US e-commerce, 2024) and algorithmic merchandising concentrate bargaining power, compressing margins. Online reviews (92% consult, 2024) and feature parity raise price sensitivity, while warranties and loyalty programs limit pure price pressure. Enterprise RFPs and volume discounts (>10%) further strengthen buyers; replacement cycles ~3 years and trade-in ~25% accelerate churn.
| Metric | 2024 |
|---|---|
| Amazon US e‑commerce share | ~38% |
| Consumers consulting reviews | 92% |
| Replacement cycle | ~3 yrs |
| Trade‑in participation | ~25% |
Preview Before You Purchase
LG Porter's Five Forces Analysis
This LG Porter's Five Forces Analysis preview is the exact document you'll receive upon purchase—fully authored, formatted and complete. No placeholders or samples are shown. Buy and download to get this identical, ready-to-use file instantly.
Original: $10.00
-65%$10.00
$3.50Description
Don't Miss the Bigger Picture
LG faces varied competitive pressures—from supplier bargaining in components to intense rivalry across appliances, TVs and EV components—and shifting substitute threats as tech and brands converge. This snapshot outlines force interactions and strategic pain points, but surface-level nuances remain hidden. Unlock the full Porter's Five Forces Analysis to get force-by-force ratings, visuals and actionable strategy recommendations. Purchase the complete report for a consultant-grade, ready-to-use briefing.
Suppliers Bargaining Power
Advanced components
LG relies on specialized suppliers for semiconductors, displays, battery materials and rare earths, concentrating bargaining power. Qualification cycles and high switching costs keep approved vendors entrenched; TSMC held about 54% of foundry market share in 2023 and China produced 63% of rare earths in 2023. Supply tightness in chips and cathode materials can trigger pricing pressure and allocation risk; long-term contracts and dual-sourcing partly mitigate but do not eliminate supplier leverage.
Commodity volatility
Petrochemical feedstocks, metals and energy inputs expose LG Chem and LG Electronics to sharp swings—Brent averaged about $86/bbl in 2024 and copper roughly $9,300/t—leading suppliers to pass through cost rises quickly and compress margins in down-cycles. Hedging and scale purchasing reduce volatility but basis risk and contract lags persist. Regional energy price differentials (e.g., Asia LNG premia vs US gas) further shift cost curves and supplier clout.
Process IP and tooling
Equipment makers (lithography, deposition, automation) and proprietary process licensors concentrate power through unique IP—ASML controls over 90% of EUV lithography and EUV scanners run near $200m each—while custom tooling creates lock-in and 18–36 month lead times. Capacity additions require supplier cooperation and capex alignment; the global semiconductor equipment market was roughly $100bn in 2024, so dependency can delay ramps and shift value capture upstream.
Geopolitical concentration
Material and component supply chains are concentrated in East Asia and select mining geographies: TSMC ~54% global foundry share and China ~60–80% of rare earth processing and ~70% of battery precursor refining (2024). Trade controls, export restrictions and logistics shocks since 2020 have amplified supplier leverage. Localization, strategic stockpiles and nearshoring (CHIPS Act $52B; EU CRM rules) cut risk but take years to mature.
- Concentration: TSMC 54%
- Processing: China 60–80%
- Battery inputs: China ~70%
- Policy buffers: CHIPS $52B
ESG and compliance
Rising 2024 standards for cobalt, lithium and labor practices have narrowed LG’s approved supplier pool, making compliant suppliers more selective and boosting their pricing power. Growing audit and traceability demands lengthen switching times and raise compliance costs. LG’s integrated governance improves negotiation leverage, yet the compliant supplier base remains constrained.
Concentrated supplier power and commodity swings tighten margins for consumer electronics leaders
LG faces concentrated supplier power in semiconductors, displays, battery precursors and rare earths, raising switching costs and allocation risk; TSMC held ~54% foundry share (2023) and China dominated rare earths (~63% 2023). Input price swings (Brent ~$86/bbl in 2024; copper ~$9,300/t 2024) and proprietary equipment (ASML >90% EUV) compress margins despite hedging and nearshoring efforts.
| Supplier | Key stat | Impact |
|---|---|---|
| TSMC | ~54% foundry (2023) | High bargaining power |
| China rare earths | ~63% (2023) | Supply concentration |
| ASML | >90% EUV | Equipment lock-in |
| Energy/metal | Brent ~$86/bbl (2024) | Cost pass-through |
What is included in the product
Detailed Word Document
Uncovers competitive drivers and market entry risks tailored to LG, evaluating supplier and buyer power, substitutes, new entrants, and rivalry while identifying disruptive threats and strategic levers to protect market share.
Customizable Excel Spreadsheet
Clear one-sheet Porter’s Five Forces for LG that instantly visualizes competitive pressure via an editable spider chart and customizable force levels—perfect for quick deck-ready decisions. No macros, simple data swaps, and seamless integration with Excel dashboards or the companion Word report to relieve analysis bottlenecks.
Customers Bargaining Power
Retail consolidation
Big-box retailers, carriers and e-commerce platforms aggregate electronics demand, with Amazon holding roughly 38% of US e-commerce marketplace share in 2024, enabling tough pricing, slotting fees and promotional terms. Algorithmic merchandising and retailer private labels further compress margins and shelf visibility. LG offsets pressure by leveraging strong brand equity and expanding direct-to-consumer channels to rebalance its sales mix.
Informed consumers
Transparent online reviews and price-comparison tools mean 92% of consumers consult reviews in 2024, lowering search costs and sharpening price sensitivity; feature parity across TVs and appliances compresses margins as specs converge. Warranty/service expectations (over 60% cite service as decisive) and loyalty programs/ecosystem tie-ins (members spend ~20% more) moderate pure price bargaining.
Enterprise procurement
Enterprise procurement drives strong buyer leverage as industrial clients negotiate multi-year contracts, typically 3–5 years, for materials and network services; RFP-driven processes commoditize specs and shift focus to total cost of ownership. Volume-based discounts often exceed 10% and strict SLAs transfer performance risk to suppliers, while solution bundling and performance guarantees are used to defend margins.
Switching ease
Demand cyclicality
Macro slowdowns and elongated replacement cycles have made buyers more price-aggressive as firms face weaker demand following a 3.0% global GDP growth in 2024 (IMF); promotional peaks have reset consumer expectations for regular discounts, and inventory overhangs give buyers timing power to wait for markdowns; forecast collaboration and dynamic pricing are increasingly used to smooth this volatility.
- Demand cyclicality: buyers push harder on price
- 3.0% global GDP (IMF, 2024)
- Promotional peaks condition discount expectations
- Inventory overhangs = buyer timing power
- Forecast collaboration + dynamic pricing to reduce swings
Concentrated platforms compress margins; review-driven shoppers increase price sensitivity
Retailers and platforms (Amazon ~38% US e-commerce, 2024) and algorithmic merchandising concentrate bargaining power, compressing margins. Online reviews (92% consult, 2024) and feature parity raise price sensitivity, while warranties and loyalty programs limit pure price pressure. Enterprise RFPs and volume discounts (>10%) further strengthen buyers; replacement cycles ~3 years and trade-in ~25% accelerate churn.
| Metric | 2024 |
|---|---|
| Amazon US e‑commerce share | ~38% |
| Consumers consulting reviews | 92% |
| Replacement cycle | ~3 yrs |
| Trade‑in participation | ~25% |
Preview Before You Purchase
LG Porter's Five Forces Analysis
This LG Porter's Five Forces Analysis preview is the exact document you'll receive upon purchase—fully authored, formatted and complete. No placeholders or samples are shown. Buy and download to get this identical, ready-to-use file instantly.











