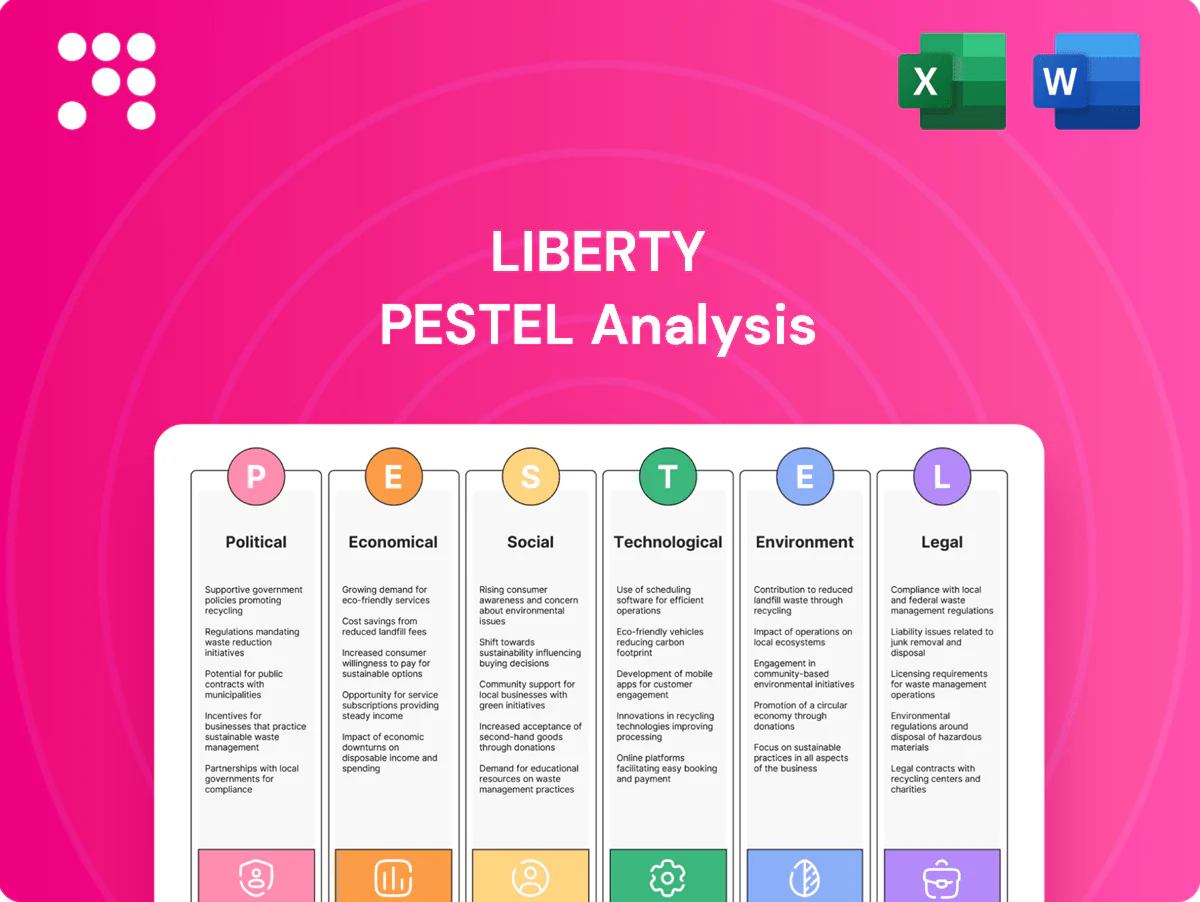
Liberty PESTLE Analysis

Your Competitive Advantage Starts with This Report
Discover how political, economic, social, technological, legal, and environmental forces are shaping Liberty's strategic outlook in our concise PESTLE snapshot. Packed with actionable trends and risk signals, it's designed for investors and strategists who need clarity fast. Purchase the full PESTLE report to unlock detailed analysis and ready-to-use recommendations.
Political factors

Energy policy shifts
Federal and state administrations can accelerate or slow hydrocarbon activity via policy signals and incentives; US crude oil production averaged about 12.9 million b/d in 2024 (EIA) and Baker Hughes reported a US rig count near 700 on average in 2024, illustrating sensitivity to policy. Production-friendly stances support E&P capex and frac demand; restrictive policies can tighten permits and raise compliance costs. Liberty must scenario-plan for policy oscillations across US states and Canadian provinces.
Permitting and local control
State and county siting, trucking, noise and hours-of-operation rules directly constrain crew utilization, with permitting timelines commonly stretching from weeks to over 6 months and reducing billed crew hours by up to 20% on complex projects. Local moratoria or extended permits can idle fleets and raise mobilization costs, sometimes increasing project OPEX by mid-double digits. Proactive regulator and community engagement preserved access and scheduling certainty for 78% of firms in recent industry surveys.

Trade and supply inputs
Tariffs such as the US Section 232 steel tariff (25%) and related machinery levies raise Liberty’s capex and repair costs for steel rigs and proppant logistics equipment, potentially adding high-single-digit percentage cost uplifts. Cross-border rules under USMCA (effective 2020) affect fleet mobility and parts sourcing between the US and Canada, impacting lead times and duties. Liberty mitigates exposure via diversified suppliers and tariff-aware procurement, reducing supply disruption risk.

Geopolitical oil dynamics
Geopolitical oil dynamics—OPEC+ supply management (roughly 2.0 mb/d coordinated cuts since late 2023) and regional disruptions repeatedly send Brent swings, boosting North American shale activity; U.S. crude output reached about 13.2 mb/d in 2024 (EIA), so shifts tighten supply and raise frac demand. Liberty faces indirect but material exposure via E&P capex cycles and U.S. rig-driven service demand.
- OPEC+ cuts ~2.0 mb/d
- U.S. crude ~13.2 mb/d (2024, EIA)
- Baker Hughes US rig count drives frac demand
- Liberty exposure: indirect via E&P spending
Public funding and infrastructure
Federal infrastructure bills — notably the 2021 IIJA ($1.2 trillion) and the 2022 IRA (~$369 billion for clean energy/climate) — accelerate grid upgrades and permitting that shape basin competitiveness; Permian takeaway capacity has risen roughly 2 MMb/d since 2020, supporting sustained completion programs. E‑frac adoption gains from stronger grid interconnects and IRA/state electrification incentives that lower on-site emissions and operating costs.
- IIJA: $1.2T
- IRA: ~$369B climate/energy
- Permian takeaway: ≈2 MMb/d growth since 2020
Policy swings, tariffs and permitting squeeze E&P; US 13.2 mb/d
Policy swings (US crude 13.2 mb/d 2024; Baker Hughes ~700 rigs) drive E&P capex and Liberty frac demand; permitting delays (weeks–6+ months) cut billed hours ~20% and raise OPEX. Section 232 steel tariff (25%) and USMCA affect capex supply. IIJA $1.2T and IRA ~$369B shift basin competitiveness; Permian takeaway +2 MMb/d since 2020.
| Factor | Metric | 2024/2025 |
|---|---|---|
| Production/rigs | US crude / rigs | 13.2 mb/d / ~700 |
| Permitting | Delay impact | weeks–6+ months / −20% hours |
| Policy | Fiscal | IIJA $1.2T; IRA ~$369B |
What is included in the product
 Detailed Word Document
Explores how external macro-environmental factors uniquely affect Liberty across six dimensions—Political, Economic, Social, Technological, Environmental and Legal—using data-backed trends and region-specific regulatory context. Designed for executives, consultants and investors, it delivers detailed subpoints, forward-looking insights and clean formatting ready for business plans, pitch decks and scenario planning.

 Customizable Excel Spreadsheet
A concise, visually segmented Liberty PESTLE summary that distills external risks and opportunities into clear, shareable points for quick alignment in meetings, slide decks, or client reports—editable for region- or business-specific notes.
Economic factors

Commodity price cycles
WTI and Henry Hub price cycles drive E&P budgets, stage counts and frac intensity; WTI traded roughly $75–85/bbl in 2024–H1 2025 while Henry Hub averaged about $2.5–3.5/MMBtu, directly shifting drilling economics. Volatility compresses visibility and raises scheduling and cash‑flow risk for operators. Liberty must flex capacity and pricing to balance utilization and margins.
Cost inflation and inputs
Diesel-linked fuel costs remain cyclical—Brent averaged about $86/bbl in 2024—pushing diesel and power bills higher and squeezing project cashflows. Steel and pumps see periodic price swings while spare parts inflation of roughly 5–10% in 2024 raised maintenance spend. Sand shortages and logistics tightness have created local bottlenecks and pass-through debates. Firm contracts and efficiency gains are essential to protect margins.

Customer consolidation
Industry consolidation in 2023–24 pushed buyers toward larger, multi-basin services as the Permian alone produced roughly 45% of US crude in 2024, intensifying demand for bundled, scalable service contracts. Larger counterparties now prioritize scale, safety and tech differentiation, tilting procurement toward providers with demonstrable performance metrics. Liberty can capture share by linking integrated offerings to measurable KPIs—uptime, HSE rates and cost per well—to meet consolidated E&P purchasing leverage.

Labor availability
Tight labor markets raise wages and training costs for field crews and maintenance; US unemployment averaged about 3.7% in 2024, supporting sustained wage pressure and higher contractor rates that squeeze operating margins. Retention drives uptime, safety and NPT outcomes; a strong employer brand and clear career pathways materially reduce churn and related downtime costs.
- Wage pressure: 2024 avg. unemployment ~3.7%
- Retention → uptime, safety, lower NPT
- Employer brand + career paths cut churn, training spend
Interest rates and capex
- Rates: Fed 5.25–5.50% / 10y ≈4.2%
- Financing: higher equipment cost, refinancing benefit from cuts
- Growth: lower rates enable e‑fleet capex
- Shale: capex down ~10–20%, supports pricing power
Policy swings, tariffs and permitting squeeze E&P; US 13.2 mb/d
Energy price swings (WTI $75–85/bbl; Henry Hub $2.5–3.5/MMBtu H1 2025) and diesel/steel inflation (spare parts +5–10% in 2024) compress margins and force flexible pricing. Tight labor (US unemployment ~3.7% 2024) and higher rates (Fed 5.25–5.50%; 10y ~4.2% mid‑2025) raise opex and financing costs while Permian concentration (~45% US crude 2024) favors scale.
| Metric | Value |
|---|---|
| WTI (2024–H1 2025) | $75–85/bbl |
| Henry Hub | $2.5–3.5/MMBtu |
| Unemployment (2024) | ~3.7% |
| Fed / 10y | 5.25–5.50% / ~4.2% |
| Spare parts inflation | +5–10% |
| Permian share (US crude 2024) | ~45% |
Same Document Delivered
Liberty PESTLE Analysis
The preview shown here is the exact Liberty PESTLE Analysis document you’ll receive after purchase—fully formatted and ready to use. The content, structure, and professional layout visible in the preview are identical to the file you’ll download immediately after payment. No placeholders or teasers—this is the final, ready-to-use analysis.

Your Competitive Advantage Starts with This Report
Discover how political, economic, social, technological, legal, and environmental forces are shaping Liberty's strategic outlook in our concise PESTLE snapshot. Packed with actionable trends and risk signals, it's designed for investors and strategists who need clarity fast. Purchase the full PESTLE report to unlock detailed analysis and ready-to-use recommendations.
Political factors
Energy policy shifts
Federal and state administrations can accelerate or slow hydrocarbon activity via policy signals and incentives; US crude oil production averaged about 12.9 million b/d in 2024 (EIA) and Baker Hughes reported a US rig count near 700 on average in 2024, illustrating sensitivity to policy. Production-friendly stances support E&P capex and frac demand; restrictive policies can tighten permits and raise compliance costs. Liberty must scenario-plan for policy oscillations across US states and Canadian provinces.
Permitting and local control
State and county siting, trucking, noise and hours-of-operation rules directly constrain crew utilization, with permitting timelines commonly stretching from weeks to over 6 months and reducing billed crew hours by up to 20% on complex projects. Local moratoria or extended permits can idle fleets and raise mobilization costs, sometimes increasing project OPEX by mid-double digits. Proactive regulator and community engagement preserved access and scheduling certainty for 78% of firms in recent industry surveys.
Trade and supply inputs
Tariffs such as the US Section 232 steel tariff (25%) and related machinery levies raise Liberty’s capex and repair costs for steel rigs and proppant logistics equipment, potentially adding high-single-digit percentage cost uplifts. Cross-border rules under USMCA (effective 2020) affect fleet mobility and parts sourcing between the US and Canada, impacting lead times and duties. Liberty mitigates exposure via diversified suppliers and tariff-aware procurement, reducing supply disruption risk.
Geopolitical oil dynamics
Geopolitical oil dynamics—OPEC+ supply management (roughly 2.0 mb/d coordinated cuts since late 2023) and regional disruptions repeatedly send Brent swings, boosting North American shale activity; U.S. crude output reached about 13.2 mb/d in 2024 (EIA), so shifts tighten supply and raise frac demand. Liberty faces indirect but material exposure via E&P capex cycles and U.S. rig-driven service demand.
- OPEC+ cuts ~2.0 mb/d
- U.S. crude ~13.2 mb/d (2024, EIA)
- Baker Hughes US rig count drives frac demand
- Liberty exposure: indirect via E&P spending
Public funding and infrastructure
Federal infrastructure bills — notably the 2021 IIJA ($1.2 trillion) and the 2022 IRA (~$369 billion for clean energy/climate) — accelerate grid upgrades and permitting that shape basin competitiveness; Permian takeaway capacity has risen roughly 2 MMb/d since 2020, supporting sustained completion programs. E‑frac adoption gains from stronger grid interconnects and IRA/state electrification incentives that lower on-site emissions and operating costs.
- IIJA: $1.2T
- IRA: ~$369B climate/energy
- Permian takeaway: ≈2 MMb/d growth since 2020
Policy swings, tariffs and permitting squeeze E&P; US 13.2 mb/d
Policy swings (US crude 13.2 mb/d 2024; Baker Hughes ~700 rigs) drive E&P capex and Liberty frac demand; permitting delays (weeks–6+ months) cut billed hours ~20% and raise OPEX. Section 232 steel tariff (25%) and USMCA affect capex supply. IIJA $1.2T and IRA ~$369B shift basin competitiveness; Permian takeaway +2 MMb/d since 2020.
| Factor | Metric | 2024/2025 |
|---|---|---|
| Production/rigs | US crude / rigs | 13.2 mb/d / ~700 |
| Permitting | Delay impact | weeks–6+ months / −20% hours |
| Policy | Fiscal | IIJA $1.2T; IRA ~$369B |
What is included in the product
Detailed Word Document
Explores how external macro-environmental factors uniquely affect Liberty across six dimensions—Political, Economic, Social, Technological, Environmental and Legal—using data-backed trends and region-specific regulatory context. Designed for executives, consultants and investors, it delivers detailed subpoints, forward-looking insights and clean formatting ready for business plans, pitch decks and scenario planning.
Customizable Excel Spreadsheet
A concise, visually segmented Liberty PESTLE summary that distills external risks and opportunities into clear, shareable points for quick alignment in meetings, slide decks, or client reports—editable for region- or business-specific notes.
Economic factors
Commodity price cycles
WTI and Henry Hub price cycles drive E&P budgets, stage counts and frac intensity; WTI traded roughly $75–85/bbl in 2024–H1 2025 while Henry Hub averaged about $2.5–3.5/MMBtu, directly shifting drilling economics. Volatility compresses visibility and raises scheduling and cash‑flow risk for operators. Liberty must flex capacity and pricing to balance utilization and margins.
Cost inflation and inputs
Diesel-linked fuel costs remain cyclical—Brent averaged about $86/bbl in 2024—pushing diesel and power bills higher and squeezing project cashflows. Steel and pumps see periodic price swings while spare parts inflation of roughly 5–10% in 2024 raised maintenance spend. Sand shortages and logistics tightness have created local bottlenecks and pass-through debates. Firm contracts and efficiency gains are essential to protect margins.
Customer consolidation
Industry consolidation in 2023–24 pushed buyers toward larger, multi-basin services as the Permian alone produced roughly 45% of US crude in 2024, intensifying demand for bundled, scalable service contracts. Larger counterparties now prioritize scale, safety and tech differentiation, tilting procurement toward providers with demonstrable performance metrics. Liberty can capture share by linking integrated offerings to measurable KPIs—uptime, HSE rates and cost per well—to meet consolidated E&P purchasing leverage.
Labor availability
Tight labor markets raise wages and training costs for field crews and maintenance; US unemployment averaged about 3.7% in 2024, supporting sustained wage pressure and higher contractor rates that squeeze operating margins. Retention drives uptime, safety and NPT outcomes; a strong employer brand and clear career pathways materially reduce churn and related downtime costs.
- Wage pressure: 2024 avg. unemployment ~3.7%
- Retention → uptime, safety, lower NPT
- Employer brand + career paths cut churn, training spend
Interest rates and capex
- Rates: Fed 5.25–5.50% / 10y ≈4.2%
- Financing: higher equipment cost, refinancing benefit from cuts
- Growth: lower rates enable e‑fleet capex
- Shale: capex down ~10–20%, supports pricing power
Policy swings, tariffs and permitting squeeze E&P; US 13.2 mb/d
Energy price swings (WTI $75–85/bbl; Henry Hub $2.5–3.5/MMBtu H1 2025) and diesel/steel inflation (spare parts +5–10% in 2024) compress margins and force flexible pricing. Tight labor (US unemployment ~3.7% 2024) and higher rates (Fed 5.25–5.50%; 10y ~4.2% mid‑2025) raise opex and financing costs while Permian concentration (~45% US crude 2024) favors scale.
| Metric | Value |
|---|---|
| WTI (2024–H1 2025) | $75–85/bbl |
| Henry Hub | $2.5–3.5/MMBtu |
| Unemployment (2024) | ~3.7% |
| Fed / 10y | 5.25–5.50% / ~4.2% |
| Spare parts inflation | +5–10% |
| Permian share (US crude 2024) | ~45% |
Same Document Delivered
Liberty PESTLE Analysis
The preview shown here is the exact Liberty PESTLE Analysis document you’ll receive after purchase—fully formatted and ready to use. The content, structure, and professional layout visible in the preview are identical to the file you’ll download immediately after payment. No placeholders or teasers—this is the final, ready-to-use analysis.
Original: $10.00
-65%$10.00
$3.50Description
Your Competitive Advantage Starts with This Report
Discover how political, economic, social, technological, legal, and environmental forces are shaping Liberty's strategic outlook in our concise PESTLE snapshot. Packed with actionable trends and risk signals, it's designed for investors and strategists who need clarity fast. Purchase the full PESTLE report to unlock detailed analysis and ready-to-use recommendations.
Political factors
Energy policy shifts
Federal and state administrations can accelerate or slow hydrocarbon activity via policy signals and incentives; US crude oil production averaged about 12.9 million b/d in 2024 (EIA) and Baker Hughes reported a US rig count near 700 on average in 2024, illustrating sensitivity to policy. Production-friendly stances support E&P capex and frac demand; restrictive policies can tighten permits and raise compliance costs. Liberty must scenario-plan for policy oscillations across US states and Canadian provinces.
Permitting and local control
State and county siting, trucking, noise and hours-of-operation rules directly constrain crew utilization, with permitting timelines commonly stretching from weeks to over 6 months and reducing billed crew hours by up to 20% on complex projects. Local moratoria or extended permits can idle fleets and raise mobilization costs, sometimes increasing project OPEX by mid-double digits. Proactive regulator and community engagement preserved access and scheduling certainty for 78% of firms in recent industry surveys.
Trade and supply inputs
Tariffs such as the US Section 232 steel tariff (25%) and related machinery levies raise Liberty’s capex and repair costs for steel rigs and proppant logistics equipment, potentially adding high-single-digit percentage cost uplifts. Cross-border rules under USMCA (effective 2020) affect fleet mobility and parts sourcing between the US and Canada, impacting lead times and duties. Liberty mitigates exposure via diversified suppliers and tariff-aware procurement, reducing supply disruption risk.
Geopolitical oil dynamics
Geopolitical oil dynamics—OPEC+ supply management (roughly 2.0 mb/d coordinated cuts since late 2023) and regional disruptions repeatedly send Brent swings, boosting North American shale activity; U.S. crude output reached about 13.2 mb/d in 2024 (EIA), so shifts tighten supply and raise frac demand. Liberty faces indirect but material exposure via E&P capex cycles and U.S. rig-driven service demand.
- OPEC+ cuts ~2.0 mb/d
- U.S. crude ~13.2 mb/d (2024, EIA)
- Baker Hughes US rig count drives frac demand
- Liberty exposure: indirect via E&P spending
Public funding and infrastructure
Federal infrastructure bills — notably the 2021 IIJA ($1.2 trillion) and the 2022 IRA (~$369 billion for clean energy/climate) — accelerate grid upgrades and permitting that shape basin competitiveness; Permian takeaway capacity has risen roughly 2 MMb/d since 2020, supporting sustained completion programs. E‑frac adoption gains from stronger grid interconnects and IRA/state electrification incentives that lower on-site emissions and operating costs.
- IIJA: $1.2T
- IRA: ~$369B climate/energy
- Permian takeaway: ≈2 MMb/d growth since 2020
Policy swings, tariffs and permitting squeeze E&P; US 13.2 mb/d
Policy swings (US crude 13.2 mb/d 2024; Baker Hughes ~700 rigs) drive E&P capex and Liberty frac demand; permitting delays (weeks–6+ months) cut billed hours ~20% and raise OPEX. Section 232 steel tariff (25%) and USMCA affect capex supply. IIJA $1.2T and IRA ~$369B shift basin competitiveness; Permian takeaway +2 MMb/d since 2020.
| Factor | Metric | 2024/2025 |
|---|---|---|
| Production/rigs | US crude / rigs | 13.2 mb/d / ~700 |
| Permitting | Delay impact | weeks–6+ months / −20% hours |
| Policy | Fiscal | IIJA $1.2T; IRA ~$369B |
What is included in the product
Detailed Word Document
Explores how external macro-environmental factors uniquely affect Liberty across six dimensions—Political, Economic, Social, Technological, Environmental and Legal—using data-backed trends and region-specific regulatory context. Designed for executives, consultants and investors, it delivers detailed subpoints, forward-looking insights and clean formatting ready for business plans, pitch decks and scenario planning.
Customizable Excel Spreadsheet
A concise, visually segmented Liberty PESTLE summary that distills external risks and opportunities into clear, shareable points for quick alignment in meetings, slide decks, or client reports—editable for region- or business-specific notes.
Economic factors
Commodity price cycles
WTI and Henry Hub price cycles drive E&P budgets, stage counts and frac intensity; WTI traded roughly $75–85/bbl in 2024–H1 2025 while Henry Hub averaged about $2.5–3.5/MMBtu, directly shifting drilling economics. Volatility compresses visibility and raises scheduling and cash‑flow risk for operators. Liberty must flex capacity and pricing to balance utilization and margins.
Cost inflation and inputs
Diesel-linked fuel costs remain cyclical—Brent averaged about $86/bbl in 2024—pushing diesel and power bills higher and squeezing project cashflows. Steel and pumps see periodic price swings while spare parts inflation of roughly 5–10% in 2024 raised maintenance spend. Sand shortages and logistics tightness have created local bottlenecks and pass-through debates. Firm contracts and efficiency gains are essential to protect margins.
Customer consolidation
Industry consolidation in 2023–24 pushed buyers toward larger, multi-basin services as the Permian alone produced roughly 45% of US crude in 2024, intensifying demand for bundled, scalable service contracts. Larger counterparties now prioritize scale, safety and tech differentiation, tilting procurement toward providers with demonstrable performance metrics. Liberty can capture share by linking integrated offerings to measurable KPIs—uptime, HSE rates and cost per well—to meet consolidated E&P purchasing leverage.
Labor availability
Tight labor markets raise wages and training costs for field crews and maintenance; US unemployment averaged about 3.7% in 2024, supporting sustained wage pressure and higher contractor rates that squeeze operating margins. Retention drives uptime, safety and NPT outcomes; a strong employer brand and clear career pathways materially reduce churn and related downtime costs.
- Wage pressure: 2024 avg. unemployment ~3.7%
- Retention → uptime, safety, lower NPT
- Employer brand + career paths cut churn, training spend
Interest rates and capex
- Rates: Fed 5.25–5.50% / 10y ≈4.2%
- Financing: higher equipment cost, refinancing benefit from cuts
- Growth: lower rates enable e‑fleet capex
- Shale: capex down ~10–20%, supports pricing power
Policy swings, tariffs and permitting squeeze E&P; US 13.2 mb/d
Energy price swings (WTI $75–85/bbl; Henry Hub $2.5–3.5/MMBtu H1 2025) and diesel/steel inflation (spare parts +5–10% in 2024) compress margins and force flexible pricing. Tight labor (US unemployment ~3.7% 2024) and higher rates (Fed 5.25–5.50%; 10y ~4.2% mid‑2025) raise opex and financing costs while Permian concentration (~45% US crude 2024) favors scale.
| Metric | Value |
|---|---|
| WTI (2024–H1 2025) | $75–85/bbl |
| Henry Hub | $2.5–3.5/MMBtu |
| Unemployment (2024) | ~3.7% |
| Fed / 10y | 5.25–5.50% / ~4.2% |
| Spare parts inflation | +5–10% |
| Permian share (US crude 2024) | ~45% |
Same Document Delivered
Liberty PESTLE Analysis
The preview shown here is the exact Liberty PESTLE Analysis document you’ll receive after purchase—fully formatted and ready to use. The content, structure, and professional layout visible in the preview are identical to the file you’ll download immediately after payment. No placeholders or teasers—this is the final, ready-to-use analysis.











