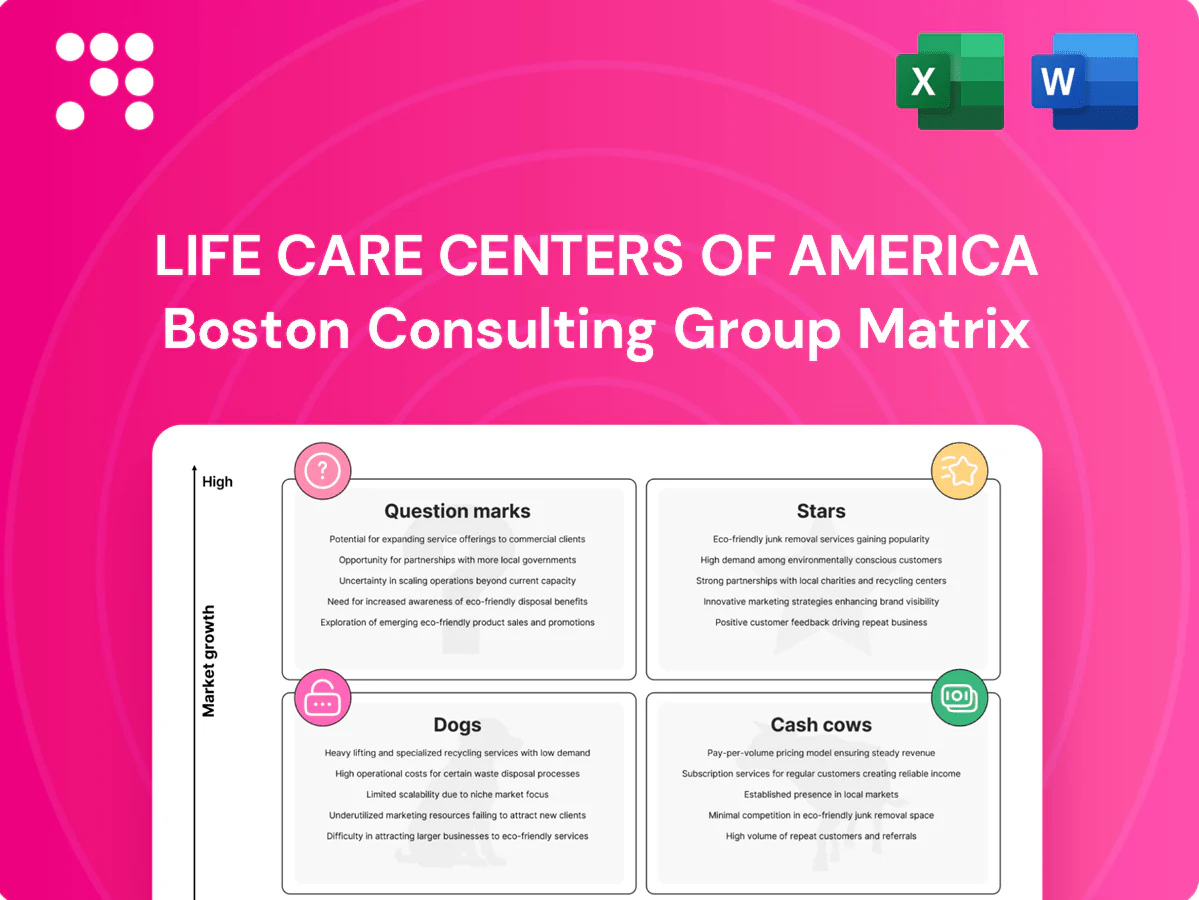
Life Care Centers of America Boston Consulting Group Matrix

Visual. Strategic. Downloadable.
Quick snapshot: Life Care Centers of America’s portfolio shows where care lines are winning, which services are steady cash generators, and which need urgent rethinking — the kind of clarity execs crave. This preview points you in the right direction, but the full BCG Matrix delivers quadrant-by-quadrant placements, data-backed recommendations, and a ready-to-use Word report plus an Excel summary. Purchase the complete analysis to stop guessing and start executing with confidence.
Stars

Post-acute rehab hubs tied to hospital discharges
Post-acute rehab hubs are a Stars position: high local market share in the hospital-driven discharge stream, with 2024 Medicare data showing hospital discharges remain the majority source of post-acute referrals. These fast-moving units demand robust therapy staffing and tight length-of-stay controls to protect margins. They absorb marketing and care-coordination spend but deliver reliable volume and reimbursement. Continue investing to secure preferred status and scale outcomes data.
Therapy services (PT/OT/Speech) with outcome leadership
Therapy services (PT/OT/Speech) sit in the Stars quadrant as clinical outcomes are the clear differentiator and post-pandemic demand remains elevated, with post-acute care estimated at about $320B in 2024 and Medicare driving roughly 40% of spend. High-intensity care carries higher unit costs but sustains premium rates when functional-gain metrics are proven; published outcomes correlate with referral uplifts reported up to 20-25%. Sustained quality converts into scalable system-level contracts and broader network deals.

Specialized memory care programs in growth markets
Dementia prevalence is rising, with 6.7 million Americans age 65+ living with Alzheimer’s in 2024, driving families to seek purpose-built memory programs. High-staffing models and specialized training demand cash up front, raising capex and payroll pressure. When occupancy stabilizes these centers often dominate micro-markets; double down on caregiver support and safety tech to stay ahead.

Preferred provider networks with Medicare Advantage plans
Preferred provider network inclusion drives steady referrals as Medicare Advantage enrollment reached 30.2 million in 2024; being on the short list converts that market growth into predictable volume. Delivering on MA requires standardized care pathways, robust data sharing and active readmission control. Integration costs are significant but secure volume and favorable rate negotiations; protect these contracts like gold.
- Market size: 30.2M MA enrollees (2024)
- Operational needs: care pathways, HIE/data sharing, readmission programs
- Commercial impact: locks volume and rate leverage
- Strategic priority: treat MA contracts as high-value assets
Hospital partnership units (SNFists, transitional care)
Hospital partnership units (SNFists, transitional care) are Stars as co-managed clinical models win share while hospitals chase throughput; programs reporting shared-care models show up to 25% lower 30-day readmissions and faster discharge times. Physician alignment, robust protocols and 7-day admission capacity are essential; costs exist but market tailwinds favor scale. Maintain speed-to-admit and publish readmission wins to expand referrals and negotiate better rates.
- Tag: readmission-reduction ~25%
- Tag: 7-day-admit required
- Tag: physician-alignment critical
- Tag: publish outcomes to scale
Post-acute rehab hubs hold local share; therapy & hospital partnerships cut readmissions
Post-acute rehab hubs hold high local share amid hospital-driven discharges in 2024; they need therapy staffing and LOS controls. Therapy services are Stars in a $320B post-acute market (2024) with Medicare ~40% of spend. MA enrollment 30.2M (2024) and hospital-partnership models cut 30-day readmissions ~25%, securing volume and rate leverage.
| Category | 2024 metric | Impact |
|---|---|---|
| Post-acute rehab | High local share | Reliable volume |
| Therapy services | $320B market, Medicare ~40% | Premium rates |
| MA enrollment | 30.2M | Locked referrals |
| Hospital partnerships | Readmission ↓ ~25% | Referral growth |
What is included in the product
 Detailed Word Document
BCG Matrix for Life Care Centers: maps Stars, Cash Cows, Question Marks, Dogs and gives invest/hold/divest guidance.

 Customizable Excel Spreadsheet
One-page BCG matrix placing Life Care units in quadrants to quickly spot underperformers and growth bets, ready for exec decks.
Cash Cows

Stable long-term skilled nursing beds (Medicaid-heavy)
Stable long-term skilled nursing beds in mature markets deliver steady census and predictable Medicaid-heavy reimbursement; Medicaid represents over 50% of nursing home days (CMS 2022). Low market growth but solid cash generation when staffing and payer mix are tuned. Focus on optimizing labor deployment, length-of-stay and ancillary utilization to boost margins. Milk carefully while guarding quality metrics and regulatory compliance.
Established assisted living communities with high occupancy
Life Care Centers of America, operating over 200 senior care facilities across 28 states, leverages a strong brand where tours convert and churn is predictable, supporting assisted living occupancy near the industry average of ~81% in 2024. Marketing spend remains modest once reputation is set, while incremental margin is driven by pricing discipline and service add-ons. Keep capex light and maintain strong dining and activities to sustain retention and ancillary revenue.

Strong regional referral pipelines (physicians and hospitals)
Well-worn physician and hospital referral channels drive steady admissions, with hospital-originated referrals representing about 65% of post-acute SNF admissions and supporting occupancy near the industry ~78% level (2023–24). Maintenance-mode relationship work—lunches, clinical updates, outcome reports—requires minimal incremental spend yet sustains bed fill. These low-cost activities yield consistent cash flow even without market growth, underpinning cash-cow economics.

Mature outpatient therapy clinics adjacent to facilities
Mature outpatient therapy clinics adjacent to Life Care Centers show steady community demand and reliable cross-referrals from the SNF/AL resident base, yielding consistent visit volumes and predictable revenue streams in 2024.
With capital equipment sunk and staffing patterns established, margin improvement depends on scheduling efficiency and favorable payer mix; operators typically focus on maximizing throughput and reducing no-shows to protect EBITDA.
Strategy: hold the line on investment, harvest cash flows for corporate needs, and reinvest selectively where payer trends or local demand justify growth.
- Steady demand from SNF/AL cross-referrals
- Equipment costs sunk; staffing predictable
- Profit drivers: scheduling efficiency, payer mix
- Strategy: hold and harvest
Reputation and scale advantages in legacy states
Reputation and scale in legacy states give purchasing power and administrative leverage; as of 2024 Life Care Centers of America remains one of the largest privately held skilled‑nursing operators in the US. Brand trust lowers acquisition cost per resident and supports occupancy; growth is slow but margins remain real. Maintain compliance and clean CMS survey scores to preserve the moat.
- Scale: purchasing & admin leverage
- Brand: lowers acquisition cost
- Profit: slow growth, positive margins
- Moat: keep compliance and high survey scores
Stable SNF/AL — Medicaid‑heavy, ~78% occ; harvest cash, optimize staffing
Stable SNF/AL beds (200+ facilities, 28 states) deliver Medicaid‑heavy revenues (Medicaid >50% nursing days, CMS 2022), occupancy ~78% (2023–24) and AL ~81% (2024). Low growth, high cash conversion when staffing and payer mix are optimized; focus on scheduling, length‑of‑stay and ancillaries. Hold capex, harvest cash, reinvest selectively.
| Metric | 2024 |
|---|---|
| Facilities | 200+ |
| States | 28 |
| Occupancy SNF | ~78% |
| AL Occ | ~81% |
| Medicaid share | >50% |
Delivered as Shown
Life Care Centers of America BCG Matrix
The file you're previewing is the exact Life Care Centers of America BCG Matrix you'll receive after purchase — no watermarks, no demo content, just the fully formatted, ready-to-use report. Crafted by strategy pros, it’s analysis-ready and designed for clarity. Once bought, the full document is immediately downloadable and editable, perfect for presentations, planning, or sharing with your team.

Visual. Strategic. Downloadable.
Quick snapshot: Life Care Centers of America’s portfolio shows where care lines are winning, which services are steady cash generators, and which need urgent rethinking — the kind of clarity execs crave. This preview points you in the right direction, but the full BCG Matrix delivers quadrant-by-quadrant placements, data-backed recommendations, and a ready-to-use Word report plus an Excel summary. Purchase the complete analysis to stop guessing and start executing with confidence.
Stars
Post-acute rehab hubs tied to hospital discharges
Post-acute rehab hubs are a Stars position: high local market share in the hospital-driven discharge stream, with 2024 Medicare data showing hospital discharges remain the majority source of post-acute referrals. These fast-moving units demand robust therapy staffing and tight length-of-stay controls to protect margins. They absorb marketing and care-coordination spend but deliver reliable volume and reimbursement. Continue investing to secure preferred status and scale outcomes data.
Therapy services (PT/OT/Speech) with outcome leadership
Therapy services (PT/OT/Speech) sit in the Stars quadrant as clinical outcomes are the clear differentiator and post-pandemic demand remains elevated, with post-acute care estimated at about $320B in 2024 and Medicare driving roughly 40% of spend. High-intensity care carries higher unit costs but sustains premium rates when functional-gain metrics are proven; published outcomes correlate with referral uplifts reported up to 20-25%. Sustained quality converts into scalable system-level contracts and broader network deals.
Specialized memory care programs in growth markets
Dementia prevalence is rising, with 6.7 million Americans age 65+ living with Alzheimer’s in 2024, driving families to seek purpose-built memory programs. High-staffing models and specialized training demand cash up front, raising capex and payroll pressure. When occupancy stabilizes these centers often dominate micro-markets; double down on caregiver support and safety tech to stay ahead.
Preferred provider networks with Medicare Advantage plans
Preferred provider network inclusion drives steady referrals as Medicare Advantage enrollment reached 30.2 million in 2024; being on the short list converts that market growth into predictable volume. Delivering on MA requires standardized care pathways, robust data sharing and active readmission control. Integration costs are significant but secure volume and favorable rate negotiations; protect these contracts like gold.
- Market size: 30.2M MA enrollees (2024)
- Operational needs: care pathways, HIE/data sharing, readmission programs
- Commercial impact: locks volume and rate leverage
- Strategic priority: treat MA contracts as high-value assets
Hospital partnership units (SNFists, transitional care)
Hospital partnership units (SNFists, transitional care) are Stars as co-managed clinical models win share while hospitals chase throughput; programs reporting shared-care models show up to 25% lower 30-day readmissions and faster discharge times. Physician alignment, robust protocols and 7-day admission capacity are essential; costs exist but market tailwinds favor scale. Maintain speed-to-admit and publish readmission wins to expand referrals and negotiate better rates.
- Tag: readmission-reduction ~25%
- Tag: 7-day-admit required
- Tag: physician-alignment critical
- Tag: publish outcomes to scale
Post-acute rehab hubs hold local share; therapy & hospital partnerships cut readmissions
Post-acute rehab hubs hold high local share amid hospital-driven discharges in 2024; they need therapy staffing and LOS controls. Therapy services are Stars in a $320B post-acute market (2024) with Medicare ~40% of spend. MA enrollment 30.2M (2024) and hospital-partnership models cut 30-day readmissions ~25%, securing volume and rate leverage.
| Category | 2024 metric | Impact |
|---|---|---|
| Post-acute rehab | High local share | Reliable volume |
| Therapy services | $320B market, Medicare ~40% | Premium rates |
| MA enrollment | 30.2M | Locked referrals |
| Hospital partnerships | Readmission ↓ ~25% | Referral growth |
What is included in the product
Detailed Word Document
BCG Matrix for Life Care Centers: maps Stars, Cash Cows, Question Marks, Dogs and gives invest/hold/divest guidance.
Customizable Excel Spreadsheet
One-page BCG matrix placing Life Care units in quadrants to quickly spot underperformers and growth bets, ready for exec decks.
Cash Cows
Stable long-term skilled nursing beds (Medicaid-heavy)
Stable long-term skilled nursing beds in mature markets deliver steady census and predictable Medicaid-heavy reimbursement; Medicaid represents over 50% of nursing home days (CMS 2022). Low market growth but solid cash generation when staffing and payer mix are tuned. Focus on optimizing labor deployment, length-of-stay and ancillary utilization to boost margins. Milk carefully while guarding quality metrics and regulatory compliance.
Established assisted living communities with high occupancy
Life Care Centers of America, operating over 200 senior care facilities across 28 states, leverages a strong brand where tours convert and churn is predictable, supporting assisted living occupancy near the industry average of ~81% in 2024. Marketing spend remains modest once reputation is set, while incremental margin is driven by pricing discipline and service add-ons. Keep capex light and maintain strong dining and activities to sustain retention and ancillary revenue.
Strong regional referral pipelines (physicians and hospitals)
Well-worn physician and hospital referral channels drive steady admissions, with hospital-originated referrals representing about 65% of post-acute SNF admissions and supporting occupancy near the industry ~78% level (2023–24). Maintenance-mode relationship work—lunches, clinical updates, outcome reports—requires minimal incremental spend yet sustains bed fill. These low-cost activities yield consistent cash flow even without market growth, underpinning cash-cow economics.
Mature outpatient therapy clinics adjacent to facilities
Mature outpatient therapy clinics adjacent to Life Care Centers show steady community demand and reliable cross-referrals from the SNF/AL resident base, yielding consistent visit volumes and predictable revenue streams in 2024.
With capital equipment sunk and staffing patterns established, margin improvement depends on scheduling efficiency and favorable payer mix; operators typically focus on maximizing throughput and reducing no-shows to protect EBITDA.
Strategy: hold the line on investment, harvest cash flows for corporate needs, and reinvest selectively where payer trends or local demand justify growth.
- Steady demand from SNF/AL cross-referrals
- Equipment costs sunk; staffing predictable
- Profit drivers: scheduling efficiency, payer mix
- Strategy: hold and harvest
Reputation and scale advantages in legacy states
Reputation and scale in legacy states give purchasing power and administrative leverage; as of 2024 Life Care Centers of America remains one of the largest privately held skilled‑nursing operators in the US. Brand trust lowers acquisition cost per resident and supports occupancy; growth is slow but margins remain real. Maintain compliance and clean CMS survey scores to preserve the moat.
- Scale: purchasing & admin leverage
- Brand: lowers acquisition cost
- Profit: slow growth, positive margins
- Moat: keep compliance and high survey scores
Stable SNF/AL — Medicaid‑heavy, ~78% occ; harvest cash, optimize staffing
Stable SNF/AL beds (200+ facilities, 28 states) deliver Medicaid‑heavy revenues (Medicaid >50% nursing days, CMS 2022), occupancy ~78% (2023–24) and AL ~81% (2024). Low growth, high cash conversion when staffing and payer mix are optimized; focus on scheduling, length‑of‑stay and ancillaries. Hold capex, harvest cash, reinvest selectively.
| Metric | 2024 |
|---|---|
| Facilities | 200+ |
| States | 28 |
| Occupancy SNF | ~78% |
| AL Occ | ~81% |
| Medicaid share | >50% |
Delivered as Shown
Life Care Centers of America BCG Matrix
The file you're previewing is the exact Life Care Centers of America BCG Matrix you'll receive after purchase — no watermarks, no demo content, just the fully formatted, ready-to-use report. Crafted by strategy pros, it’s analysis-ready and designed for clarity. Once bought, the full document is immediately downloadable and editable, perfect for presentations, planning, or sharing with your team.
Original: $10.00
-65%$10.00
$3.50Description
Visual. Strategic. Downloadable.
Quick snapshot: Life Care Centers of America’s portfolio shows where care lines are winning, which services are steady cash generators, and which need urgent rethinking — the kind of clarity execs crave. This preview points you in the right direction, but the full BCG Matrix delivers quadrant-by-quadrant placements, data-backed recommendations, and a ready-to-use Word report plus an Excel summary. Purchase the complete analysis to stop guessing and start executing with confidence.
Stars
Post-acute rehab hubs tied to hospital discharges
Post-acute rehab hubs are a Stars position: high local market share in the hospital-driven discharge stream, with 2024 Medicare data showing hospital discharges remain the majority source of post-acute referrals. These fast-moving units demand robust therapy staffing and tight length-of-stay controls to protect margins. They absorb marketing and care-coordination spend but deliver reliable volume and reimbursement. Continue investing to secure preferred status and scale outcomes data.
Therapy services (PT/OT/Speech) with outcome leadership
Therapy services (PT/OT/Speech) sit in the Stars quadrant as clinical outcomes are the clear differentiator and post-pandemic demand remains elevated, with post-acute care estimated at about $320B in 2024 and Medicare driving roughly 40% of spend. High-intensity care carries higher unit costs but sustains premium rates when functional-gain metrics are proven; published outcomes correlate with referral uplifts reported up to 20-25%. Sustained quality converts into scalable system-level contracts and broader network deals.
Specialized memory care programs in growth markets
Dementia prevalence is rising, with 6.7 million Americans age 65+ living with Alzheimer’s in 2024, driving families to seek purpose-built memory programs. High-staffing models and specialized training demand cash up front, raising capex and payroll pressure. When occupancy stabilizes these centers often dominate micro-markets; double down on caregiver support and safety tech to stay ahead.
Preferred provider networks with Medicare Advantage plans
Preferred provider network inclusion drives steady referrals as Medicare Advantage enrollment reached 30.2 million in 2024; being on the short list converts that market growth into predictable volume. Delivering on MA requires standardized care pathways, robust data sharing and active readmission control. Integration costs are significant but secure volume and favorable rate negotiations; protect these contracts like gold.
- Market size: 30.2M MA enrollees (2024)
- Operational needs: care pathways, HIE/data sharing, readmission programs
- Commercial impact: locks volume and rate leverage
- Strategic priority: treat MA contracts as high-value assets
Hospital partnership units (SNFists, transitional care)
Hospital partnership units (SNFists, transitional care) are Stars as co-managed clinical models win share while hospitals chase throughput; programs reporting shared-care models show up to 25% lower 30-day readmissions and faster discharge times. Physician alignment, robust protocols and 7-day admission capacity are essential; costs exist but market tailwinds favor scale. Maintain speed-to-admit and publish readmission wins to expand referrals and negotiate better rates.
- Tag: readmission-reduction ~25%
- Tag: 7-day-admit required
- Tag: physician-alignment critical
- Tag: publish outcomes to scale
Post-acute rehab hubs hold local share; therapy & hospital partnerships cut readmissions
Post-acute rehab hubs hold high local share amid hospital-driven discharges in 2024; they need therapy staffing and LOS controls. Therapy services are Stars in a $320B post-acute market (2024) with Medicare ~40% of spend. MA enrollment 30.2M (2024) and hospital-partnership models cut 30-day readmissions ~25%, securing volume and rate leverage.
| Category | 2024 metric | Impact |
|---|---|---|
| Post-acute rehab | High local share | Reliable volume |
| Therapy services | $320B market, Medicare ~40% | Premium rates |
| MA enrollment | 30.2M | Locked referrals |
| Hospital partnerships | Readmission ↓ ~25% | Referral growth |
What is included in the product
Detailed Word Document
BCG Matrix for Life Care Centers: maps Stars, Cash Cows, Question Marks, Dogs and gives invest/hold/divest guidance.
Customizable Excel Spreadsheet
One-page BCG matrix placing Life Care units in quadrants to quickly spot underperformers and growth bets, ready for exec decks.
Cash Cows
Stable long-term skilled nursing beds (Medicaid-heavy)
Stable long-term skilled nursing beds in mature markets deliver steady census and predictable Medicaid-heavy reimbursement; Medicaid represents over 50% of nursing home days (CMS 2022). Low market growth but solid cash generation when staffing and payer mix are tuned. Focus on optimizing labor deployment, length-of-stay and ancillary utilization to boost margins. Milk carefully while guarding quality metrics and regulatory compliance.
Established assisted living communities with high occupancy
Life Care Centers of America, operating over 200 senior care facilities across 28 states, leverages a strong brand where tours convert and churn is predictable, supporting assisted living occupancy near the industry average of ~81% in 2024. Marketing spend remains modest once reputation is set, while incremental margin is driven by pricing discipline and service add-ons. Keep capex light and maintain strong dining and activities to sustain retention and ancillary revenue.
Strong regional referral pipelines (physicians and hospitals)
Well-worn physician and hospital referral channels drive steady admissions, with hospital-originated referrals representing about 65% of post-acute SNF admissions and supporting occupancy near the industry ~78% level (2023–24). Maintenance-mode relationship work—lunches, clinical updates, outcome reports—requires minimal incremental spend yet sustains bed fill. These low-cost activities yield consistent cash flow even without market growth, underpinning cash-cow economics.
Mature outpatient therapy clinics adjacent to facilities
Mature outpatient therapy clinics adjacent to Life Care Centers show steady community demand and reliable cross-referrals from the SNF/AL resident base, yielding consistent visit volumes and predictable revenue streams in 2024.
With capital equipment sunk and staffing patterns established, margin improvement depends on scheduling efficiency and favorable payer mix; operators typically focus on maximizing throughput and reducing no-shows to protect EBITDA.
Strategy: hold the line on investment, harvest cash flows for corporate needs, and reinvest selectively where payer trends or local demand justify growth.
- Steady demand from SNF/AL cross-referrals
- Equipment costs sunk; staffing predictable
- Profit drivers: scheduling efficiency, payer mix
- Strategy: hold and harvest
Reputation and scale advantages in legacy states
Reputation and scale in legacy states give purchasing power and administrative leverage; as of 2024 Life Care Centers of America remains one of the largest privately held skilled‑nursing operators in the US. Brand trust lowers acquisition cost per resident and supports occupancy; growth is slow but margins remain real. Maintain compliance and clean CMS survey scores to preserve the moat.
- Scale: purchasing & admin leverage
- Brand: lowers acquisition cost
- Profit: slow growth, positive margins
- Moat: keep compliance and high survey scores
Stable SNF/AL — Medicaid‑heavy, ~78% occ; harvest cash, optimize staffing
Stable SNF/AL beds (200+ facilities, 28 states) deliver Medicaid‑heavy revenues (Medicaid >50% nursing days, CMS 2022), occupancy ~78% (2023–24) and AL ~81% (2024). Low growth, high cash conversion when staffing and payer mix are optimized; focus on scheduling, length‑of‑stay and ancillaries. Hold capex, harvest cash, reinvest selectively.
| Metric | 2024 |
|---|---|
| Facilities | 200+ |
| States | 28 |
| Occupancy SNF | ~78% |
| AL Occ | ~81% |
| Medicaid share | >50% |
Delivered as Shown
Life Care Centers of America BCG Matrix
The file you're previewing is the exact Life Care Centers of America BCG Matrix you'll receive after purchase — no watermarks, no demo content, just the fully formatted, ready-to-use report. Crafted by strategy pros, it’s analysis-ready and designed for clarity. Once bought, the full document is immediately downloadable and editable, perfect for presentations, planning, or sharing with your team.











