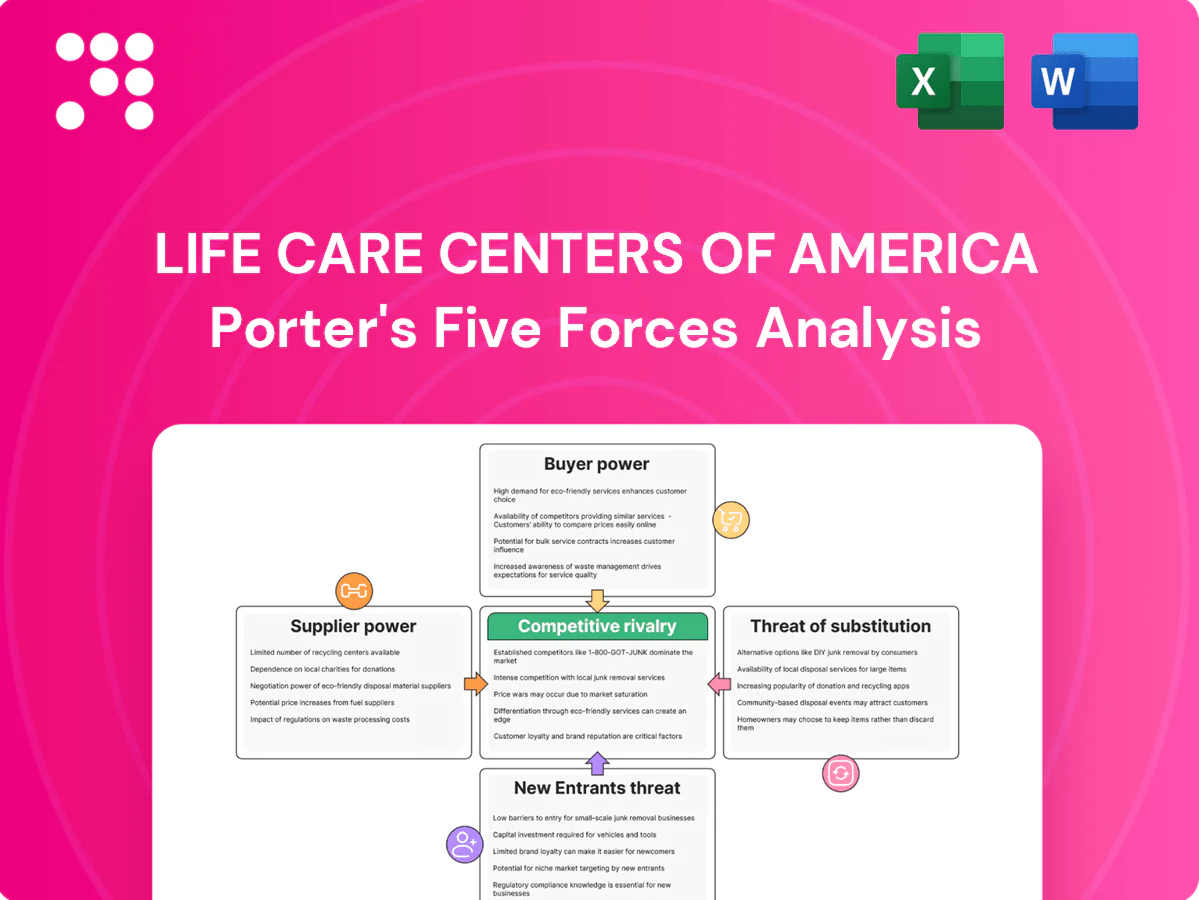
Life Care Centers of America Porter's Five Forces Analysis

From Overview to Strategy Blueprint
Life Care Centers of America's Porter's Five Forces snapshot highlights moderate buyer power, high regulatory barriers, supplier concentration risks, limited substitute threat, and competitive rivalry driven by scale and reimbursement pressures. This brief only scratches the surface. Unlock the full Porter's Five Forces Analysis for force-by-force ratings, visuals, and actionable strategy.
Suppliers Bargaining Power

Clinical labor scarcity
Registered nurses, CNAs, therapists and specialist clinicians face a national shortage—estimated at roughly 200,000 RNs near 2025—giving labor suppliers strong leverage over Life Care Centers of America. Wage inflation and greater agency reliance (agency spend reported up ~20% versus pre‑pandemic levels) raise operating costs and reduce scheduling flexibility. Significant retention and training investments are required to curb turnover, while rising union activity and state staffing mandates (which can add several percentage points to payroll) further amplify supplier power.
Agency and temp staffing
Staffing agencies act as price setters during demand spikes or outbreaks, with agency bill rates in 2024 remaining about 20–30% above pre‑pandemic levels, pressuring Life Care Centers margins. Premium bill rates and cancellation fees constrain operational agility and increase labor spend volatility. Diversifying vendors and building internal float pools reduce exposure, while long‑term vendor contracts can trade higher price for staffing reliability.

Pharma and medical supplies
Pharmaceutical distributors, DME suppliers and wound‑care vendors materially influence Life Care Centers of America through input pricing and availability; the top three US pharmaceutical distributors (AmerisourceBergen, Cardinal Health, McKesson) account for roughly 85% of distribution in 2024. Consolidation limits switching options, while GPOs—serving over 90% of U.S. hospitals—secure discounts but can restrict product choice. Recent supply‑chain shocks prompted larger inventory buffers and higher working capital needs.

Technology and EHR vendors
EHR, eMAR and analytics systems create deep workflow dependence and high switching costs; implementations commonly span 3–7 years with substantial training and integration effort.
Interoperability mandates with hospitals and payers raise integration complexity and reinforce vendor lock-in across post-acute networks.
Cybersecurity and regulatory compliance impose recurring costs and continuous vendor oversight; multi-year licenses and hefty implementation fees further strengthen supplier bargaining power.
- Vendor lock-in
- High switching costs
- Recurring cybersecurity spend
- Long license terms
Facilities, food, and utilities
Facilities, food, linens, sanitation and utilities are non-discretionary suppliers for Life Care; foodservice inflation ran about 5.8% year-over-year in 2024 and commercial utility costs rose roughly 4% in 2024, squeezing margins. Local water and power monopolies limit negotiating leverage, while long-term facility maintenance and capex contracts lock operators to specific contractors. Multi-site scale can secure better pricing, typically lowering procurement spend by an estimated 3–8% but cannot eliminate ongoing cost pressure.
- Foodservice inflation: ~5.8% (2024)
- Utilities inflation: ~4% (2024)
- Capex/maintenance: creates supplier lock-in
- Scale savings: ~3–8% procurement improvement
Labor squeeze: RN ≈200,000; agency +20–30%; pharma Top3 ≈85%
Labor shortages (≈200,000 RN gap near 2025) and agency bill rates +20–30% (2024) raise costs and give workers/agencies strong leverage. Pharma distro concentration (Top3 ≈85% of distribution, 2024) and EHR/vendor lock‑in (implementations 3–7 years) limit switching and increase recurring spend; foodservice +5.8% and utilities +4% (2024) further squeeze margins.
| Supplier | 2024 metric | Impact |
|---|---|---|
| Labor | RN gap ≈200k; agency +20–30% | Higher wages, volatility |
| Pharma | Top3 ≈85% | Limited switching |
| Ops | Food +5.8%; Utilities +4% | Margin pressure |
What is included in the product
 Detailed Word Document
Tailored exclusively for Life Care Centers of America, this Porter's Five Forces overview uncovers key drivers of competition, buyer and supplier power, and market entry risks, while identifying disruptive substitutes and dynamics that influence pricing, profitability, and strategic positioning.

 Customizable Excel Spreadsheet
Clear, one-sheet Porter's Five Forces for Life Care Centers—customizable pressure levels and instant spider/radar visualization to simplify strategic decisions and drop straight into decks or reports.
Customers Bargaining Power

Government payers
Medicare and Medicaid set reimbursement levels that largely determine Life Care Centers of America revenue, since federal payers finance the majority of U.S. nursing facility care; in 2024 Medicaid financed roughly half of nursing facility spending while Medicare accounted for a meaningful share via post-acute SNF stays. Rate cuts, audits and CMS value-based adjustments have increased buyer power and compressed margins. Compliance and heavier documentation raise administrative costs, limiting ability to price above set rates.
Medicare Advantage plans
Medicare Advantage plans, covering over 50% of Medicare beneficiaries in 2024 (~31 million enrollees), exert strong bargaining power by negotiating deeper discounts and imposing utilization controls that compress margins for Life Care Centers of America. Narrow networks and prior authorizations shift both volume and intensity of SNF admissions toward preferred, lower-cost providers. Performance metrics and CMS-linked bonus payments influence plan steerage and referrals. Annual contract renegotiations frequently pressure rates and terms year-to-year.

Hospitals and referral sources
Hospitals, discharge planners and ACOs (covering over 11 million Medicare beneficiaries in 2024) drive post-acute referrals, giving buyer groups concentrated leverage. Preferred networks reward quality, speed-to-admit and outcomes, intensifying switching power. Poor quality scores can cost referrals and revenue. Active relationship management and real-time data sharing reduce dependence and preserve placement volumes.

Residents and families
Private-pay residents, who in mixed-pay skilled nursing facilities represented about 25–40% of revenue in 2024 industry ranges, are highly price sensitive and compare amenities, ratings and proximity when choosing Life Care Centers.
Online reviews and CMS star ratings amplify switching ease; service customization and hospitality raise willingness to pay, while occupancy cycles (U.S. SNF occupancy ~78% in 2023–24) shift resident negotiating leverage over time.
- Price sensitivity: 25–40% revenue share (2024 range)
- Ratings impact: CMS stars + online reviews drive switching
- Willingness to pay: tied to customization & hospitality
- Leverage swings with occupancy (~78% 2023–24)
Case managers and payers’ UM
Case managers and payers' utilization management (UM) tightly control length of stay and therapy intensity, directly impacting LCCA revenue through denials and downgrades; in 2024 Medicare Advantage plans covered over 30 million beneficiaries, amplifying payer leverage. Strong clinical documentation and robust appeals raise revenue recovery and aligning care pathways improves authorization success rates.
- UM controls LOS and therapy intensity
- Denials/downgrades cut revenue realization
- Clinical documentation and appeals mitigate losses
- Care pathway alignment increases authorization approvals
Post-acute squeeze: Medicaid ~50%, MA >30m, margins tight
Buyers (Medicaid ~50% of nursing facility spending 2024; Medicare Advantage >30m enrollees in 2024) exert strong pricing and utilization control, compressing margins and forcing heavy compliance costs. Hospitals/ACOs and case managers steer post-acute referrals; occupancy (~78% 2023–24) and CMS stars drive switching. Private-pay (25–40% revenue) remains price-sensitive.
| Buyer | 2024 stat | Impact |
|---|---|---|
| Medicaid | ~50% funding | Rate-dependent revenue |
| Medicare Advantage | >30m enrollees | Negotiated discounts, UM |
| Private-pay | 25–40% rev | Price-sensitive |
Preview the Actual Deliverable
Life Care Centers of America Porter's Five Forces Analysis
This preview shows the full Porter's Five Forces analysis for Life Care Centers of America and is identical to the file you'll receive. The delivered document is professionally formatted, comprehensive, and ready for immediate use upon purchase. No placeholders or samples—this is the exact deliverable.

From Overview to Strategy Blueprint
Life Care Centers of America's Porter's Five Forces snapshot highlights moderate buyer power, high regulatory barriers, supplier concentration risks, limited substitute threat, and competitive rivalry driven by scale and reimbursement pressures. This brief only scratches the surface. Unlock the full Porter's Five Forces Analysis for force-by-force ratings, visuals, and actionable strategy.
Suppliers Bargaining Power
Clinical labor scarcity
Registered nurses, CNAs, therapists and specialist clinicians face a national shortage—estimated at roughly 200,000 RNs near 2025—giving labor suppliers strong leverage over Life Care Centers of America. Wage inflation and greater agency reliance (agency spend reported up ~20% versus pre‑pandemic levels) raise operating costs and reduce scheduling flexibility. Significant retention and training investments are required to curb turnover, while rising union activity and state staffing mandates (which can add several percentage points to payroll) further amplify supplier power.
Agency and temp staffing
Staffing agencies act as price setters during demand spikes or outbreaks, with agency bill rates in 2024 remaining about 20–30% above pre‑pandemic levels, pressuring Life Care Centers margins. Premium bill rates and cancellation fees constrain operational agility and increase labor spend volatility. Diversifying vendors and building internal float pools reduce exposure, while long‑term vendor contracts can trade higher price for staffing reliability.
Pharma and medical supplies
Pharmaceutical distributors, DME suppliers and wound‑care vendors materially influence Life Care Centers of America through input pricing and availability; the top three US pharmaceutical distributors (AmerisourceBergen, Cardinal Health, McKesson) account for roughly 85% of distribution in 2024. Consolidation limits switching options, while GPOs—serving over 90% of U.S. hospitals—secure discounts but can restrict product choice. Recent supply‑chain shocks prompted larger inventory buffers and higher working capital needs.
Technology and EHR vendors
EHR, eMAR and analytics systems create deep workflow dependence and high switching costs; implementations commonly span 3–7 years with substantial training and integration effort.
Interoperability mandates with hospitals and payers raise integration complexity and reinforce vendor lock-in across post-acute networks.
Cybersecurity and regulatory compliance impose recurring costs and continuous vendor oversight; multi-year licenses and hefty implementation fees further strengthen supplier bargaining power.
- Vendor lock-in
- High switching costs
- Recurring cybersecurity spend
- Long license terms
Facilities, food, and utilities
Facilities, food, linens, sanitation and utilities are non-discretionary suppliers for Life Care; foodservice inflation ran about 5.8% year-over-year in 2024 and commercial utility costs rose roughly 4% in 2024, squeezing margins. Local water and power monopolies limit negotiating leverage, while long-term facility maintenance and capex contracts lock operators to specific contractors. Multi-site scale can secure better pricing, typically lowering procurement spend by an estimated 3–8% but cannot eliminate ongoing cost pressure.
- Foodservice inflation: ~5.8% (2024)
- Utilities inflation: ~4% (2024)
- Capex/maintenance: creates supplier lock-in
- Scale savings: ~3–8% procurement improvement
Labor squeeze: RN ≈200,000; agency +20–30%; pharma Top3 ≈85%
Labor shortages (≈200,000 RN gap near 2025) and agency bill rates +20–30% (2024) raise costs and give workers/agencies strong leverage. Pharma distro concentration (Top3 ≈85% of distribution, 2024) and EHR/vendor lock‑in (implementations 3–7 years) limit switching and increase recurring spend; foodservice +5.8% and utilities +4% (2024) further squeeze margins.
| Supplier | 2024 metric | Impact |
|---|---|---|
| Labor | RN gap ≈200k; agency +20–30% | Higher wages, volatility |
| Pharma | Top3 ≈85% | Limited switching |
| Ops | Food +5.8%; Utilities +4% | Margin pressure |
What is included in the product
Detailed Word Document
Tailored exclusively for Life Care Centers of America, this Porter's Five Forces overview uncovers key drivers of competition, buyer and supplier power, and market entry risks, while identifying disruptive substitutes and dynamics that influence pricing, profitability, and strategic positioning.
Customizable Excel Spreadsheet
Clear, one-sheet Porter's Five Forces for Life Care Centers—customizable pressure levels and instant spider/radar visualization to simplify strategic decisions and drop straight into decks or reports.
Customers Bargaining Power
Government payers
Medicare and Medicaid set reimbursement levels that largely determine Life Care Centers of America revenue, since federal payers finance the majority of U.S. nursing facility care; in 2024 Medicaid financed roughly half of nursing facility spending while Medicare accounted for a meaningful share via post-acute SNF stays. Rate cuts, audits and CMS value-based adjustments have increased buyer power and compressed margins. Compliance and heavier documentation raise administrative costs, limiting ability to price above set rates.
Medicare Advantage plans
Medicare Advantage plans, covering over 50% of Medicare beneficiaries in 2024 (~31 million enrollees), exert strong bargaining power by negotiating deeper discounts and imposing utilization controls that compress margins for Life Care Centers of America. Narrow networks and prior authorizations shift both volume and intensity of SNF admissions toward preferred, lower-cost providers. Performance metrics and CMS-linked bonus payments influence plan steerage and referrals. Annual contract renegotiations frequently pressure rates and terms year-to-year.
Hospitals and referral sources
Hospitals, discharge planners and ACOs (covering over 11 million Medicare beneficiaries in 2024) drive post-acute referrals, giving buyer groups concentrated leverage. Preferred networks reward quality, speed-to-admit and outcomes, intensifying switching power. Poor quality scores can cost referrals and revenue. Active relationship management and real-time data sharing reduce dependence and preserve placement volumes.
Residents and families
Private-pay residents, who in mixed-pay skilled nursing facilities represented about 25–40% of revenue in 2024 industry ranges, are highly price sensitive and compare amenities, ratings and proximity when choosing Life Care Centers.
Online reviews and CMS star ratings amplify switching ease; service customization and hospitality raise willingness to pay, while occupancy cycles (U.S. SNF occupancy ~78% in 2023–24) shift resident negotiating leverage over time.
- Price sensitivity: 25–40% revenue share (2024 range)
- Ratings impact: CMS stars + online reviews drive switching
- Willingness to pay: tied to customization & hospitality
- Leverage swings with occupancy (~78% 2023–24)
Case managers and payers’ UM
Case managers and payers' utilization management (UM) tightly control length of stay and therapy intensity, directly impacting LCCA revenue through denials and downgrades; in 2024 Medicare Advantage plans covered over 30 million beneficiaries, amplifying payer leverage. Strong clinical documentation and robust appeals raise revenue recovery and aligning care pathways improves authorization success rates.
- UM controls LOS and therapy intensity
- Denials/downgrades cut revenue realization
- Clinical documentation and appeals mitigate losses
- Care pathway alignment increases authorization approvals
Post-acute squeeze: Medicaid ~50%, MA >30m, margins tight
Buyers (Medicaid ~50% of nursing facility spending 2024; Medicare Advantage >30m enrollees in 2024) exert strong pricing and utilization control, compressing margins and forcing heavy compliance costs. Hospitals/ACOs and case managers steer post-acute referrals; occupancy (~78% 2023–24) and CMS stars drive switching. Private-pay (25–40% revenue) remains price-sensitive.
| Buyer | 2024 stat | Impact |
|---|---|---|
| Medicaid | ~50% funding | Rate-dependent revenue |
| Medicare Advantage | >30m enrollees | Negotiated discounts, UM |
| Private-pay | 25–40% rev | Price-sensitive |
Preview the Actual Deliverable
Life Care Centers of America Porter's Five Forces Analysis
This preview shows the full Porter's Five Forces analysis for Life Care Centers of America and is identical to the file you'll receive. The delivered document is professionally formatted, comprehensive, and ready for immediate use upon purchase. No placeholders or samples—this is the exact deliverable.
Original: $10.00
-65%$10.00
$3.50Description
From Overview to Strategy Blueprint
Life Care Centers of America's Porter's Five Forces snapshot highlights moderate buyer power, high regulatory barriers, supplier concentration risks, limited substitute threat, and competitive rivalry driven by scale and reimbursement pressures. This brief only scratches the surface. Unlock the full Porter's Five Forces Analysis for force-by-force ratings, visuals, and actionable strategy.
Suppliers Bargaining Power
Clinical labor scarcity
Registered nurses, CNAs, therapists and specialist clinicians face a national shortage—estimated at roughly 200,000 RNs near 2025—giving labor suppliers strong leverage over Life Care Centers of America. Wage inflation and greater agency reliance (agency spend reported up ~20% versus pre‑pandemic levels) raise operating costs and reduce scheduling flexibility. Significant retention and training investments are required to curb turnover, while rising union activity and state staffing mandates (which can add several percentage points to payroll) further amplify supplier power.
Agency and temp staffing
Staffing agencies act as price setters during demand spikes or outbreaks, with agency bill rates in 2024 remaining about 20–30% above pre‑pandemic levels, pressuring Life Care Centers margins. Premium bill rates and cancellation fees constrain operational agility and increase labor spend volatility. Diversifying vendors and building internal float pools reduce exposure, while long‑term vendor contracts can trade higher price for staffing reliability.
Pharma and medical supplies
Pharmaceutical distributors, DME suppliers and wound‑care vendors materially influence Life Care Centers of America through input pricing and availability; the top three US pharmaceutical distributors (AmerisourceBergen, Cardinal Health, McKesson) account for roughly 85% of distribution in 2024. Consolidation limits switching options, while GPOs—serving over 90% of U.S. hospitals—secure discounts but can restrict product choice. Recent supply‑chain shocks prompted larger inventory buffers and higher working capital needs.
Technology and EHR vendors
EHR, eMAR and analytics systems create deep workflow dependence and high switching costs; implementations commonly span 3–7 years with substantial training and integration effort.
Interoperability mandates with hospitals and payers raise integration complexity and reinforce vendor lock-in across post-acute networks.
Cybersecurity and regulatory compliance impose recurring costs and continuous vendor oversight; multi-year licenses and hefty implementation fees further strengthen supplier bargaining power.
- Vendor lock-in
- High switching costs
- Recurring cybersecurity spend
- Long license terms
Facilities, food, and utilities
Facilities, food, linens, sanitation and utilities are non-discretionary suppliers for Life Care; foodservice inflation ran about 5.8% year-over-year in 2024 and commercial utility costs rose roughly 4% in 2024, squeezing margins. Local water and power monopolies limit negotiating leverage, while long-term facility maintenance and capex contracts lock operators to specific contractors. Multi-site scale can secure better pricing, typically lowering procurement spend by an estimated 3–8% but cannot eliminate ongoing cost pressure.
- Foodservice inflation: ~5.8% (2024)
- Utilities inflation: ~4% (2024)
- Capex/maintenance: creates supplier lock-in
- Scale savings: ~3–8% procurement improvement
Labor squeeze: RN ≈200,000; agency +20–30%; pharma Top3 ≈85%
Labor shortages (≈200,000 RN gap near 2025) and agency bill rates +20–30% (2024) raise costs and give workers/agencies strong leverage. Pharma distro concentration (Top3 ≈85% of distribution, 2024) and EHR/vendor lock‑in (implementations 3–7 years) limit switching and increase recurring spend; foodservice +5.8% and utilities +4% (2024) further squeeze margins.
| Supplier | 2024 metric | Impact |
|---|---|---|
| Labor | RN gap ≈200k; agency +20–30% | Higher wages, volatility |
| Pharma | Top3 ≈85% | Limited switching |
| Ops | Food +5.8%; Utilities +4% | Margin pressure |
What is included in the product
Detailed Word Document
Tailored exclusively for Life Care Centers of America, this Porter's Five Forces overview uncovers key drivers of competition, buyer and supplier power, and market entry risks, while identifying disruptive substitutes and dynamics that influence pricing, profitability, and strategic positioning.
Customizable Excel Spreadsheet
Clear, one-sheet Porter's Five Forces for Life Care Centers—customizable pressure levels and instant spider/radar visualization to simplify strategic decisions and drop straight into decks or reports.
Customers Bargaining Power
Government payers
Medicare and Medicaid set reimbursement levels that largely determine Life Care Centers of America revenue, since federal payers finance the majority of U.S. nursing facility care; in 2024 Medicaid financed roughly half of nursing facility spending while Medicare accounted for a meaningful share via post-acute SNF stays. Rate cuts, audits and CMS value-based adjustments have increased buyer power and compressed margins. Compliance and heavier documentation raise administrative costs, limiting ability to price above set rates.
Medicare Advantage plans
Medicare Advantage plans, covering over 50% of Medicare beneficiaries in 2024 (~31 million enrollees), exert strong bargaining power by negotiating deeper discounts and imposing utilization controls that compress margins for Life Care Centers of America. Narrow networks and prior authorizations shift both volume and intensity of SNF admissions toward preferred, lower-cost providers. Performance metrics and CMS-linked bonus payments influence plan steerage and referrals. Annual contract renegotiations frequently pressure rates and terms year-to-year.
Hospitals and referral sources
Hospitals, discharge planners and ACOs (covering over 11 million Medicare beneficiaries in 2024) drive post-acute referrals, giving buyer groups concentrated leverage. Preferred networks reward quality, speed-to-admit and outcomes, intensifying switching power. Poor quality scores can cost referrals and revenue. Active relationship management and real-time data sharing reduce dependence and preserve placement volumes.
Residents and families
Private-pay residents, who in mixed-pay skilled nursing facilities represented about 25–40% of revenue in 2024 industry ranges, are highly price sensitive and compare amenities, ratings and proximity when choosing Life Care Centers.
Online reviews and CMS star ratings amplify switching ease; service customization and hospitality raise willingness to pay, while occupancy cycles (U.S. SNF occupancy ~78% in 2023–24) shift resident negotiating leverage over time.
- Price sensitivity: 25–40% revenue share (2024 range)
- Ratings impact: CMS stars + online reviews drive switching
- Willingness to pay: tied to customization & hospitality
- Leverage swings with occupancy (~78% 2023–24)
Case managers and payers’ UM
Case managers and payers' utilization management (UM) tightly control length of stay and therapy intensity, directly impacting LCCA revenue through denials and downgrades; in 2024 Medicare Advantage plans covered over 30 million beneficiaries, amplifying payer leverage. Strong clinical documentation and robust appeals raise revenue recovery and aligning care pathways improves authorization success rates.
- UM controls LOS and therapy intensity
- Denials/downgrades cut revenue realization
- Clinical documentation and appeals mitigate losses
- Care pathway alignment increases authorization approvals
Post-acute squeeze: Medicaid ~50%, MA >30m, margins tight
Buyers (Medicaid ~50% of nursing facility spending 2024; Medicare Advantage >30m enrollees in 2024) exert strong pricing and utilization control, compressing margins and forcing heavy compliance costs. Hospitals/ACOs and case managers steer post-acute referrals; occupancy (~78% 2023–24) and CMS stars drive switching. Private-pay (25–40% revenue) remains price-sensitive.
| Buyer | 2024 stat | Impact |
|---|---|---|
| Medicaid | ~50% funding | Rate-dependent revenue |
| Medicare Advantage | >30m enrollees | Negotiated discounts, UM |
| Private-pay | 25–40% rev | Price-sensitive |
Preview the Actual Deliverable
Life Care Centers of America Porter's Five Forces Analysis
This preview shows the full Porter's Five Forces analysis for Life Care Centers of America and is identical to the file you'll receive. The delivered document is professionally formatted, comprehensive, and ready for immediate use upon purchase. No placeholders or samples—this is the exact deliverable.











