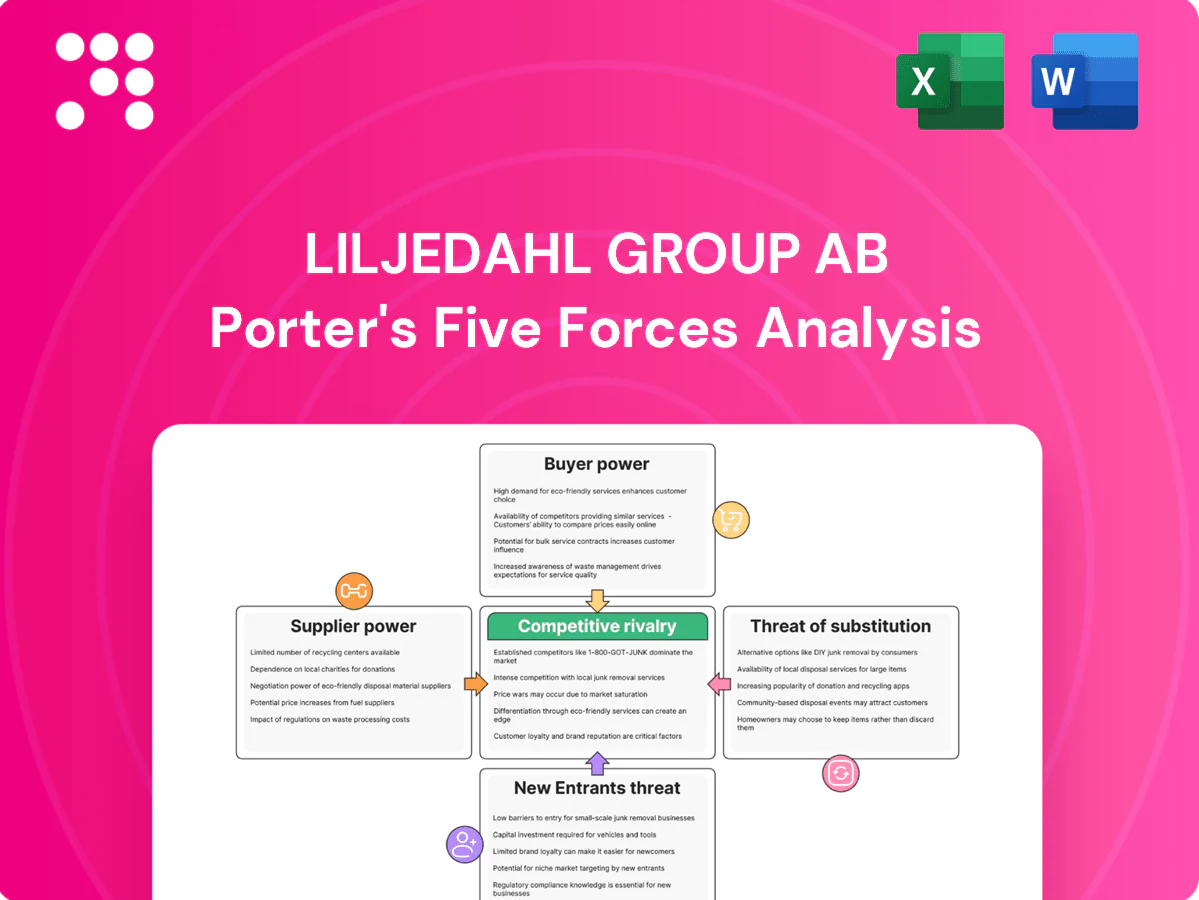
Liljedahl Group AB Porter's Five Forces Analysis

Go Beyond the Preview—Access the Full Strategic Report
Liljedahl Group AB's Porter's Five Forces analysis summarizes competitive dynamics—assessing supplier and buyer power, threat of new entrants, substitutes, and industry rivalry—to reveal strategic pressure points and growth levers. It highlights where the company can defend margins and where market vulnerabilities lie. This brief snapshot only scratches the surface. Unlock the full Porter's Five Forces Analysis to explore Liljedahl Group AB’s competitive dynamics, market pressures, and strategic advantages in detail.
Suppliers Bargaining Power

Concentrated raw material sources
Many Liljedahl portfolio companies rely on copper, aluminum and specialty steels sourced from a handful of global producers; Chile supplied ~28% of mined copper and China ~60% of primary aluminum in 2024, concentrating supply and raising switching costs and supplier pricing power. Long-term offtake contracts reduce price exposure, but market volatility persisted in 2024 and hedging addresses price risk, not availability risk.
Energy and logistics sensitivity
Manufacturing electrical equipment is highly energy intensive and logistics dependent; EU industrial electricity prices averaged about 0.14 EUR/kWh in 2024, while container spot rates declined roughly 30% from 2022 peaks but remain volatile. Power price spikes and tightened freight capacity can rapidly amplify supplier leverage in tight markets, pressuring Liljedahl Group AB margins. Dual-sourcing and regionalization cut exposure, yet sudden energy shocks can still compress margins sharply.

Specialized components and certifications
Critical components for Liljedahl Group such as insulation systems, semiconductors and transformer cores require certified suppliers, and supplier qualification cycles in the electrical equipment industry typically run 6–18 months, granting approved vendors clear bargaining clout. Interchangeability is constrained by standards and warranty specs, while strategic inventory buffers of 90–180 days are used to offset supplier leverage and supply disruptions.

Sustainability and compliance demands
ESG and traceability requirements shift bargaining power to compliant suppliers as CSRD reporting expanded to most large EU firms in 2024, increasing supplier leverage. The EU ETS averaged about €85/ton CO2 in 2024, elevating premiums for low-carbon metals and raising input costs, while audits narrow the supplier pool and add procurement overhead. Early partnerships secure compliant supply at better terms.
- Compliant suppliers gain leverage
- EU ETS ~€85/ton (2024) raises input costs
- Audits shrink pool, increase overhead
- Early partnerships = better terms
Countervailing scale and procurement
Liljedahl leverages countervailing scale by aggregating procurement across packaging, technology and logistics divisions to strengthen negotiation leverage, while category strategies and should-cost models rebalance supplier pricing and margin transparency, and vendor performance programs drive competitive pressure and continuous improvement; co-development agreements trade committed future volumes for lower prices and priority allocation.
- aggregated procurement across divisions
- category strategies + should-cost models
- vendor performance programs
- co-development for volume-backed price/priority
Metals concentration, €85/t EU ETS & €0.14/kWh power boost supplier leverage
Concentrated metal supply (Chile ~28% copper, China ~60% primary aluminum in 2024), EU ETS ~€85/t and electricity ~€0.14/kWh raise supplier leverage; container rates down ~30% vs 2022 but volatile. Qualified suppliers (6–18 months) and 90–180 day inventories limit risk; aggregated procurement, should-cost models and co-development restore bargaining power.
| Metric | 2024 |
|---|---|
| Chile share of copper | ~28% |
| China primary aluminum | ~60% |
| EU ETS price | ~€85/ton |
| EU industrial power | ~€0.14/kWh |
| Container rates vs 2022 | −30% |
What is included in the product
 Detailed Word Document
Concise Porter's Five Forces analysis for Liljedahl Group AB revealing key competitive drivers, supplier and buyer power, threat of new entrants and substitutes, and industry-specific disruptive risks that shape pricing and profitability. Tailored insights highlight barriers protecting incumbency and strategic levers to defend market position and sustain margins.

 Customizable Excel Spreadsheet
Clear one-sheet Porter's Five Forces for Liljedahl Group AB—quickly assess supplier/customer power, substitutes, new entrants and rivalry to relieve strategic uncertainty.
Customers Bargaining Power

Large OEMs and utilities dominate
Key customers for Liljedahl Group AB are large utilities, grid operators and industrial OEMs with professional procurement teams whose scale drives strong price pressure and strict SLAs. Framework agreements and public tenders concentrate spend and intensify competition for contracts. Long-term framework deals often set benchmark pricing across project portfolios. Offering value-added services such as lifecycle maintenance and rapid-response support helps defend margins and differentiate bids.
High qualification and switching costs
Electrical equipment commonly requires certifications such as IEC and UL plus design‑in and field trials that often take 6–12 months, creating inertia that tempers buyer power once components are specified. Lifecycle support and reliability data—industrial lifecycles commonly exceed 10 years—deepen customer lock‑in. Penetrating new accounts therefore remains lengthy and costly, with extended qualification cycles and warranty exposure raising supplier bargaining leverage.

Price transparency in commodities
Buyers increasingly track LME-linked inputs — LME copper averaged about USD 9,000/tonne in 2024 — and demand pass-through clauses to avoid raw-material exposure. Where metal surcharges exist, Liljedahl’s margin capture shifts toward non-material value such as service and engineering. Lead times, on-time delivery and engineering support therefore become key differentiators. Clear indexation to LME prices reduces pricing disputes and claims.

Total cost of ownership focus
Customers now prioritize total cost of ownership—energy efficiency, uptime and maintenance drive buying decisions; 2024 saw roughly a 15% YoY rise in European industrial energy costs, increasing TCO focus and lowering pure price sensitivity.
Bundled services and digital monitoring let Liljedahl capture premiums; documented ROI (typical payback 3–5 years on energy retrofits) strengthens negotiation leverage.
- Energy efficiency reduces TCO
- Uptime/maintenance lower price sensitivity
- Bundled services justify premiums
- Documented ROI improves bargaining
Portfolio diversification of end markets
Portfolio diversification across construction, HVAC, and industrial segments reduces Liljedahl Groups reliance on any single buyer cohort, enabling cross-selling between holdings and diluting customer concentration risk.
However, simultaneous pauses in cyclical capex can synchronize demand drops despite long-term service contracts that help stabilize volumes and recurring revenue.
- Diversified end markets reduce single-buyer exposure
- Cross-selling lowers concentration risk
- Cyclical capex pauses can cause synchronized demand declines
- Long-term service contracts provide volume stability
TCO focus: EU energy +15%, payback 3–5 yr
Large utilities, grid operators and OEMs exert strong price pressure via tenders and frameworks, but 6–12 month qualification cycles and >10-year lifecycles raise switching costs and supplier leverage. Buyers demand LME‑indexed pass‑throughs (LME copper ~USD 9,000/t in 2024) and focus on TCO as European industrial energy rose ~15% YoY in 2024. Bundled services and documented ROI (typical 3–5 year payback) improve Liljedahl’s negotiating position.
| Metric | 2024 Value |
|---|---|
| LME copper | ~USD 9,000/tonne |
| EU industrial energy change | +15% YoY |
| Typical energy retrofit payback | 3–5 years |
Preview the Actual Deliverable
Liljedahl Group AB Porter's Five Forces Analysis
This Porter’s Five Forces analysis of Liljedahl Group AB examines competitive rivalry, supplier and buyer power, threat of substitutes and barriers to entry to clarify strategic positioning and risk. The document shown is the same professionally written analysis you'll receive—fully formatted and ready to use. It’s the exact file available instantly after purchase.

Go Beyond the Preview—Access the Full Strategic Report
Liljedahl Group AB's Porter's Five Forces analysis summarizes competitive dynamics—assessing supplier and buyer power, threat of new entrants, substitutes, and industry rivalry—to reveal strategic pressure points and growth levers. It highlights where the company can defend margins and where market vulnerabilities lie. This brief snapshot only scratches the surface. Unlock the full Porter's Five Forces Analysis to explore Liljedahl Group AB’s competitive dynamics, market pressures, and strategic advantages in detail.
Suppliers Bargaining Power
Concentrated raw material sources
Many Liljedahl portfolio companies rely on copper, aluminum and specialty steels sourced from a handful of global producers; Chile supplied ~28% of mined copper and China ~60% of primary aluminum in 2024, concentrating supply and raising switching costs and supplier pricing power. Long-term offtake contracts reduce price exposure, but market volatility persisted in 2024 and hedging addresses price risk, not availability risk.
Energy and logistics sensitivity
Manufacturing electrical equipment is highly energy intensive and logistics dependent; EU industrial electricity prices averaged about 0.14 EUR/kWh in 2024, while container spot rates declined roughly 30% from 2022 peaks but remain volatile. Power price spikes and tightened freight capacity can rapidly amplify supplier leverage in tight markets, pressuring Liljedahl Group AB margins. Dual-sourcing and regionalization cut exposure, yet sudden energy shocks can still compress margins sharply.
Specialized components and certifications
Critical components for Liljedahl Group such as insulation systems, semiconductors and transformer cores require certified suppliers, and supplier qualification cycles in the electrical equipment industry typically run 6–18 months, granting approved vendors clear bargaining clout. Interchangeability is constrained by standards and warranty specs, while strategic inventory buffers of 90–180 days are used to offset supplier leverage and supply disruptions.
Sustainability and compliance demands
ESG and traceability requirements shift bargaining power to compliant suppliers as CSRD reporting expanded to most large EU firms in 2024, increasing supplier leverage. The EU ETS averaged about €85/ton CO2 in 2024, elevating premiums for low-carbon metals and raising input costs, while audits narrow the supplier pool and add procurement overhead. Early partnerships secure compliant supply at better terms.
- Compliant suppliers gain leverage
- EU ETS ~€85/ton (2024) raises input costs
- Audits shrink pool, increase overhead
- Early partnerships = better terms
Countervailing scale and procurement
Liljedahl leverages countervailing scale by aggregating procurement across packaging, technology and logistics divisions to strengthen negotiation leverage, while category strategies and should-cost models rebalance supplier pricing and margin transparency, and vendor performance programs drive competitive pressure and continuous improvement; co-development agreements trade committed future volumes for lower prices and priority allocation.
- aggregated procurement across divisions
- category strategies + should-cost models
- vendor performance programs
- co-development for volume-backed price/priority
Metals concentration, €85/t EU ETS & €0.14/kWh power boost supplier leverage
Concentrated metal supply (Chile ~28% copper, China ~60% primary aluminum in 2024), EU ETS ~€85/t and electricity ~€0.14/kWh raise supplier leverage; container rates down ~30% vs 2022 but volatile. Qualified suppliers (6–18 months) and 90–180 day inventories limit risk; aggregated procurement, should-cost models and co-development restore bargaining power.
| Metric | 2024 |
|---|---|
| Chile share of copper | ~28% |
| China primary aluminum | ~60% |
| EU ETS price | ~€85/ton |
| EU industrial power | ~€0.14/kWh |
| Container rates vs 2022 | −30% |
What is included in the product
Detailed Word Document
Concise Porter's Five Forces analysis for Liljedahl Group AB revealing key competitive drivers, supplier and buyer power, threat of new entrants and substitutes, and industry-specific disruptive risks that shape pricing and profitability. Tailored insights highlight barriers protecting incumbency and strategic levers to defend market position and sustain margins.
Customizable Excel Spreadsheet
Clear one-sheet Porter's Five Forces for Liljedahl Group AB—quickly assess supplier/customer power, substitutes, new entrants and rivalry to relieve strategic uncertainty.
Customers Bargaining Power
Large OEMs and utilities dominate
Key customers for Liljedahl Group AB are large utilities, grid operators and industrial OEMs with professional procurement teams whose scale drives strong price pressure and strict SLAs. Framework agreements and public tenders concentrate spend and intensify competition for contracts. Long-term framework deals often set benchmark pricing across project portfolios. Offering value-added services such as lifecycle maintenance and rapid-response support helps defend margins and differentiate bids.
High qualification and switching costs
Electrical equipment commonly requires certifications such as IEC and UL plus design‑in and field trials that often take 6–12 months, creating inertia that tempers buyer power once components are specified. Lifecycle support and reliability data—industrial lifecycles commonly exceed 10 years—deepen customer lock‑in. Penetrating new accounts therefore remains lengthy and costly, with extended qualification cycles and warranty exposure raising supplier bargaining leverage.
Price transparency in commodities
Buyers increasingly track LME-linked inputs — LME copper averaged about USD 9,000/tonne in 2024 — and demand pass-through clauses to avoid raw-material exposure. Where metal surcharges exist, Liljedahl’s margin capture shifts toward non-material value such as service and engineering. Lead times, on-time delivery and engineering support therefore become key differentiators. Clear indexation to LME prices reduces pricing disputes and claims.
Total cost of ownership focus
Customers now prioritize total cost of ownership—energy efficiency, uptime and maintenance drive buying decisions; 2024 saw roughly a 15% YoY rise in European industrial energy costs, increasing TCO focus and lowering pure price sensitivity.
Bundled services and digital monitoring let Liljedahl capture premiums; documented ROI (typical payback 3–5 years on energy retrofits) strengthens negotiation leverage.
- Energy efficiency reduces TCO
- Uptime/maintenance lower price sensitivity
- Bundled services justify premiums
- Documented ROI improves bargaining
Portfolio diversification of end markets
Portfolio diversification across construction, HVAC, and industrial segments reduces Liljedahl Groups reliance on any single buyer cohort, enabling cross-selling between holdings and diluting customer concentration risk.
However, simultaneous pauses in cyclical capex can synchronize demand drops despite long-term service contracts that help stabilize volumes and recurring revenue.
- Diversified end markets reduce single-buyer exposure
- Cross-selling lowers concentration risk
- Cyclical capex pauses can cause synchronized demand declines
- Long-term service contracts provide volume stability
TCO focus: EU energy +15%, payback 3–5 yr
Large utilities, grid operators and OEMs exert strong price pressure via tenders and frameworks, but 6–12 month qualification cycles and >10-year lifecycles raise switching costs and supplier leverage. Buyers demand LME‑indexed pass‑throughs (LME copper ~USD 9,000/t in 2024) and focus on TCO as European industrial energy rose ~15% YoY in 2024. Bundled services and documented ROI (typical 3–5 year payback) improve Liljedahl’s negotiating position.
| Metric | 2024 Value |
|---|---|
| LME copper | ~USD 9,000/tonne |
| EU industrial energy change | +15% YoY |
| Typical energy retrofit payback | 3–5 years |
Preview the Actual Deliverable
Liljedahl Group AB Porter's Five Forces Analysis
This Porter’s Five Forces analysis of Liljedahl Group AB examines competitive rivalry, supplier and buyer power, threat of substitutes and barriers to entry to clarify strategic positioning and risk. The document shown is the same professionally written analysis you'll receive—fully formatted and ready to use. It’s the exact file available instantly after purchase.
Original: $10.00
-65%$10.00
$3.50Description
Go Beyond the Preview—Access the Full Strategic Report
Liljedahl Group AB's Porter's Five Forces analysis summarizes competitive dynamics—assessing supplier and buyer power, threat of new entrants, substitutes, and industry rivalry—to reveal strategic pressure points and growth levers. It highlights where the company can defend margins and where market vulnerabilities lie. This brief snapshot only scratches the surface. Unlock the full Porter's Five Forces Analysis to explore Liljedahl Group AB’s competitive dynamics, market pressures, and strategic advantages in detail.
Suppliers Bargaining Power
Concentrated raw material sources
Many Liljedahl portfolio companies rely on copper, aluminum and specialty steels sourced from a handful of global producers; Chile supplied ~28% of mined copper and China ~60% of primary aluminum in 2024, concentrating supply and raising switching costs and supplier pricing power. Long-term offtake contracts reduce price exposure, but market volatility persisted in 2024 and hedging addresses price risk, not availability risk.
Energy and logistics sensitivity
Manufacturing electrical equipment is highly energy intensive and logistics dependent; EU industrial electricity prices averaged about 0.14 EUR/kWh in 2024, while container spot rates declined roughly 30% from 2022 peaks but remain volatile. Power price spikes and tightened freight capacity can rapidly amplify supplier leverage in tight markets, pressuring Liljedahl Group AB margins. Dual-sourcing and regionalization cut exposure, yet sudden energy shocks can still compress margins sharply.
Specialized components and certifications
Critical components for Liljedahl Group such as insulation systems, semiconductors and transformer cores require certified suppliers, and supplier qualification cycles in the electrical equipment industry typically run 6–18 months, granting approved vendors clear bargaining clout. Interchangeability is constrained by standards and warranty specs, while strategic inventory buffers of 90–180 days are used to offset supplier leverage and supply disruptions.
Sustainability and compliance demands
ESG and traceability requirements shift bargaining power to compliant suppliers as CSRD reporting expanded to most large EU firms in 2024, increasing supplier leverage. The EU ETS averaged about €85/ton CO2 in 2024, elevating premiums for low-carbon metals and raising input costs, while audits narrow the supplier pool and add procurement overhead. Early partnerships secure compliant supply at better terms.
- Compliant suppliers gain leverage
- EU ETS ~€85/ton (2024) raises input costs
- Audits shrink pool, increase overhead
- Early partnerships = better terms
Countervailing scale and procurement
Liljedahl leverages countervailing scale by aggregating procurement across packaging, technology and logistics divisions to strengthen negotiation leverage, while category strategies and should-cost models rebalance supplier pricing and margin transparency, and vendor performance programs drive competitive pressure and continuous improvement; co-development agreements trade committed future volumes for lower prices and priority allocation.
- aggregated procurement across divisions
- category strategies + should-cost models
- vendor performance programs
- co-development for volume-backed price/priority
Metals concentration, €85/t EU ETS & €0.14/kWh power boost supplier leverage
Concentrated metal supply (Chile ~28% copper, China ~60% primary aluminum in 2024), EU ETS ~€85/t and electricity ~€0.14/kWh raise supplier leverage; container rates down ~30% vs 2022 but volatile. Qualified suppliers (6–18 months) and 90–180 day inventories limit risk; aggregated procurement, should-cost models and co-development restore bargaining power.
| Metric | 2024 |
|---|---|
| Chile share of copper | ~28% |
| China primary aluminum | ~60% |
| EU ETS price | ~€85/ton |
| EU industrial power | ~€0.14/kWh |
| Container rates vs 2022 | −30% |
What is included in the product
Detailed Word Document
Concise Porter's Five Forces analysis for Liljedahl Group AB revealing key competitive drivers, supplier and buyer power, threat of new entrants and substitutes, and industry-specific disruptive risks that shape pricing and profitability. Tailored insights highlight barriers protecting incumbency and strategic levers to defend market position and sustain margins.
Customizable Excel Spreadsheet
Clear one-sheet Porter's Five Forces for Liljedahl Group AB—quickly assess supplier/customer power, substitutes, new entrants and rivalry to relieve strategic uncertainty.
Customers Bargaining Power
Large OEMs and utilities dominate
Key customers for Liljedahl Group AB are large utilities, grid operators and industrial OEMs with professional procurement teams whose scale drives strong price pressure and strict SLAs. Framework agreements and public tenders concentrate spend and intensify competition for contracts. Long-term framework deals often set benchmark pricing across project portfolios. Offering value-added services such as lifecycle maintenance and rapid-response support helps defend margins and differentiate bids.
High qualification and switching costs
Electrical equipment commonly requires certifications such as IEC and UL plus design‑in and field trials that often take 6–12 months, creating inertia that tempers buyer power once components are specified. Lifecycle support and reliability data—industrial lifecycles commonly exceed 10 years—deepen customer lock‑in. Penetrating new accounts therefore remains lengthy and costly, with extended qualification cycles and warranty exposure raising supplier bargaining leverage.
Price transparency in commodities
Buyers increasingly track LME-linked inputs — LME copper averaged about USD 9,000/tonne in 2024 — and demand pass-through clauses to avoid raw-material exposure. Where metal surcharges exist, Liljedahl’s margin capture shifts toward non-material value such as service and engineering. Lead times, on-time delivery and engineering support therefore become key differentiators. Clear indexation to LME prices reduces pricing disputes and claims.
Total cost of ownership focus
Customers now prioritize total cost of ownership—energy efficiency, uptime and maintenance drive buying decisions; 2024 saw roughly a 15% YoY rise in European industrial energy costs, increasing TCO focus and lowering pure price sensitivity.
Bundled services and digital monitoring let Liljedahl capture premiums; documented ROI (typical payback 3–5 years on energy retrofits) strengthens negotiation leverage.
- Energy efficiency reduces TCO
- Uptime/maintenance lower price sensitivity
- Bundled services justify premiums
- Documented ROI improves bargaining
Portfolio diversification of end markets
Portfolio diversification across construction, HVAC, and industrial segments reduces Liljedahl Groups reliance on any single buyer cohort, enabling cross-selling between holdings and diluting customer concentration risk.
However, simultaneous pauses in cyclical capex can synchronize demand drops despite long-term service contracts that help stabilize volumes and recurring revenue.
- Diversified end markets reduce single-buyer exposure
- Cross-selling lowers concentration risk
- Cyclical capex pauses can cause synchronized demand declines
- Long-term service contracts provide volume stability
TCO focus: EU energy +15%, payback 3–5 yr
Large utilities, grid operators and OEMs exert strong price pressure via tenders and frameworks, but 6–12 month qualification cycles and >10-year lifecycles raise switching costs and supplier leverage. Buyers demand LME‑indexed pass‑throughs (LME copper ~USD 9,000/t in 2024) and focus on TCO as European industrial energy rose ~15% YoY in 2024. Bundled services and documented ROI (typical 3–5 year payback) improve Liljedahl’s negotiating position.
| Metric | 2024 Value |
|---|---|
| LME copper | ~USD 9,000/tonne |
| EU industrial energy change | +15% YoY |
| Typical energy retrofit payback | 3–5 years |
Preview the Actual Deliverable
Liljedahl Group AB Porter's Five Forces Analysis
This Porter’s Five Forces analysis of Liljedahl Group AB examines competitive rivalry, supplier and buyer power, threat of substitutes and barriers to entry to clarify strategic positioning and risk. The document shown is the same professionally written analysis you'll receive—fully formatted and ready to use. It’s the exact file available instantly after purchase.











