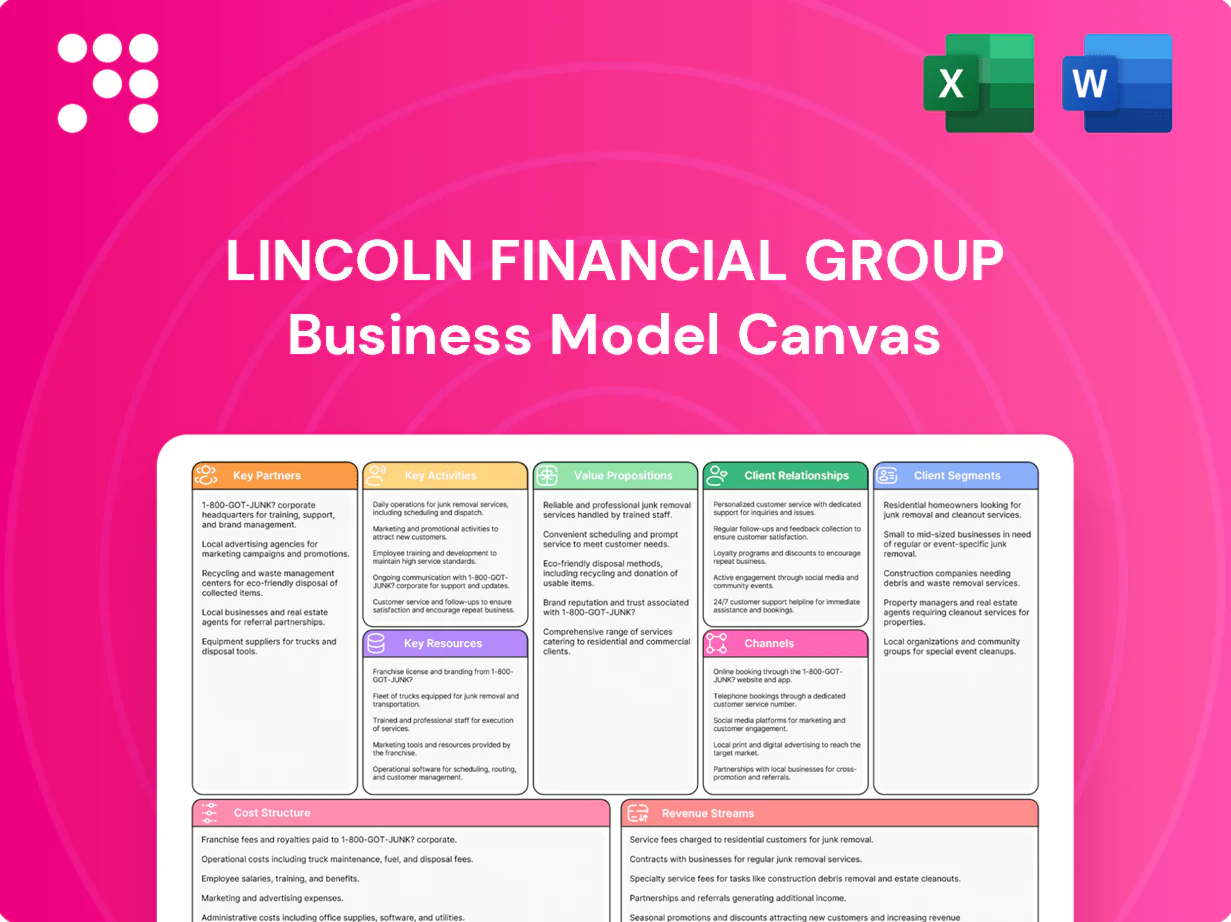
Lincoln Financial Group Business Model Canvas

Business Model Canvas: Strategic Blueprint for a Leading Financial Services Firm
Unlock the full strategic blueprint behind Lincoln Financial Group with our in-depth Business Model Canvas. This concise, professionally written canvas reveals value propositions, revenue streams, key partners, and growth levers in one editable file. Ideal for investors, consultants, and executives seeking actionable insights—download the full Word & Excel versions to benchmark and strategize today.
Partnerships

Independent advisor and broker networks
Independent advisors and broker networks extend Lincoln's reach into retail and workplace markets; in 2024 Lincoln reported over 300 billion dollars in assets under management and administration, underscoring that scale. They deliver personalized guidance that improves product fit and conversion, raising persistency and sales effectiveness. Lincoln backs them with training, digital tools and co-marketing, making these partners critical to scalable, high-quality distribution.
Reinsurers and risk-transfer providers
Reinsurers help Lincoln optimize capital and stabilize earnings volatility by transferring risk, with 2024 reinsurance transactions supporting over $10 billion of long-dated life and annuity guarantees. Partnerships target mortality, longevity and lapse risk sharing to free capacity for product issuance while smoothing earnings. Structured deals are designed to support growth and preserve solvency metrics such as statutory capital and RBC ratios.

Asset managers and ETF providers
Investment partners expand Lincoln's subaccount and model-portfolio options, bringing specialty strategies and scale to variable products. With global ETF assets exceeding $11 trillion in 2024, these partners bolster performance potential and diversification across equity, fixed-income and alternative sleeves. White-labeled strategies are tailored to plan-level risk profiles and retirement goals, while governance frameworks mandate due diligence, manager selection criteria and ongoing monitoring.

Employer benefit brokers and HR platforms
Brokers and HR platforms drive group protection and retirement plan adoption for Lincoln Financial by channeling employer demand and simplifying plan selection. Integration with payroll and enrollment systems streamlines onboarding and reduces administrative time, supporting higher participation. In 2024 U.S. employer-sponsored retirement participation was about 55%, and data connections improve eligibility, billing, and member communications, reducing friction and improving outcomes.
- Broker reach: improves plan distribution
- Payroll integration: faster onboarding
- Data links: better eligibility, billing, comms
Technology, data, and underwriting vendors
Partnerships underpin >$300B AUM/admin, access to ~$11T ETFs
Independent advisors, reinsurers, investment managers, brokers/HR platforms and tech vendors form Lincoln's core partnerships, supporting over $300 billion AUM/administration (2024). Reinsurance deals covered >$10B of guarantees; global ETF market scale ~$11T (2024) expands asset options; US employer retirement participation ~55% (2024), driving distribution and payroll integrations.
| Metric | 2024 |
|---|---|
| AUM/admin | >$300B |
| Reinsurance support | >$10B |
| Global ETF assets | ~$11T |
| Employer retirement participation | ~55% |
What is included in the product
 Detailed Word Document
A comprehensive Business Model Canvas for Lincoln Financial Group detailing customer segments (individuals, employers, institutions), value propositions (retirement plans, life insurance, annuities, wealth management), channels, revenue streams, key activities, resources and partners, plus competitive advantages and SWOT-linked insights. Designed for analysts, investors, and executives to inform strategy, presentations, and funding decisions.

 Customizable Excel Spreadsheet
Condenses Lincoln Financial Group’s complex insurance, retirement, and asset-management strategy into a clean, editable one-page canvas that saves hours of analysis and makes it easy for teams to compare, adapt, and present core business components.
Activities

Product design and actuarial pricing
Lincoln designs life, annuity, group protection and retirement solutions using actuarial models that set rates, riders and guarantee costs; in 2024 pricing assumes a Fed funds range ~5.25–5.50% and 10‑yr Treasury near 4.2%, shaping reserve and guarantee assumptions. Competitive analysis benchmarks product yields and features versus peers to ensure differentiation and regulatory compliance. Continuous iteration updates pricing as rates and market demand shift.
Underwriting and risk management
Underwriting assesses mortality, morbidity, longevity and lapse risks using data-driven models that balance speed and accuracy to control claim volatility and persistency trends. Hedge and ALM programs manage interest-rate and market exposures—critical as the 10-year U.S. Treasury averaged ~4.3% in 2024 and equities (S&P 500) returned ~24% that year. Governance frameworks enforce risk appetite, capital targets and stress testing to preserve solvency and fund obligations.

Distribution enablement and sales
Recruiting and supporting over 15,000 advisors, brokers and institutional partners, Lincoln equips them with illustrations, proposal tools and ongoing sales training to drive product placement and client retention.
Targeted campaigns focus on key segments and life events (retirement, wealth transfer), while centralized analytics measure pipeline, conversion and persistency—tracking quarterly conversion uplift and persistency rates to optimize channel ROI.

Investment and asset-liability management
Investment and asset-liability management at Lincoln Financial Group focuses on managing general account portfolios for yield and liquidity, aligning duration and cash flows with liabilities, and allocating across public and private markets within established risk limits to optimize spreads while preserving credit quality.
- Manage general account for yield/liquidity
- Align duration/cash flows to liabilities
- Allocate public/private within risk limits
- Optimize spreads, preserve credit quality
Servicing, claims, and compliance
Operate call centers, digital portals and policy-administration platforms to support ~11,000 employees (2024); process claims rapidly with fair adjudication, layered fraud controls and SLA monitoring; maintain regulatory filings, disclosures and ERISA/fiduciary duties across jurisdictions; elevate CX via automation, analytics and continuous improvement cycles.
2024 life and annuity pricing: Fed funds 5.25–5.50%, 10‑yr ~4.2–4.3%, >15k advisors
Lincoln prices life, annuity and retirement products using actuarial models with 2024 assumptions: Fed funds 5.25–5.50% and 10‑yr Treasury ~4.2–4.3%; underwriting, ALM and hedges manage mortality, longevity, interest-rate and market risk; distribution supports >15,000 advisors and ~11,000 employees to drive sales, CX and claims processing.
| Metric | 2024 |
|---|---|
| Advisors | >15,000 |
| Employees | ~11,000 |
| 10‑yr Treasury | 4.2–4.3% |
What You See Is What You Get
Business Model Canvas
The Lincoln Financial Group Business Model Canvas preview shown here is the actual deliverable, not a mockup. When you purchase, you’ll receive this same complete document formatted and editable for immediate use. Files are provided in Word and Excel so you can present, edit, or share without change.

Business Model Canvas: Strategic Blueprint for a Leading Financial Services Firm
Unlock the full strategic blueprint behind Lincoln Financial Group with our in-depth Business Model Canvas. This concise, professionally written canvas reveals value propositions, revenue streams, key partners, and growth levers in one editable file. Ideal for investors, consultants, and executives seeking actionable insights—download the full Word & Excel versions to benchmark and strategize today.
Partnerships
Independent advisor and broker networks
Independent advisors and broker networks extend Lincoln's reach into retail and workplace markets; in 2024 Lincoln reported over 300 billion dollars in assets under management and administration, underscoring that scale. They deliver personalized guidance that improves product fit and conversion, raising persistency and sales effectiveness. Lincoln backs them with training, digital tools and co-marketing, making these partners critical to scalable, high-quality distribution.
Reinsurers and risk-transfer providers
Reinsurers help Lincoln optimize capital and stabilize earnings volatility by transferring risk, with 2024 reinsurance transactions supporting over $10 billion of long-dated life and annuity guarantees. Partnerships target mortality, longevity and lapse risk sharing to free capacity for product issuance while smoothing earnings. Structured deals are designed to support growth and preserve solvency metrics such as statutory capital and RBC ratios.
Asset managers and ETF providers
Investment partners expand Lincoln's subaccount and model-portfolio options, bringing specialty strategies and scale to variable products. With global ETF assets exceeding $11 trillion in 2024, these partners bolster performance potential and diversification across equity, fixed-income and alternative sleeves. White-labeled strategies are tailored to plan-level risk profiles and retirement goals, while governance frameworks mandate due diligence, manager selection criteria and ongoing monitoring.
Employer benefit brokers and HR platforms
Brokers and HR platforms drive group protection and retirement plan adoption for Lincoln Financial by channeling employer demand and simplifying plan selection. Integration with payroll and enrollment systems streamlines onboarding and reduces administrative time, supporting higher participation. In 2024 U.S. employer-sponsored retirement participation was about 55%, and data connections improve eligibility, billing, and member communications, reducing friction and improving outcomes.
- Broker reach: improves plan distribution
- Payroll integration: faster onboarding
- Data links: better eligibility, billing, comms
Technology, data, and underwriting vendors
Partnerships underpin >$300B AUM/admin, access to ~$11T ETFs
Independent advisors, reinsurers, investment managers, brokers/HR platforms and tech vendors form Lincoln's core partnerships, supporting over $300 billion AUM/administration (2024). Reinsurance deals covered >$10B of guarantees; global ETF market scale ~$11T (2024) expands asset options; US employer retirement participation ~55% (2024), driving distribution and payroll integrations.
| Metric | 2024 |
|---|---|
| AUM/admin | >$300B |
| Reinsurance support | >$10B |
| Global ETF assets | ~$11T |
| Employer retirement participation | ~55% |
What is included in the product
Detailed Word Document
A comprehensive Business Model Canvas for Lincoln Financial Group detailing customer segments (individuals, employers, institutions), value propositions (retirement plans, life insurance, annuities, wealth management), channels, revenue streams, key activities, resources and partners, plus competitive advantages and SWOT-linked insights. Designed for analysts, investors, and executives to inform strategy, presentations, and funding decisions.
Customizable Excel Spreadsheet
Condenses Lincoln Financial Group’s complex insurance, retirement, and asset-management strategy into a clean, editable one-page canvas that saves hours of analysis and makes it easy for teams to compare, adapt, and present core business components.
Activities
Product design and actuarial pricing
Lincoln designs life, annuity, group protection and retirement solutions using actuarial models that set rates, riders and guarantee costs; in 2024 pricing assumes a Fed funds range ~5.25–5.50% and 10‑yr Treasury near 4.2%, shaping reserve and guarantee assumptions. Competitive analysis benchmarks product yields and features versus peers to ensure differentiation and regulatory compliance. Continuous iteration updates pricing as rates and market demand shift.
Underwriting and risk management
Underwriting assesses mortality, morbidity, longevity and lapse risks using data-driven models that balance speed and accuracy to control claim volatility and persistency trends. Hedge and ALM programs manage interest-rate and market exposures—critical as the 10-year U.S. Treasury averaged ~4.3% in 2024 and equities (S&P 500) returned ~24% that year. Governance frameworks enforce risk appetite, capital targets and stress testing to preserve solvency and fund obligations.
Distribution enablement and sales
Recruiting and supporting over 15,000 advisors, brokers and institutional partners, Lincoln equips them with illustrations, proposal tools and ongoing sales training to drive product placement and client retention.
Targeted campaigns focus on key segments and life events (retirement, wealth transfer), while centralized analytics measure pipeline, conversion and persistency—tracking quarterly conversion uplift and persistency rates to optimize channel ROI.
Investment and asset-liability management
Investment and asset-liability management at Lincoln Financial Group focuses on managing general account portfolios for yield and liquidity, aligning duration and cash flows with liabilities, and allocating across public and private markets within established risk limits to optimize spreads while preserving credit quality.
- Manage general account for yield/liquidity
- Align duration/cash flows to liabilities
- Allocate public/private within risk limits
- Optimize spreads, preserve credit quality
Servicing, claims, and compliance
Operate call centers, digital portals and policy-administration platforms to support ~11,000 employees (2024); process claims rapidly with fair adjudication, layered fraud controls and SLA monitoring; maintain regulatory filings, disclosures and ERISA/fiduciary duties across jurisdictions; elevate CX via automation, analytics and continuous improvement cycles.
2024 life and annuity pricing: Fed funds 5.25–5.50%, 10‑yr ~4.2–4.3%, >15k advisors
Lincoln prices life, annuity and retirement products using actuarial models with 2024 assumptions: Fed funds 5.25–5.50% and 10‑yr Treasury ~4.2–4.3%; underwriting, ALM and hedges manage mortality, longevity, interest-rate and market risk; distribution supports >15,000 advisors and ~11,000 employees to drive sales, CX and claims processing.
| Metric | 2024 |
|---|---|
| Advisors | >15,000 |
| Employees | ~11,000 |
| 10‑yr Treasury | 4.2–4.3% |
What You See Is What You Get
Business Model Canvas
The Lincoln Financial Group Business Model Canvas preview shown here is the actual deliverable, not a mockup. When you purchase, you’ll receive this same complete document formatted and editable for immediate use. Files are provided in Word and Excel so you can present, edit, or share without change.
Description
Business Model Canvas: Strategic Blueprint for a Leading Financial Services Firm
Unlock the full strategic blueprint behind Lincoln Financial Group with our in-depth Business Model Canvas. This concise, professionally written canvas reveals value propositions, revenue streams, key partners, and growth levers in one editable file. Ideal for investors, consultants, and executives seeking actionable insights—download the full Word & Excel versions to benchmark and strategize today.
Partnerships
Independent advisor and broker networks
Independent advisors and broker networks extend Lincoln's reach into retail and workplace markets; in 2024 Lincoln reported over 300 billion dollars in assets under management and administration, underscoring that scale. They deliver personalized guidance that improves product fit and conversion, raising persistency and sales effectiveness. Lincoln backs them with training, digital tools and co-marketing, making these partners critical to scalable, high-quality distribution.
Reinsurers and risk-transfer providers
Reinsurers help Lincoln optimize capital and stabilize earnings volatility by transferring risk, with 2024 reinsurance transactions supporting over $10 billion of long-dated life and annuity guarantees. Partnerships target mortality, longevity and lapse risk sharing to free capacity for product issuance while smoothing earnings. Structured deals are designed to support growth and preserve solvency metrics such as statutory capital and RBC ratios.
Asset managers and ETF providers
Investment partners expand Lincoln's subaccount and model-portfolio options, bringing specialty strategies and scale to variable products. With global ETF assets exceeding $11 trillion in 2024, these partners bolster performance potential and diversification across equity, fixed-income and alternative sleeves. White-labeled strategies are tailored to plan-level risk profiles and retirement goals, while governance frameworks mandate due diligence, manager selection criteria and ongoing monitoring.
Employer benefit brokers and HR platforms
Brokers and HR platforms drive group protection and retirement plan adoption for Lincoln Financial by channeling employer demand and simplifying plan selection. Integration with payroll and enrollment systems streamlines onboarding and reduces administrative time, supporting higher participation. In 2024 U.S. employer-sponsored retirement participation was about 55%, and data connections improve eligibility, billing, and member communications, reducing friction and improving outcomes.
- Broker reach: improves plan distribution
- Payroll integration: faster onboarding
- Data links: better eligibility, billing, comms
Technology, data, and underwriting vendors
Partnerships underpin >$300B AUM/admin, access to ~$11T ETFs
Independent advisors, reinsurers, investment managers, brokers/HR platforms and tech vendors form Lincoln's core partnerships, supporting over $300 billion AUM/administration (2024). Reinsurance deals covered >$10B of guarantees; global ETF market scale ~$11T (2024) expands asset options; US employer retirement participation ~55% (2024), driving distribution and payroll integrations.
| Metric | 2024 |
|---|---|
| AUM/admin | >$300B |
| Reinsurance support | >$10B |
| Global ETF assets | ~$11T |
| Employer retirement participation | ~55% |
What is included in the product
Detailed Word Document
A comprehensive Business Model Canvas for Lincoln Financial Group detailing customer segments (individuals, employers, institutions), value propositions (retirement plans, life insurance, annuities, wealth management), channels, revenue streams, key activities, resources and partners, plus competitive advantages and SWOT-linked insights. Designed for analysts, investors, and executives to inform strategy, presentations, and funding decisions.
Customizable Excel Spreadsheet
Condenses Lincoln Financial Group’s complex insurance, retirement, and asset-management strategy into a clean, editable one-page canvas that saves hours of analysis and makes it easy for teams to compare, adapt, and present core business components.
Activities
Product design and actuarial pricing
Lincoln designs life, annuity, group protection and retirement solutions using actuarial models that set rates, riders and guarantee costs; in 2024 pricing assumes a Fed funds range ~5.25–5.50% and 10‑yr Treasury near 4.2%, shaping reserve and guarantee assumptions. Competitive analysis benchmarks product yields and features versus peers to ensure differentiation and regulatory compliance. Continuous iteration updates pricing as rates and market demand shift.
Underwriting and risk management
Underwriting assesses mortality, morbidity, longevity and lapse risks using data-driven models that balance speed and accuracy to control claim volatility and persistency trends. Hedge and ALM programs manage interest-rate and market exposures—critical as the 10-year U.S. Treasury averaged ~4.3% in 2024 and equities (S&P 500) returned ~24% that year. Governance frameworks enforce risk appetite, capital targets and stress testing to preserve solvency and fund obligations.
Distribution enablement and sales
Recruiting and supporting over 15,000 advisors, brokers and institutional partners, Lincoln equips them with illustrations, proposal tools and ongoing sales training to drive product placement and client retention.
Targeted campaigns focus on key segments and life events (retirement, wealth transfer), while centralized analytics measure pipeline, conversion and persistency—tracking quarterly conversion uplift and persistency rates to optimize channel ROI.
Investment and asset-liability management
Investment and asset-liability management at Lincoln Financial Group focuses on managing general account portfolios for yield and liquidity, aligning duration and cash flows with liabilities, and allocating across public and private markets within established risk limits to optimize spreads while preserving credit quality.
- Manage general account for yield/liquidity
- Align duration/cash flows to liabilities
- Allocate public/private within risk limits
- Optimize spreads, preserve credit quality
Servicing, claims, and compliance
Operate call centers, digital portals and policy-administration platforms to support ~11,000 employees (2024); process claims rapidly with fair adjudication, layered fraud controls and SLA monitoring; maintain regulatory filings, disclosures and ERISA/fiduciary duties across jurisdictions; elevate CX via automation, analytics and continuous improvement cycles.
2024 life and annuity pricing: Fed funds 5.25–5.50%, 10‑yr ~4.2–4.3%, >15k advisors
Lincoln prices life, annuity and retirement products using actuarial models with 2024 assumptions: Fed funds 5.25–5.50% and 10‑yr Treasury ~4.2–4.3%; underwriting, ALM and hedges manage mortality, longevity, interest-rate and market risk; distribution supports >15,000 advisors and ~11,000 employees to drive sales, CX and claims processing.
| Metric | 2024 |
|---|---|
| Advisors | >15,000 |
| Employees | ~11,000 |
| 10‑yr Treasury | 4.2–4.3% |
What You See Is What You Get
Business Model Canvas
The Lincoln Financial Group Business Model Canvas preview shown here is the actual deliverable, not a mockup. When you purchase, you’ll receive this same complete document formatted and editable for immediate use. Files are provided in Word and Excel so you can present, edit, or share without change.











