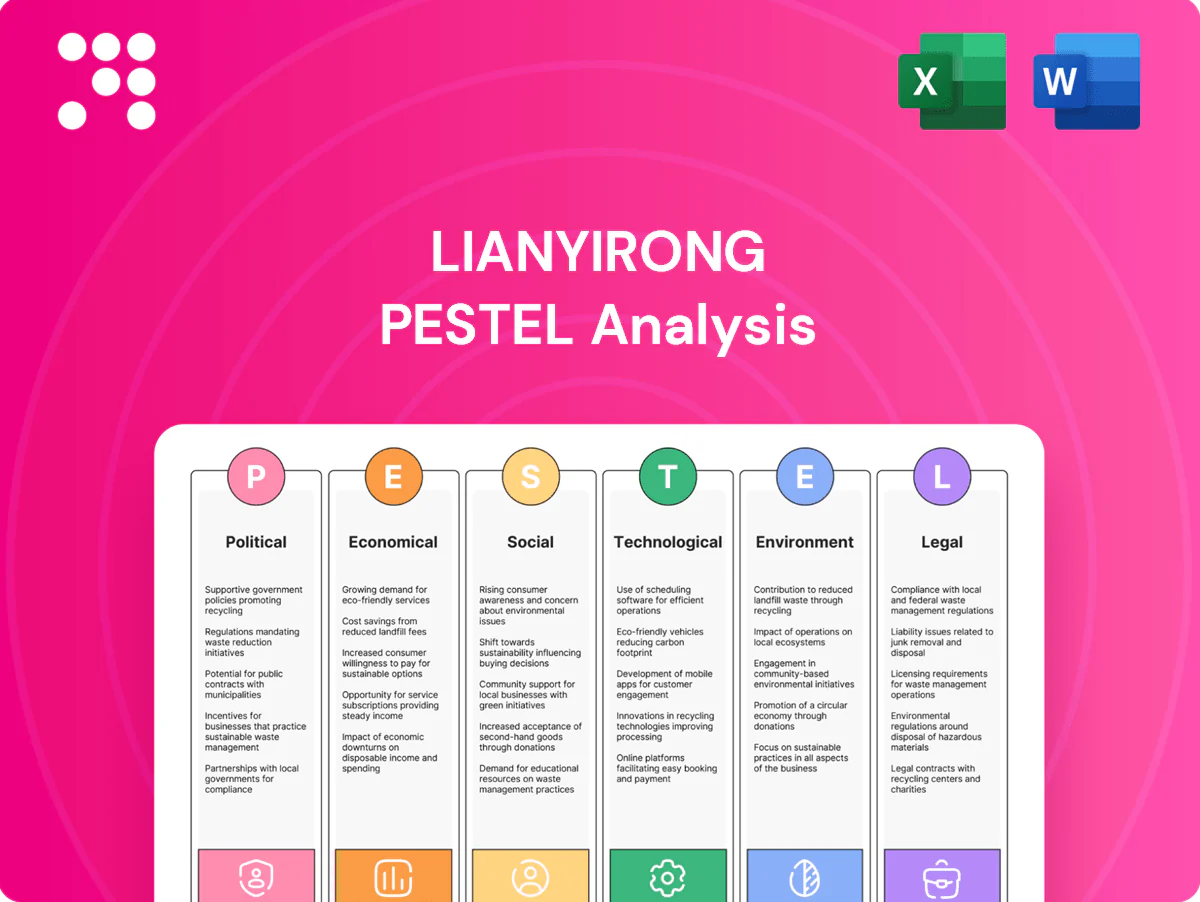
Lianyirong PESTLE Analysis

Make Smarter Strategic Decisions with a Complete PESTEL View
Gain a competitive edge with our PESTLE Analysis of Lianyirong. Uncover how political, economic, social, technological, legal and environmental forces shape its strategy and risks. Purchase the full report for actionable insights and ready-to-use charts.
Political factors

Geopolitical trade tensions
US‑China frictions (including the 2018 tariffs on roughly 360 billion USD of Chinese goods and tightened US semiconductor export controls since Oct 2022) disrupt cross‑border flows Lianyirong serves, forcing route diversification and dual‑market models; policy shocks raise onboarding/compliance costs (banks report AML/KYC cost increases near 10–30%), so proactive sanctions screening and country‑risk models are essential to mitigate disruptions.
Government digital finance support
Many governments actively promote fintech, e‑invoicing and digital trade infrastructure; EU Directive 2014/55/EU mandates e‑invoicing in public procurement and over 60 countries had national e‑invoicing programs by 2024. Subsidies, regulatory sandboxes and public platforms reduce integration barriers for cloud plug‑and‑play solutions and lower upfront costs. Participation in government pilots such as e‑customs accelerates adoption and alignment with national digital strategies strengthens policy resilience.

Belt & Road and trade corridors
Policy-backed Belt and Road corridors have mobilized over $1 trillion in commitments since 2013, shaping sustained demand for supply chain finance in emerging markets. Public investment in ports and logistics raises transaction volumes addressable by AI credit while the global trade finance gap remains about $1.5 trillion. Elevated political risk across corridor states necessitates adaptive risk pricing, and local partnerships unlock policy goodwill and market access.

Data localization mandates
Data localization mandates push Lianyirong to favour multi-region clouds and sovereign deployments as table stakes, with 64 countries enforcing local data rules (2024) and 70% of enterprises expected to use multicloud by 2025. Sudden political shifts can tighten residency rules, raising infrastructure and compliance costs by an estimated 20–25%, while clear residency blueprints reassure regulators and clients.
- Rising digital sovereignty: 64 countries (2024)
- Multicloud adoption: 70% enterprises by 2025
- Cost impact: +20–25% compliance/infrastructure
Industrial policy on AI chips
Industrial policy on AI chips shapes LDP‑GPT access: US/EU export controls since 2022 and the US CHIPS Act ($52B) alter high‑end compute availability; capacity constraints with lead times of 12–18 months slow training and inference scaling; political bias for domestic AI stacks steers procurement toward compliant suppliers; diversified vendors and on‑prem hardware de‑risk supply.
- Export controls: restrict high‑end GPUs
- Subsidies: CHIPS Act $52B
- Capacity: 12–18 month lead times
- Mitigation: diversified vendors + on‑prem
US-China frictions, data rules and CHIPS raise compliance and infrastructure costs across trade
US‑China frictions (2018 tariffs on ~360B USD; export controls since Oct 2022) raise compliance costs (AML/KYC +10–30%) and force route diversification. Governments push e‑invoicing (60+ countries by 2024) and BRI investment (>1T USD) boosting trade finance (gap ~1.5T USD). Data localization (64 countries, 2024) and CHIPS Act $52B constrain cloud/AI capacity, adding ~20–25% infrastructure cost.
| Metric | Value |
|---|---|
| US tariffs (2018) | ~360B USD |
| Data localization (2024) | 64 countries |
| Trade finance gap | ~1.5T USD |
| CHIPS Act | 52B USD |
What is included in the product
 Detailed Word Document
Provides a concise, data-backed PESTLE assessment of Lianyirong across Political, Economic, Social, Technological, Environmental, and Legal dimensions, reflecting regional and industry-specific dynamics; designed to help executives, consultants, and investors identify risks, opportunities, and forward-looking scenarios for strategic planning and funding decisions.

 Customizable Excel Spreadsheet
A concise, visually segmented PESTLE summary of Lianyirong that simplifies external risk assessment for meetings and presentations, is easily editable for regional or business-specific notes, and shareable across teams for quick alignment.
Economic factors

Global interest rate cycles
Global policy rates peaked around 5–6% in 2023–24, elevating funding costs and stressing supply‑chain borrowers; AI‑driven risk differentiation and dynamic pricing (industry reports show revenue uplifts of roughly 3–8% in 2024) can protect margins. Rate cuts in 2025 are reviving trade volumes and credit uptake, while hedging and flexible pricing models preserve competitiveness across cycles.
SME financing gap
Trade-linked SMEs face persistent credit frictions despite robust order books; SMEs represent about 90% of firms and 50% of employment worldwide, yet the SME financing gap was estimated at $5.2 trillion by IFC (2019) and the trade finance gap near $1.5 trillion per ICC (2020–21). Alternative data and invoice-level analytics have raised approval rates and reduced defaults in pilots, enabling faster decisions. Lianyirong can monetize by expanding approved limits and faster turnarounds, driving network effects as more suppliers integrate.

FX and commodity volatility
Currency swings and commodity shocks (DXY peaked near 114 in 2022) directly erode receivables quality as realized cashflows diverge; real‑time exposure mapping across buyers and geographies is therefore critical to triage risk. Dynamic covenants tied to hedging behavior lower default rates, while embedded FX tools create fee revenue and customer stickiness.

Reshoring and supply chain reconfiguration
Reshoring and nearshoring are reshaping trade lanes, counterparties and document flows, forcing platforms to onboard new suppliers and logistics nodes rapidly; payments providers like Stripe and Adyen demonstrate API onboarding in minutes, cutting integration time from weeks to days. Credit models need transfer learning to handle unfamiliar markets, while agile APIs and agent workflows shorten time‑to‑finance.
- nearshoring: alters trade lanes & docs
- onboarding: APIs reduce weeks→days
- credit: transfer learning required
- finance: agent workflows speed funding
Trade growth and e‑commerce
Digitally native exporters scale faster as global e‑commerce surpassed $6 trillion in 2024, driving acute need for automated working capital to fund inventory and logistics.
Cross‑border marketplaces, now handling over 20% of online flows, create structured transaction and SKU data ideal for AI underwriting and risk pricing.
Volume‑based pricing and platform partnerships accelerate distribution and align financing costs with seller growth.
- data: global e‑commerce >$6T (2024)
- marketplaces: >20% cross‑border flows
- need: automated working capital
- advantage: AI underwriting from structured data
US-China frictions, data rules and CHIPS raise compliance and infrastructure costs across trade
Higher policy rates (5–6% peak 2023–24) raised funding costs while 2025 rate cuts revive trade; SME financing gap ~$5.2T (IFC) and trade finance gap ~$1.5T (ICC) keep demand for working capital. Global e‑commerce >$6T (2024) and marketplaces >20% of flows enable AI underwriting; FX volatility (DXY ~114 peak 2022) heightens receivables risk.
| Metric | Value |
|---|---|
| Policy rates peak | 5–6% (2023–24) |
| SME finance gap | $5.2T (IFC) |
| Trade finance gap | $1.5T (ICC) |
| Global e‑commerce | $6T+ (2024) |
| Marketplaces share | >20% |
| DXY peak | ≈114 (2022) |
Same Document Delivered
Lianyirong PESTLE Analysis
The Lianyirong PESTLE Analysis preview shown here is the exact document you’ll receive after purchase—fully formatted, professionally structured, and ready to use. It contains the complete Political, Economic, Social, Technological, Legal, and Environmental assessment as presented, with no placeholders or hidden content. After checkout you’ll instantly download this identical, finished file.

Make Smarter Strategic Decisions with a Complete PESTEL View
Gain a competitive edge with our PESTLE Analysis of Lianyirong. Uncover how political, economic, social, technological, legal and environmental forces shape its strategy and risks. Purchase the full report for actionable insights and ready-to-use charts.
Political factors
Geopolitical trade tensions
US‑China frictions (including the 2018 tariffs on roughly 360 billion USD of Chinese goods and tightened US semiconductor export controls since Oct 2022) disrupt cross‑border flows Lianyirong serves, forcing route diversification and dual‑market models; policy shocks raise onboarding/compliance costs (banks report AML/KYC cost increases near 10–30%), so proactive sanctions screening and country‑risk models are essential to mitigate disruptions.
Government digital finance support
Many governments actively promote fintech, e‑invoicing and digital trade infrastructure; EU Directive 2014/55/EU mandates e‑invoicing in public procurement and over 60 countries had national e‑invoicing programs by 2024. Subsidies, regulatory sandboxes and public platforms reduce integration barriers for cloud plug‑and‑play solutions and lower upfront costs. Participation in government pilots such as e‑customs accelerates adoption and alignment with national digital strategies strengthens policy resilience.
Belt & Road and trade corridors
Policy-backed Belt and Road corridors have mobilized over $1 trillion in commitments since 2013, shaping sustained demand for supply chain finance in emerging markets. Public investment in ports and logistics raises transaction volumes addressable by AI credit while the global trade finance gap remains about $1.5 trillion. Elevated political risk across corridor states necessitates adaptive risk pricing, and local partnerships unlock policy goodwill and market access.
Data localization mandates
Data localization mandates push Lianyirong to favour multi-region clouds and sovereign deployments as table stakes, with 64 countries enforcing local data rules (2024) and 70% of enterprises expected to use multicloud by 2025. Sudden political shifts can tighten residency rules, raising infrastructure and compliance costs by an estimated 20–25%, while clear residency blueprints reassure regulators and clients.
- Rising digital sovereignty: 64 countries (2024)
- Multicloud adoption: 70% enterprises by 2025
- Cost impact: +20–25% compliance/infrastructure
Industrial policy on AI chips
Industrial policy on AI chips shapes LDP‑GPT access: US/EU export controls since 2022 and the US CHIPS Act ($52B) alter high‑end compute availability; capacity constraints with lead times of 12–18 months slow training and inference scaling; political bias for domestic AI stacks steers procurement toward compliant suppliers; diversified vendors and on‑prem hardware de‑risk supply.
- Export controls: restrict high‑end GPUs
- Subsidies: CHIPS Act $52B
- Capacity: 12–18 month lead times
- Mitigation: diversified vendors + on‑prem
US-China frictions, data rules and CHIPS raise compliance and infrastructure costs across trade
US‑China frictions (2018 tariffs on ~360B USD; export controls since Oct 2022) raise compliance costs (AML/KYC +10–30%) and force route diversification. Governments push e‑invoicing (60+ countries by 2024) and BRI investment (>1T USD) boosting trade finance (gap ~1.5T USD). Data localization (64 countries, 2024) and CHIPS Act $52B constrain cloud/AI capacity, adding ~20–25% infrastructure cost.
| Metric | Value |
|---|---|
| US tariffs (2018) | ~360B USD |
| Data localization (2024) | 64 countries |
| Trade finance gap | ~1.5T USD |
| CHIPS Act | 52B USD |
What is included in the product
Detailed Word Document
Provides a concise, data-backed PESTLE assessment of Lianyirong across Political, Economic, Social, Technological, Environmental, and Legal dimensions, reflecting regional and industry-specific dynamics; designed to help executives, consultants, and investors identify risks, opportunities, and forward-looking scenarios for strategic planning and funding decisions.
Customizable Excel Spreadsheet
A concise, visually segmented PESTLE summary of Lianyirong that simplifies external risk assessment for meetings and presentations, is easily editable for regional or business-specific notes, and shareable across teams for quick alignment.
Economic factors
Global interest rate cycles
Global policy rates peaked around 5–6% in 2023–24, elevating funding costs and stressing supply‑chain borrowers; AI‑driven risk differentiation and dynamic pricing (industry reports show revenue uplifts of roughly 3–8% in 2024) can protect margins. Rate cuts in 2025 are reviving trade volumes and credit uptake, while hedging and flexible pricing models preserve competitiveness across cycles.
SME financing gap
Trade-linked SMEs face persistent credit frictions despite robust order books; SMEs represent about 90% of firms and 50% of employment worldwide, yet the SME financing gap was estimated at $5.2 trillion by IFC (2019) and the trade finance gap near $1.5 trillion per ICC (2020–21). Alternative data and invoice-level analytics have raised approval rates and reduced defaults in pilots, enabling faster decisions. Lianyirong can monetize by expanding approved limits and faster turnarounds, driving network effects as more suppliers integrate.
FX and commodity volatility
Currency swings and commodity shocks (DXY peaked near 114 in 2022) directly erode receivables quality as realized cashflows diverge; real‑time exposure mapping across buyers and geographies is therefore critical to triage risk. Dynamic covenants tied to hedging behavior lower default rates, while embedded FX tools create fee revenue and customer stickiness.
Reshoring and supply chain reconfiguration
Reshoring and nearshoring are reshaping trade lanes, counterparties and document flows, forcing platforms to onboard new suppliers and logistics nodes rapidly; payments providers like Stripe and Adyen demonstrate API onboarding in minutes, cutting integration time from weeks to days. Credit models need transfer learning to handle unfamiliar markets, while agile APIs and agent workflows shorten time‑to‑finance.
- nearshoring: alters trade lanes & docs
- onboarding: APIs reduce weeks→days
- credit: transfer learning required
- finance: agent workflows speed funding
Trade growth and e‑commerce
Digitally native exporters scale faster as global e‑commerce surpassed $6 trillion in 2024, driving acute need for automated working capital to fund inventory and logistics.
Cross‑border marketplaces, now handling over 20% of online flows, create structured transaction and SKU data ideal for AI underwriting and risk pricing.
Volume‑based pricing and platform partnerships accelerate distribution and align financing costs with seller growth.
- data: global e‑commerce >$6T (2024)
- marketplaces: >20% cross‑border flows
- need: automated working capital
- advantage: AI underwriting from structured data
US-China frictions, data rules and CHIPS raise compliance and infrastructure costs across trade
Higher policy rates (5–6% peak 2023–24) raised funding costs while 2025 rate cuts revive trade; SME financing gap ~$5.2T (IFC) and trade finance gap ~$1.5T (ICC) keep demand for working capital. Global e‑commerce >$6T (2024) and marketplaces >20% of flows enable AI underwriting; FX volatility (DXY ~114 peak 2022) heightens receivables risk.
| Metric | Value |
|---|---|
| Policy rates peak | 5–6% (2023–24) |
| SME finance gap | $5.2T (IFC) |
| Trade finance gap | $1.5T (ICC) |
| Global e‑commerce | $6T+ (2024) |
| Marketplaces share | >20% |
| DXY peak | ≈114 (2022) |
Same Document Delivered
Lianyirong PESTLE Analysis
The Lianyirong PESTLE Analysis preview shown here is the exact document you’ll receive after purchase—fully formatted, professionally structured, and ready to use. It contains the complete Political, Economic, Social, Technological, Legal, and Environmental assessment as presented, with no placeholders or hidden content. After checkout you’ll instantly download this identical, finished file.
Original: $10.00
-65%$10.00
$3.50Description
Make Smarter Strategic Decisions with a Complete PESTEL View
Gain a competitive edge with our PESTLE Analysis of Lianyirong. Uncover how political, economic, social, technological, legal and environmental forces shape its strategy and risks. Purchase the full report for actionable insights and ready-to-use charts.
Political factors
Geopolitical trade tensions
US‑China frictions (including the 2018 tariffs on roughly 360 billion USD of Chinese goods and tightened US semiconductor export controls since Oct 2022) disrupt cross‑border flows Lianyirong serves, forcing route diversification and dual‑market models; policy shocks raise onboarding/compliance costs (banks report AML/KYC cost increases near 10–30%), so proactive sanctions screening and country‑risk models are essential to mitigate disruptions.
Government digital finance support
Many governments actively promote fintech, e‑invoicing and digital trade infrastructure; EU Directive 2014/55/EU mandates e‑invoicing in public procurement and over 60 countries had national e‑invoicing programs by 2024. Subsidies, regulatory sandboxes and public platforms reduce integration barriers for cloud plug‑and‑play solutions and lower upfront costs. Participation in government pilots such as e‑customs accelerates adoption and alignment with national digital strategies strengthens policy resilience.
Belt & Road and trade corridors
Policy-backed Belt and Road corridors have mobilized over $1 trillion in commitments since 2013, shaping sustained demand for supply chain finance in emerging markets. Public investment in ports and logistics raises transaction volumes addressable by AI credit while the global trade finance gap remains about $1.5 trillion. Elevated political risk across corridor states necessitates adaptive risk pricing, and local partnerships unlock policy goodwill and market access.
Data localization mandates
Data localization mandates push Lianyirong to favour multi-region clouds and sovereign deployments as table stakes, with 64 countries enforcing local data rules (2024) and 70% of enterprises expected to use multicloud by 2025. Sudden political shifts can tighten residency rules, raising infrastructure and compliance costs by an estimated 20–25%, while clear residency blueprints reassure regulators and clients.
- Rising digital sovereignty: 64 countries (2024)
- Multicloud adoption: 70% enterprises by 2025
- Cost impact: +20–25% compliance/infrastructure
Industrial policy on AI chips
Industrial policy on AI chips shapes LDP‑GPT access: US/EU export controls since 2022 and the US CHIPS Act ($52B) alter high‑end compute availability; capacity constraints with lead times of 12–18 months slow training and inference scaling; political bias for domestic AI stacks steers procurement toward compliant suppliers; diversified vendors and on‑prem hardware de‑risk supply.
- Export controls: restrict high‑end GPUs
- Subsidies: CHIPS Act $52B
- Capacity: 12–18 month lead times
- Mitigation: diversified vendors + on‑prem
US-China frictions, data rules and CHIPS raise compliance and infrastructure costs across trade
US‑China frictions (2018 tariffs on ~360B USD; export controls since Oct 2022) raise compliance costs (AML/KYC +10–30%) and force route diversification. Governments push e‑invoicing (60+ countries by 2024) and BRI investment (>1T USD) boosting trade finance (gap ~1.5T USD). Data localization (64 countries, 2024) and CHIPS Act $52B constrain cloud/AI capacity, adding ~20–25% infrastructure cost.
| Metric | Value |
|---|---|
| US tariffs (2018) | ~360B USD |
| Data localization (2024) | 64 countries |
| Trade finance gap | ~1.5T USD |
| CHIPS Act | 52B USD |
What is included in the product
Detailed Word Document
Provides a concise, data-backed PESTLE assessment of Lianyirong across Political, Economic, Social, Technological, Environmental, and Legal dimensions, reflecting regional and industry-specific dynamics; designed to help executives, consultants, and investors identify risks, opportunities, and forward-looking scenarios for strategic planning and funding decisions.
Customizable Excel Spreadsheet
A concise, visually segmented PESTLE summary of Lianyirong that simplifies external risk assessment for meetings and presentations, is easily editable for regional or business-specific notes, and shareable across teams for quick alignment.
Economic factors
Global interest rate cycles
Global policy rates peaked around 5–6% in 2023–24, elevating funding costs and stressing supply‑chain borrowers; AI‑driven risk differentiation and dynamic pricing (industry reports show revenue uplifts of roughly 3–8% in 2024) can protect margins. Rate cuts in 2025 are reviving trade volumes and credit uptake, while hedging and flexible pricing models preserve competitiveness across cycles.
SME financing gap
Trade-linked SMEs face persistent credit frictions despite robust order books; SMEs represent about 90% of firms and 50% of employment worldwide, yet the SME financing gap was estimated at $5.2 trillion by IFC (2019) and the trade finance gap near $1.5 trillion per ICC (2020–21). Alternative data and invoice-level analytics have raised approval rates and reduced defaults in pilots, enabling faster decisions. Lianyirong can monetize by expanding approved limits and faster turnarounds, driving network effects as more suppliers integrate.
FX and commodity volatility
Currency swings and commodity shocks (DXY peaked near 114 in 2022) directly erode receivables quality as realized cashflows diverge; real‑time exposure mapping across buyers and geographies is therefore critical to triage risk. Dynamic covenants tied to hedging behavior lower default rates, while embedded FX tools create fee revenue and customer stickiness.
Reshoring and supply chain reconfiguration
Reshoring and nearshoring are reshaping trade lanes, counterparties and document flows, forcing platforms to onboard new suppliers and logistics nodes rapidly; payments providers like Stripe and Adyen demonstrate API onboarding in minutes, cutting integration time from weeks to days. Credit models need transfer learning to handle unfamiliar markets, while agile APIs and agent workflows shorten time‑to‑finance.
- nearshoring: alters trade lanes & docs
- onboarding: APIs reduce weeks→days
- credit: transfer learning required
- finance: agent workflows speed funding
Trade growth and e‑commerce
Digitally native exporters scale faster as global e‑commerce surpassed $6 trillion in 2024, driving acute need for automated working capital to fund inventory and logistics.
Cross‑border marketplaces, now handling over 20% of online flows, create structured transaction and SKU data ideal for AI underwriting and risk pricing.
Volume‑based pricing and platform partnerships accelerate distribution and align financing costs with seller growth.
- data: global e‑commerce >$6T (2024)
- marketplaces: >20% cross‑border flows
- need: automated working capital
- advantage: AI underwriting from structured data
US-China frictions, data rules and CHIPS raise compliance and infrastructure costs across trade
Higher policy rates (5–6% peak 2023–24) raised funding costs while 2025 rate cuts revive trade; SME financing gap ~$5.2T (IFC) and trade finance gap ~$1.5T (ICC) keep demand for working capital. Global e‑commerce >$6T (2024) and marketplaces >20% of flows enable AI underwriting; FX volatility (DXY ~114 peak 2022) heightens receivables risk.
| Metric | Value |
|---|---|
| Policy rates peak | 5–6% (2023–24) |
| SME finance gap | $5.2T (IFC) |
| Trade finance gap | $1.5T (ICC) |
| Global e‑commerce | $6T+ (2024) |
| Marketplaces share | >20% |
| DXY peak | ≈114 (2022) |
Same Document Delivered
Lianyirong PESTLE Analysis
The Lianyirong PESTLE Analysis preview shown here is the exact document you’ll receive after purchase—fully formatted, professionally structured, and ready to use. It contains the complete Political, Economic, Social, Technological, Legal, and Environmental assessment as presented, with no placeholders or hidden content. After checkout you’ll instantly download this identical, finished file.











