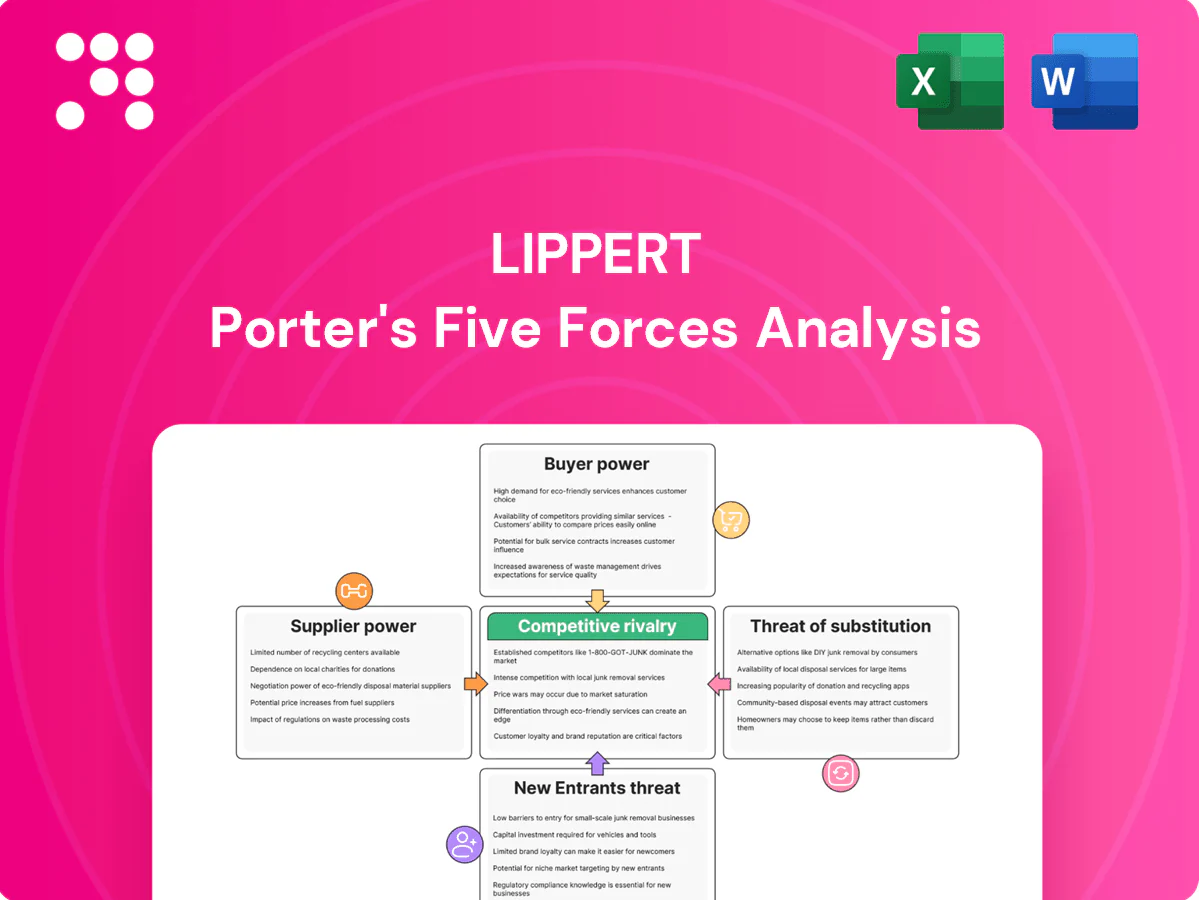
Lippert Porter's Five Forces Analysis

Don't Miss the Bigger Picture
Lippert’s Porter's Five Forces snapshot highlights supplier leverage, buyer dynamics, competitor rivalry, entrant threats, and substitute risks shaping its RV and component markets. This concise view surfaces key pressures and strategic levers, but it only scratches the surface. Unlock the full Porter's Five Forces Analysis to explore force-by-force ratings, visuals, and actionable insights for smarter decisions.
Suppliers Bargaining Power

Commodity metals volatility
Steel, aluminum and copper—with LME copper near $9,000/tonne and aluminum and HRC steel trading in the low thousands per tonne in 2024—make Lippert highly exposed to supplier-driven price swings that are frequently passed through. Hedging and index-linked contracts mute volatility but cannot eliminate spot spikes. In tight markets mills prioritize largest buyers, increasing upstream leverage, while rising freight and surcharge episodes further amplify supplier influence during dislocations.
Specialized electronics/actuators
Sensors, controllers and actuators have a narrow vendor pool, raising Lippert’s dependence as firmware integration and validation create tangible switching costs and multi-month lead times (industry averages around 12–16 weeks in 2024). Strict supply-assurance and quality specs give specialist suppliers bargaining room on pricing and delivery. Dual-sourcing is technically feasible but demands engineering hours and repeat qualification/testing cycles that extend time-to-market.

Global, diversified sourcing
Lippert’s scale and multi-region sourcing (operations centered in Elkhart, Indiana, with expanded North American and European supplier networks by 2024) reduce single-supplier leverage, while cross-plant tooling and interchangeable specs foster competitive bidding; nonetheless supplier-tied tooling can lock near-term capacity, and regional compliance and ESG rules in 2024 narrowed qualified vendors for select components.

Logistics and capacity constraints
Trucking, container and warehousing constraints give logistics providers leverage over Lippert as capacity tightness raises rates and service risk; just-in-time delivery to OEMs sharpens tolerances so delays carry higher penalties. In 2024 carriers and 3PLs imposed peak-season premiums often exceeding 15%, while nearshoring reduced transit risk but raised unit costs roughly 5–20%.
Long-term contracts and VAVE
Long-term volume commitments plus VAVE programs strengthen Lippert's supplier leverage by locking purchase volumes and driving systematic cost reductions; industry adoption of should-cost/open-book pricing in 2024 rose, curbing opportunistic price hikes while cost-down sharing aligns incentives and compresses supplier margins over time.
- Volume commitments improve predictability
- VAVE and cost-down sharing lower unit cost
- Should-cost/open-book curb opportunism
- Suppliers reclaim value via redesigns/change orders
High supplier power: metal price swings, long sensor lead times and logistics premiums
Lippert faces high supplier power: metals exposure (LME copper ~9,000/tonne; aluminum/HRC in low thousands — 2024) and concentrated sensor/actuator vendors with 12–16 week lead times boost supplier leverage. Logistics tightness (peak-season premiums >15%) and regional ESG/compliance narrow qualified suppliers; scale, VAVE, long-term commitments and rising should-cost/open-book adoption in 2024 partly offset this.
| Metric | 2024 Value | Impact |
|---|---|---|
| Copper | ~$9,000/tonne | Cost volatility |
| Sensor lead time | 12–16 weeks | Switching cost |
| Peak premium | >15% | Logistics pressure |
| Nearshoring | +5–20% unit cost | Higher sourcing cost |
| Should-cost adoption | Rising (2024) | Reduces opportunism |
What is included in the product
 Detailed Word Document
Tailored Porter's Five Forces analysis for Lippert that uncovers key drivers of competition, supplier and buyer power, substitutes and entry risks, highlights disruptive threats and market dynamics protecting incumbents, and provides strategic implications for pricing, profitability, and growth.

 Customizable Excel Spreadsheet
A concise Lippert Porter's Five Forces one-sheet that visualizes competitive pressure with an editable spider chart, easy customization for scenarios, and plug‑and‑play integration into decks and dashboards to speed strategic decisions.
Customers Bargaining Power

Concentrated OEM customers
Concentrated RV, marine and vehicle OEMs give buyers strong leverage, with 2024 platform awards driven primarily by total cost, quality and delivery performance. Large OEMs routinely extract price concessions and extended payment terms, pressuring margins. Losing a single platform in 2024 can materially reduce volumes and utilization for suppliers, making customer retention critical. Procurement consolidation amplifies supplier dependence on a few buyers.
Spec-in components and switching costs
Once components are spec‑in to a platform, requalification—often taking 3–7 years between major redesigns—creates friction to switch, reducing buyer price power mid‑cycle. Safety‑critical parts face rigorous testing and regulatory approval that add time and cost. At redesign, OEMs reopen competition and suppliers reset pricing and terms.

Aftermarket channel balance
Serving the aftermarket (global aftermarket ~380 billion USD in 2024) diversifies demand and can buffer OEM leverage, often accounting for 20–30% of supplier revenues. Brand reputation, warranty support and fitment data create end-user stickiness and higher retention. Large distributors and e-commerce platforms exert 15–25% margin pressure, while private label offerings (10–15% share in some categories) compress pricing on commodity parts.

Cyclical demand sensitivity
End markets are macro-sensitive: RV wholesale shipments fell from about 600,000 units in 2021 to 430,912 units in 2023, driving buyer push for discounts in downturns; OEMs rapidly cut and restart schedules, shifting inventory risk upstream, while tight cycles can swing leverage back to suppliers like Lippert; flexible pricing programs reduce whipsaw effects.
- Downturn impact: RV shipments 600,000 (2021) → 430,912 (2023)
- OEM schedule volatility: rapid cuts/restarts shift inventory upstream
- Upcycle effect: capacity tightness increases supplier leverage
- Mitigation: flexible pricing formulas lower margin whipsaw
Service, integration, and bundles
Bundled systems, installation kits, and field service shift buyers from pure price comparisons to total-cost and uptime considerations, reducing bargaining leverage vs single-component vendors.
Integrated solutions cut OEM assembly time and warranty exposures, boosting platform renewal probability at refresh (2024 focus) and strengthening Lippert’s customer retention.
- Less price pressure
- Lower OEM assembly time
- Reduced warranty risk
- Higher renewal likelihood
OEM concentration in 2024: platform wins dictate supplier survival
Concentrated OEMs exert strong leverage in 2024, driving platform awards on cost, quality and delivery and making single-platform losses materially harmful. Requalification windows of 3–7 years and safety testing constrain mid-cycle switching, while redesigns reopen competition. Aftermarket (~380 billion USD in 2024; 20–30% supplier revenue) and bundled systems partially mitigate buyer price pressure.
| Metric | Value |
|---|---|
| Global aftermarket (2024) | 380 billion USD |
| RV shipments (2023) | 430,912 units |
| Requalification | 3–7 years |
| Distributor margin pressure | 15–25% |
| Private label share | 10–15% |
What You See Is What You Get
Lippert Porter's Five Forces Analysis
This preview shows the exact Lippert Porter's Five Forces Analysis you'll receive—fully written, formatted, and ready for immediate download after purchase. The document contains comprehensive evaluation of competitive rivalry, supplier and buyer power, threats of entry and substitutes. No placeholders, no mockups—what you see is the final deliverable.

Don't Miss the Bigger Picture
Lippert’s Porter's Five Forces snapshot highlights supplier leverage, buyer dynamics, competitor rivalry, entrant threats, and substitute risks shaping its RV and component markets. This concise view surfaces key pressures and strategic levers, but it only scratches the surface. Unlock the full Porter's Five Forces Analysis to explore force-by-force ratings, visuals, and actionable insights for smarter decisions.
Suppliers Bargaining Power
Commodity metals volatility
Steel, aluminum and copper—with LME copper near $9,000/tonne and aluminum and HRC steel trading in the low thousands per tonne in 2024—make Lippert highly exposed to supplier-driven price swings that are frequently passed through. Hedging and index-linked contracts mute volatility but cannot eliminate spot spikes. In tight markets mills prioritize largest buyers, increasing upstream leverage, while rising freight and surcharge episodes further amplify supplier influence during dislocations.
Specialized electronics/actuators
Sensors, controllers and actuators have a narrow vendor pool, raising Lippert’s dependence as firmware integration and validation create tangible switching costs and multi-month lead times (industry averages around 12–16 weeks in 2024). Strict supply-assurance and quality specs give specialist suppliers bargaining room on pricing and delivery. Dual-sourcing is technically feasible but demands engineering hours and repeat qualification/testing cycles that extend time-to-market.
Global, diversified sourcing
Lippert’s scale and multi-region sourcing (operations centered in Elkhart, Indiana, with expanded North American and European supplier networks by 2024) reduce single-supplier leverage, while cross-plant tooling and interchangeable specs foster competitive bidding; nonetheless supplier-tied tooling can lock near-term capacity, and regional compliance and ESG rules in 2024 narrowed qualified vendors for select components.
Logistics and capacity constraints
Trucking, container and warehousing constraints give logistics providers leverage over Lippert as capacity tightness raises rates and service risk; just-in-time delivery to OEMs sharpens tolerances so delays carry higher penalties. In 2024 carriers and 3PLs imposed peak-season premiums often exceeding 15%, while nearshoring reduced transit risk but raised unit costs roughly 5–20%.
Long-term contracts and VAVE
Long-term volume commitments plus VAVE programs strengthen Lippert's supplier leverage by locking purchase volumes and driving systematic cost reductions; industry adoption of should-cost/open-book pricing in 2024 rose, curbing opportunistic price hikes while cost-down sharing aligns incentives and compresses supplier margins over time.
- Volume commitments improve predictability
- VAVE and cost-down sharing lower unit cost
- Should-cost/open-book curb opportunism
- Suppliers reclaim value via redesigns/change orders
High supplier power: metal price swings, long sensor lead times and logistics premiums
Lippert faces high supplier power: metals exposure (LME copper ~9,000/tonne; aluminum/HRC in low thousands — 2024) and concentrated sensor/actuator vendors with 12–16 week lead times boost supplier leverage. Logistics tightness (peak-season premiums >15%) and regional ESG/compliance narrow qualified suppliers; scale, VAVE, long-term commitments and rising should-cost/open-book adoption in 2024 partly offset this.
| Metric | 2024 Value | Impact |
|---|---|---|
| Copper | ~$9,000/tonne | Cost volatility |
| Sensor lead time | 12–16 weeks | Switching cost |
| Peak premium | >15% | Logistics pressure |
| Nearshoring | +5–20% unit cost | Higher sourcing cost |
| Should-cost adoption | Rising (2024) | Reduces opportunism |
What is included in the product
Detailed Word Document
Tailored Porter's Five Forces analysis for Lippert that uncovers key drivers of competition, supplier and buyer power, substitutes and entry risks, highlights disruptive threats and market dynamics protecting incumbents, and provides strategic implications for pricing, profitability, and growth.
Customizable Excel Spreadsheet
A concise Lippert Porter's Five Forces one-sheet that visualizes competitive pressure with an editable spider chart, easy customization for scenarios, and plug‑and‑play integration into decks and dashboards to speed strategic decisions.
Customers Bargaining Power
Concentrated OEM customers
Concentrated RV, marine and vehicle OEMs give buyers strong leverage, with 2024 platform awards driven primarily by total cost, quality and delivery performance. Large OEMs routinely extract price concessions and extended payment terms, pressuring margins. Losing a single platform in 2024 can materially reduce volumes and utilization for suppliers, making customer retention critical. Procurement consolidation amplifies supplier dependence on a few buyers.
Spec-in components and switching costs
Once components are spec‑in to a platform, requalification—often taking 3–7 years between major redesigns—creates friction to switch, reducing buyer price power mid‑cycle. Safety‑critical parts face rigorous testing and regulatory approval that add time and cost. At redesign, OEMs reopen competition and suppliers reset pricing and terms.
Aftermarket channel balance
Serving the aftermarket (global aftermarket ~380 billion USD in 2024) diversifies demand and can buffer OEM leverage, often accounting for 20–30% of supplier revenues. Brand reputation, warranty support and fitment data create end-user stickiness and higher retention. Large distributors and e-commerce platforms exert 15–25% margin pressure, while private label offerings (10–15% share in some categories) compress pricing on commodity parts.
Cyclical demand sensitivity
End markets are macro-sensitive: RV wholesale shipments fell from about 600,000 units in 2021 to 430,912 units in 2023, driving buyer push for discounts in downturns; OEMs rapidly cut and restart schedules, shifting inventory risk upstream, while tight cycles can swing leverage back to suppliers like Lippert; flexible pricing programs reduce whipsaw effects.
- Downturn impact: RV shipments 600,000 (2021) → 430,912 (2023)
- OEM schedule volatility: rapid cuts/restarts shift inventory upstream
- Upcycle effect: capacity tightness increases supplier leverage
- Mitigation: flexible pricing formulas lower margin whipsaw
Service, integration, and bundles
Bundled systems, installation kits, and field service shift buyers from pure price comparisons to total-cost and uptime considerations, reducing bargaining leverage vs single-component vendors.
Integrated solutions cut OEM assembly time and warranty exposures, boosting platform renewal probability at refresh (2024 focus) and strengthening Lippert’s customer retention.
- Less price pressure
- Lower OEM assembly time
- Reduced warranty risk
- Higher renewal likelihood
OEM concentration in 2024: platform wins dictate supplier survival
Concentrated OEMs exert strong leverage in 2024, driving platform awards on cost, quality and delivery and making single-platform losses materially harmful. Requalification windows of 3–7 years and safety testing constrain mid-cycle switching, while redesigns reopen competition. Aftermarket (~380 billion USD in 2024; 20–30% supplier revenue) and bundled systems partially mitigate buyer price pressure.
| Metric | Value |
|---|---|
| Global aftermarket (2024) | 380 billion USD |
| RV shipments (2023) | 430,912 units |
| Requalification | 3–7 years |
| Distributor margin pressure | 15–25% |
| Private label share | 10–15% |
What You See Is What You Get
Lippert Porter's Five Forces Analysis
This preview shows the exact Lippert Porter's Five Forces Analysis you'll receive—fully written, formatted, and ready for immediate download after purchase. The document contains comprehensive evaluation of competitive rivalry, supplier and buyer power, threats of entry and substitutes. No placeholders, no mockups—what you see is the final deliverable.
Description
Don't Miss the Bigger Picture
Lippert’s Porter's Five Forces snapshot highlights supplier leverage, buyer dynamics, competitor rivalry, entrant threats, and substitute risks shaping its RV and component markets. This concise view surfaces key pressures and strategic levers, but it only scratches the surface. Unlock the full Porter's Five Forces Analysis to explore force-by-force ratings, visuals, and actionable insights for smarter decisions.
Suppliers Bargaining Power
Commodity metals volatility
Steel, aluminum and copper—with LME copper near $9,000/tonne and aluminum and HRC steel trading in the low thousands per tonne in 2024—make Lippert highly exposed to supplier-driven price swings that are frequently passed through. Hedging and index-linked contracts mute volatility but cannot eliminate spot spikes. In tight markets mills prioritize largest buyers, increasing upstream leverage, while rising freight and surcharge episodes further amplify supplier influence during dislocations.
Specialized electronics/actuators
Sensors, controllers and actuators have a narrow vendor pool, raising Lippert’s dependence as firmware integration and validation create tangible switching costs and multi-month lead times (industry averages around 12–16 weeks in 2024). Strict supply-assurance and quality specs give specialist suppliers bargaining room on pricing and delivery. Dual-sourcing is technically feasible but demands engineering hours and repeat qualification/testing cycles that extend time-to-market.
Global, diversified sourcing
Lippert’s scale and multi-region sourcing (operations centered in Elkhart, Indiana, with expanded North American and European supplier networks by 2024) reduce single-supplier leverage, while cross-plant tooling and interchangeable specs foster competitive bidding; nonetheless supplier-tied tooling can lock near-term capacity, and regional compliance and ESG rules in 2024 narrowed qualified vendors for select components.
Logistics and capacity constraints
Trucking, container and warehousing constraints give logistics providers leverage over Lippert as capacity tightness raises rates and service risk; just-in-time delivery to OEMs sharpens tolerances so delays carry higher penalties. In 2024 carriers and 3PLs imposed peak-season premiums often exceeding 15%, while nearshoring reduced transit risk but raised unit costs roughly 5–20%.
Long-term contracts and VAVE
Long-term volume commitments plus VAVE programs strengthen Lippert's supplier leverage by locking purchase volumes and driving systematic cost reductions; industry adoption of should-cost/open-book pricing in 2024 rose, curbing opportunistic price hikes while cost-down sharing aligns incentives and compresses supplier margins over time.
- Volume commitments improve predictability
- VAVE and cost-down sharing lower unit cost
- Should-cost/open-book curb opportunism
- Suppliers reclaim value via redesigns/change orders
High supplier power: metal price swings, long sensor lead times and logistics premiums
Lippert faces high supplier power: metals exposure (LME copper ~9,000/tonne; aluminum/HRC in low thousands — 2024) and concentrated sensor/actuator vendors with 12–16 week lead times boost supplier leverage. Logistics tightness (peak-season premiums >15%) and regional ESG/compliance narrow qualified suppliers; scale, VAVE, long-term commitments and rising should-cost/open-book adoption in 2024 partly offset this.
| Metric | 2024 Value | Impact |
|---|---|---|
| Copper | ~$9,000/tonne | Cost volatility |
| Sensor lead time | 12–16 weeks | Switching cost |
| Peak premium | >15% | Logistics pressure |
| Nearshoring | +5–20% unit cost | Higher sourcing cost |
| Should-cost adoption | Rising (2024) | Reduces opportunism |
What is included in the product
Detailed Word Document
Tailored Porter's Five Forces analysis for Lippert that uncovers key drivers of competition, supplier and buyer power, substitutes and entry risks, highlights disruptive threats and market dynamics protecting incumbents, and provides strategic implications for pricing, profitability, and growth.
Customizable Excel Spreadsheet
A concise Lippert Porter's Five Forces one-sheet that visualizes competitive pressure with an editable spider chart, easy customization for scenarios, and plug‑and‑play integration into decks and dashboards to speed strategic decisions.
Customers Bargaining Power
Concentrated OEM customers
Concentrated RV, marine and vehicle OEMs give buyers strong leverage, with 2024 platform awards driven primarily by total cost, quality and delivery performance. Large OEMs routinely extract price concessions and extended payment terms, pressuring margins. Losing a single platform in 2024 can materially reduce volumes and utilization for suppliers, making customer retention critical. Procurement consolidation amplifies supplier dependence on a few buyers.
Spec-in components and switching costs
Once components are spec‑in to a platform, requalification—often taking 3–7 years between major redesigns—creates friction to switch, reducing buyer price power mid‑cycle. Safety‑critical parts face rigorous testing and regulatory approval that add time and cost. At redesign, OEMs reopen competition and suppliers reset pricing and terms.
Aftermarket channel balance
Serving the aftermarket (global aftermarket ~380 billion USD in 2024) diversifies demand and can buffer OEM leverage, often accounting for 20–30% of supplier revenues. Brand reputation, warranty support and fitment data create end-user stickiness and higher retention. Large distributors and e-commerce platforms exert 15–25% margin pressure, while private label offerings (10–15% share in some categories) compress pricing on commodity parts.
Cyclical demand sensitivity
End markets are macro-sensitive: RV wholesale shipments fell from about 600,000 units in 2021 to 430,912 units in 2023, driving buyer push for discounts in downturns; OEMs rapidly cut and restart schedules, shifting inventory risk upstream, while tight cycles can swing leverage back to suppliers like Lippert; flexible pricing programs reduce whipsaw effects.
- Downturn impact: RV shipments 600,000 (2021) → 430,912 (2023)
- OEM schedule volatility: rapid cuts/restarts shift inventory upstream
- Upcycle effect: capacity tightness increases supplier leverage
- Mitigation: flexible pricing formulas lower margin whipsaw
Service, integration, and bundles
Bundled systems, installation kits, and field service shift buyers from pure price comparisons to total-cost and uptime considerations, reducing bargaining leverage vs single-component vendors.
Integrated solutions cut OEM assembly time and warranty exposures, boosting platform renewal probability at refresh (2024 focus) and strengthening Lippert’s customer retention.
- Less price pressure
- Lower OEM assembly time
- Reduced warranty risk
- Higher renewal likelihood
OEM concentration in 2024: platform wins dictate supplier survival
Concentrated OEMs exert strong leverage in 2024, driving platform awards on cost, quality and delivery and making single-platform losses materially harmful. Requalification windows of 3–7 years and safety testing constrain mid-cycle switching, while redesigns reopen competition. Aftermarket (~380 billion USD in 2024; 20–30% supplier revenue) and bundled systems partially mitigate buyer price pressure.
| Metric | Value |
|---|---|
| Global aftermarket (2024) | 380 billion USD |
| RV shipments (2023) | 430,912 units |
| Requalification | 3–7 years |
| Distributor margin pressure | 15–25% |
| Private label share | 10–15% |
What You See Is What You Get
Lippert Porter's Five Forces Analysis
This preview shows the exact Lippert Porter's Five Forces Analysis you'll receive—fully written, formatted, and ready for immediate download after purchase. The document contains comprehensive evaluation of competitive rivalry, supplier and buyer power, threats of entry and substitutes. No placeholders, no mockups—what you see is the final deliverable.











