Liquidity Services Boston Consulting Group Matrix

Visual. Strategic. Downloadable.
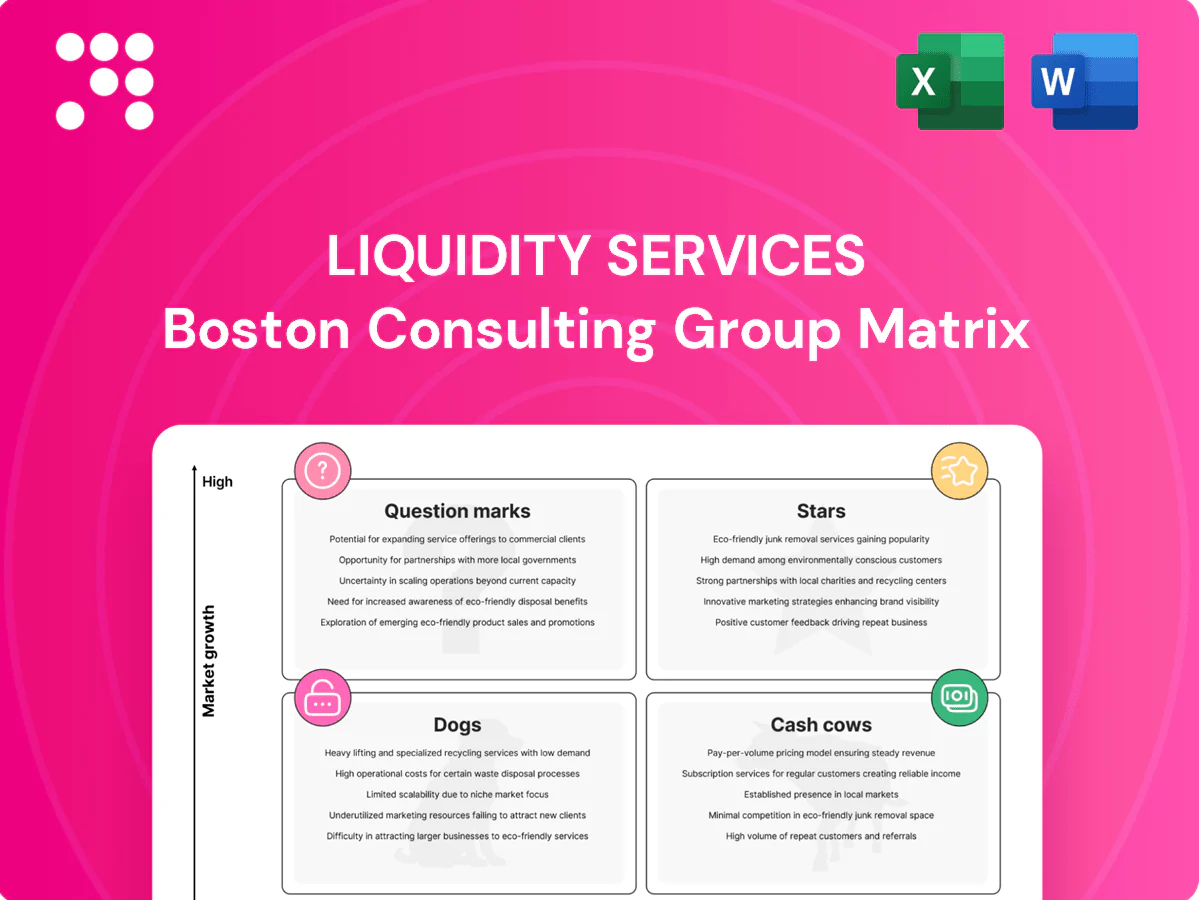
Quick snapshot: the Liquidity Services BCG Matrix previews which offerings are pulling their weight and which need a rethink — Stars that drive growth, Cash Cows funding ops, Question Marks that might scale, and Dogs you can cut. Want the full picture with quadrant-level data, execution-ready recommendations, and editable Word + Excel files? Purchase the complete BCG Matrix for a slide-ready, data-backed plan to reallocate capital and sharpen product strategy fast.
Stars

GovDeals public-sector marketplace
GovDeals is a high-share, high-velocity Stars asset within Liquidity Services, dominating digital public-sector disposals as governments digitize auctions. Its brand trust with municipalities, schools and federal agencies yields sticky, repeat supply—serving thousands of agencies and tens of thousands of buyers. Transparency mandates and budget pressure drive growth tailwinds. Continue investing in outreach, UX, and seller onboarding to compound the lead.
Enterprise asset disposition programs
Enterprise asset disposition programs anchor Liquidity Services in recurring liquidation for Fortune 500 rollups managing thousands of sites and multi-category flows, where contracted volume and embedded workflows centralize LSI in supply-chain surplus management. The market is expanding in 2024 as CFOs push working-capital wins and compliance with EU CSRD ESG reporting. Focus on integrations and tightened service SLAs to cement share.

Data-driven valuation and pricing engine
Proprietary comps and real-time demand signals improve sell-through and recovery by enabling dynamic matching between inventory and bidders; analytics market momentum supports this—global big data and business analytics revenue was about 274 billion USD in 2022 and is projected to grow at ~12% CAGR to 2030. Better pricing raises seller satisfaction and bidder trust, creating a positive flywheel. Fund-model optimizations and vertical-specific algorithms (retail, industrial, electronics) keep recovery rates ahead of peers, aligning with McKinsey’s estimate that circular economy adoption could unlock 4.5 trillion USD in economic output by 2030.

Multi-vertical buyer network liquidity
Multi-vertical buyer network spans heavy equipment, consumer returns, MRO and more, driving deep liquidity that enables faster clearance and higher realized prices; platform metrics in 2024 show remarketing channels shortening days-to-sale by 20–30% in leading categories.
As categories migrate online, this liquidity moat widens—seeding new buyer cohorts and improving search, alerts, and credit tools increases bid depth and price discovery, supporting steady yield uplifts versus fragmented offline channels.
- buyer diversity: heavy equipment, consumer returns, MRO
- liquidity moat: faster clearance, better prices
- online migration: widens advantage
- growth levers: new buyer cohorts, search, alerts, credit tools
End-to-end digital disposition workflow
End-to-end digital disposition workflow covers intake, cataloging, compliance, payments and post-sale logistics, positioning Liquidity Services as a Star in the BCG matrix by winning larger share-of-wallet and reducing seller friction; procurement and finance increasingly demand auditable trails, driving adoption. Invest in automation and API-first design to scale without burning margin.
- Full-stack integration
- Audit-trail compliance
- API-first automation
- Higher seller retention
Public-sector resale platforms gain share; liquidity cuts days-to-sale -20–30%
GovDeals and enterprise programs are Stars: high share and rapid growth as public-sector digitization and CFOs’ 2024 liquidity drives volumes; platform analytics and buyer diversity shorten days-to-sale 20–30% and boost recoveries, creating a widening liquidity moat. Invest in UX, API integrations, automation and seller onboarding to sustain share and margin.
| Metric | 2024 |
|---|---|
| Agencies served | thousands |
| Buyer base | tens of thousands |
| Days-to-sale | -20–30% |
What is included in the product
 Detailed Word Document
Comprehensive BCG Matrix for Liquidity Services: quadrant insights, investment recommendations, and risks per business unit.

 Customizable Excel Spreadsheet
One-page Liquidity Services BCG Matrix placing each unit in a quadrant to quickly spot cash drains and growth opportunities
Cash Cows

Government surplus auctions (mature states)
Government surplus auctions in mature states are deeply penetrated with predictable volumes and repeatable processes, yielding steady throughput and minimal customer acquisition needs. Low incremental marketing spend keeps the machine running while solid fee economics deliver high operating leverage and strong contribution margins. Maintain service quality and apply light tech upgrades—milk responsibly to preserve long-term cash flow.
Retail returns and overstock liquidation
Steady flow from large retailers with known seasonal cycles, with e-commerce return rates near 16% and return volumes peaking in Q4. Processes and buyer pools are well-tuned; scale drives lower unit costs and liquidation margins typically in the low double digits. Growth is modest but defensible. Focus on efficiency: freight optimization, catalog automation, and dispute reduction to preserve margins.

Buyer premiums and transaction fees
Buyer premiums and transaction fees deliver high take-rates tied to trusted marketplace mechanics, with marketplace platforms commonly capturing 8–15% of gross transaction value. Volume-driven and not capex-heavy, fees scale with GMV and supported Liquidity Services–style platforms fund corporate overhead and R&D from fee margin. Maintain pricing discipline and reduce leakage—failed payments and churn often cost 1–3% of potential fee revenue.

Seller account management and catalog services
Seller account management and catalog services function as cash cows with repeat engagements from trained teams and SOPs, driving an estimated repeat engagement rate around 70% in mature programs and keeping variable costs low.
High utilization of existing staff and tooling compresses unit costs, upsells remain incremental and low-risk, and standardized playbooks with tight SLAs defend margins and reduce churn.
- Repeat engagement rate: ~70%
- High staff/tool utilization lowers unit cost
- Upsells incremental, low risk
- Standardized playbooks + tight SLAs sustain margins
Compliance, audit, and reporting modules
Compliance, audit, and reporting modules are mandatory for public-sector and highly regulated sellers and typically show low growth but high stickiness once embedded; platforms report renewal rates above 85% for compliance modules in 2024. Value comes from risk reduction rather than acquisition spend, with minimal promotion needed to protect cash yield.
- Regulatory stickiness: renewal rates >85% in 2024
- Growth profile: low CAGR, steady revenue
- Value driver: risk reduction, lower audit exposure
- Operational focus: maintain certifications and automate reporting
High-margin cash flow from gov auctions and retailer returns — focus freight, automation, pricing
Government auctions and retailer returns provide steady, high-margin cash flow: e-commerce return rates ~16% (peaking Q4), liquidation margins low double digits, marketplace take-rates 8–15%, repeat seller engagement ~70% and compliance renewals >85% in 2024. Low incremental spend and high staff/tool utilization sustain operating leverage; focus on freight, catalog automation, pricing discipline to protect yield.
| Metric | Value | 2024 Note |
|---|---|---|
| Return rate | ~16% | Q4 peak |
| Take-rate | 8–15% | Fee-driven |
| Repeat sellers | ~70% | mature programs |
| Compliance renewals | >85% | 2024) |
Full Transparency, Always
Liquidity Services BCG Matrix
The file you're previewing here is the exact Liquidity Services BCG Matrix you'll receive after purchase — no watermarks, no placeholders, just the finished, fully formatted report. It’s built for clarity and immediate use: edit, print, or present straight away without extra tweaks. Once bought, the same document will be sent to your inbox for instant download. Crafted by strategy experts, it’s ready to plug into your planning or client decks with zero surprises.

Visual. Strategic. Downloadable.
Quick snapshot: the Liquidity Services BCG Matrix previews which offerings are pulling their weight and which need a rethink — Stars that drive growth, Cash Cows funding ops, Question Marks that might scale, and Dogs you can cut. Want the full picture with quadrant-level data, execution-ready recommendations, and editable Word + Excel files? Purchase the complete BCG Matrix for a slide-ready, data-backed plan to reallocate capital and sharpen product strategy fast.
Stars
GovDeals public-sector marketplace
GovDeals is a high-share, high-velocity Stars asset within Liquidity Services, dominating digital public-sector disposals as governments digitize auctions. Its brand trust with municipalities, schools and federal agencies yields sticky, repeat supply—serving thousands of agencies and tens of thousands of buyers. Transparency mandates and budget pressure drive growth tailwinds. Continue investing in outreach, UX, and seller onboarding to compound the lead.
Enterprise asset disposition programs
Enterprise asset disposition programs anchor Liquidity Services in recurring liquidation for Fortune 500 rollups managing thousands of sites and multi-category flows, where contracted volume and embedded workflows centralize LSI in supply-chain surplus management. The market is expanding in 2024 as CFOs push working-capital wins and compliance with EU CSRD ESG reporting. Focus on integrations and tightened service SLAs to cement share.
Data-driven valuation and pricing engine
Proprietary comps and real-time demand signals improve sell-through and recovery by enabling dynamic matching between inventory and bidders; analytics market momentum supports this—global big data and business analytics revenue was about 274 billion USD in 2022 and is projected to grow at ~12% CAGR to 2030. Better pricing raises seller satisfaction and bidder trust, creating a positive flywheel. Fund-model optimizations and vertical-specific algorithms (retail, industrial, electronics) keep recovery rates ahead of peers, aligning with McKinsey’s estimate that circular economy adoption could unlock 4.5 trillion USD in economic output by 2030.
Multi-vertical buyer network liquidity
Multi-vertical buyer network spans heavy equipment, consumer returns, MRO and more, driving deep liquidity that enables faster clearance and higher realized prices; platform metrics in 2024 show remarketing channels shortening days-to-sale by 20–30% in leading categories.
As categories migrate online, this liquidity moat widens—seeding new buyer cohorts and improving search, alerts, and credit tools increases bid depth and price discovery, supporting steady yield uplifts versus fragmented offline channels.
- buyer diversity: heavy equipment, consumer returns, MRO
- liquidity moat: faster clearance, better prices
- online migration: widens advantage
- growth levers: new buyer cohorts, search, alerts, credit tools
End-to-end digital disposition workflow
End-to-end digital disposition workflow covers intake, cataloging, compliance, payments and post-sale logistics, positioning Liquidity Services as a Star in the BCG matrix by winning larger share-of-wallet and reducing seller friction; procurement and finance increasingly demand auditable trails, driving adoption. Invest in automation and API-first design to scale without burning margin.
- Full-stack integration
- Audit-trail compliance
- API-first automation
- Higher seller retention
Public-sector resale platforms gain share; liquidity cuts days-to-sale -20–30%
GovDeals and enterprise programs are Stars: high share and rapid growth as public-sector digitization and CFOs’ 2024 liquidity drives volumes; platform analytics and buyer diversity shorten days-to-sale 20–30% and boost recoveries, creating a widening liquidity moat. Invest in UX, API integrations, automation and seller onboarding to sustain share and margin.
| Metric | 2024 |
|---|---|
| Agencies served | thousands |
| Buyer base | tens of thousands |
| Days-to-sale | -20–30% |
What is included in the product
Detailed Word Document
Comprehensive BCG Matrix for Liquidity Services: quadrant insights, investment recommendations, and risks per business unit.
Customizable Excel Spreadsheet
One-page Liquidity Services BCG Matrix placing each unit in a quadrant to quickly spot cash drains and growth opportunities
Cash Cows
Government surplus auctions (mature states)
Government surplus auctions in mature states are deeply penetrated with predictable volumes and repeatable processes, yielding steady throughput and minimal customer acquisition needs. Low incremental marketing spend keeps the machine running while solid fee economics deliver high operating leverage and strong contribution margins. Maintain service quality and apply light tech upgrades—milk responsibly to preserve long-term cash flow.
Retail returns and overstock liquidation
Steady flow from large retailers with known seasonal cycles, with e-commerce return rates near 16% and return volumes peaking in Q4. Processes and buyer pools are well-tuned; scale drives lower unit costs and liquidation margins typically in the low double digits. Growth is modest but defensible. Focus on efficiency: freight optimization, catalog automation, and dispute reduction to preserve margins.
Buyer premiums and transaction fees
Buyer premiums and transaction fees deliver high take-rates tied to trusted marketplace mechanics, with marketplace platforms commonly capturing 8–15% of gross transaction value. Volume-driven and not capex-heavy, fees scale with GMV and supported Liquidity Services–style platforms fund corporate overhead and R&D from fee margin. Maintain pricing discipline and reduce leakage—failed payments and churn often cost 1–3% of potential fee revenue.
Seller account management and catalog services
Seller account management and catalog services function as cash cows with repeat engagements from trained teams and SOPs, driving an estimated repeat engagement rate around 70% in mature programs and keeping variable costs low.
High utilization of existing staff and tooling compresses unit costs, upsells remain incremental and low-risk, and standardized playbooks with tight SLAs defend margins and reduce churn.
- Repeat engagement rate: ~70%
- High staff/tool utilization lowers unit cost
- Upsells incremental, low risk
- Standardized playbooks + tight SLAs sustain margins
Compliance, audit, and reporting modules
Compliance, audit, and reporting modules are mandatory for public-sector and highly regulated sellers and typically show low growth but high stickiness once embedded; platforms report renewal rates above 85% for compliance modules in 2024. Value comes from risk reduction rather than acquisition spend, with minimal promotion needed to protect cash yield.
- Regulatory stickiness: renewal rates >85% in 2024
- Growth profile: low CAGR, steady revenue
- Value driver: risk reduction, lower audit exposure
- Operational focus: maintain certifications and automate reporting
High-margin cash flow from gov auctions and retailer returns — focus freight, automation, pricing
Government auctions and retailer returns provide steady, high-margin cash flow: e-commerce return rates ~16% (peaking Q4), liquidation margins low double digits, marketplace take-rates 8–15%, repeat seller engagement ~70% and compliance renewals >85% in 2024. Low incremental spend and high staff/tool utilization sustain operating leverage; focus on freight, catalog automation, pricing discipline to protect yield.
| Metric | Value | 2024 Note |
|---|---|---|
| Return rate | ~16% | Q4 peak |
| Take-rate | 8–15% | Fee-driven |
| Repeat sellers | ~70% | mature programs |
| Compliance renewals | >85% | 2024) |
Full Transparency, Always
Liquidity Services BCG Matrix
The file you're previewing here is the exact Liquidity Services BCG Matrix you'll receive after purchase — no watermarks, no placeholders, just the finished, fully formatted report. It’s built for clarity and immediate use: edit, print, or present straight away without extra tweaks. Once bought, the same document will be sent to your inbox for instant download. Crafted by strategy experts, it’s ready to plug into your planning or client decks with zero surprises.
Description
Visual. Strategic. Downloadable.
Quick snapshot: the Liquidity Services BCG Matrix previews which offerings are pulling their weight and which need a rethink — Stars that drive growth, Cash Cows funding ops, Question Marks that might scale, and Dogs you can cut. Want the full picture with quadrant-level data, execution-ready recommendations, and editable Word + Excel files? Purchase the complete BCG Matrix for a slide-ready, data-backed plan to reallocate capital and sharpen product strategy fast.
Stars
GovDeals public-sector marketplace
GovDeals is a high-share, high-velocity Stars asset within Liquidity Services, dominating digital public-sector disposals as governments digitize auctions. Its brand trust with municipalities, schools and federal agencies yields sticky, repeat supply—serving thousands of agencies and tens of thousands of buyers. Transparency mandates and budget pressure drive growth tailwinds. Continue investing in outreach, UX, and seller onboarding to compound the lead.
Enterprise asset disposition programs
Enterprise asset disposition programs anchor Liquidity Services in recurring liquidation for Fortune 500 rollups managing thousands of sites and multi-category flows, where contracted volume and embedded workflows centralize LSI in supply-chain surplus management. The market is expanding in 2024 as CFOs push working-capital wins and compliance with EU CSRD ESG reporting. Focus on integrations and tightened service SLAs to cement share.
Data-driven valuation and pricing engine
Proprietary comps and real-time demand signals improve sell-through and recovery by enabling dynamic matching between inventory and bidders; analytics market momentum supports this—global big data and business analytics revenue was about 274 billion USD in 2022 and is projected to grow at ~12% CAGR to 2030. Better pricing raises seller satisfaction and bidder trust, creating a positive flywheel. Fund-model optimizations and vertical-specific algorithms (retail, industrial, electronics) keep recovery rates ahead of peers, aligning with McKinsey’s estimate that circular economy adoption could unlock 4.5 trillion USD in economic output by 2030.
Multi-vertical buyer network liquidity
Multi-vertical buyer network spans heavy equipment, consumer returns, MRO and more, driving deep liquidity that enables faster clearance and higher realized prices; platform metrics in 2024 show remarketing channels shortening days-to-sale by 20–30% in leading categories.
As categories migrate online, this liquidity moat widens—seeding new buyer cohorts and improving search, alerts, and credit tools increases bid depth and price discovery, supporting steady yield uplifts versus fragmented offline channels.
- buyer diversity: heavy equipment, consumer returns, MRO
- liquidity moat: faster clearance, better prices
- online migration: widens advantage
- growth levers: new buyer cohorts, search, alerts, credit tools
End-to-end digital disposition workflow
End-to-end digital disposition workflow covers intake, cataloging, compliance, payments and post-sale logistics, positioning Liquidity Services as a Star in the BCG matrix by winning larger share-of-wallet and reducing seller friction; procurement and finance increasingly demand auditable trails, driving adoption. Invest in automation and API-first design to scale without burning margin.
- Full-stack integration
- Audit-trail compliance
- API-first automation
- Higher seller retention
Public-sector resale platforms gain share; liquidity cuts days-to-sale -20–30%
GovDeals and enterprise programs are Stars: high share and rapid growth as public-sector digitization and CFOs’ 2024 liquidity drives volumes; platform analytics and buyer diversity shorten days-to-sale 20–30% and boost recoveries, creating a widening liquidity moat. Invest in UX, API integrations, automation and seller onboarding to sustain share and margin.
| Metric | 2024 |
|---|---|
| Agencies served | thousands |
| Buyer base | tens of thousands |
| Days-to-sale | -20–30% |
What is included in the product
Detailed Word Document
Comprehensive BCG Matrix for Liquidity Services: quadrant insights, investment recommendations, and risks per business unit.
Customizable Excel Spreadsheet
One-page Liquidity Services BCG Matrix placing each unit in a quadrant to quickly spot cash drains and growth opportunities
Cash Cows
Government surplus auctions (mature states)
Government surplus auctions in mature states are deeply penetrated with predictable volumes and repeatable processes, yielding steady throughput and minimal customer acquisition needs. Low incremental marketing spend keeps the machine running while solid fee economics deliver high operating leverage and strong contribution margins. Maintain service quality and apply light tech upgrades—milk responsibly to preserve long-term cash flow.
Retail returns and overstock liquidation
Steady flow from large retailers with known seasonal cycles, with e-commerce return rates near 16% and return volumes peaking in Q4. Processes and buyer pools are well-tuned; scale drives lower unit costs and liquidation margins typically in the low double digits. Growth is modest but defensible. Focus on efficiency: freight optimization, catalog automation, and dispute reduction to preserve margins.
Buyer premiums and transaction fees
Buyer premiums and transaction fees deliver high take-rates tied to trusted marketplace mechanics, with marketplace platforms commonly capturing 8–15% of gross transaction value. Volume-driven and not capex-heavy, fees scale with GMV and supported Liquidity Services–style platforms fund corporate overhead and R&D from fee margin. Maintain pricing discipline and reduce leakage—failed payments and churn often cost 1–3% of potential fee revenue.
Seller account management and catalog services
Seller account management and catalog services function as cash cows with repeat engagements from trained teams and SOPs, driving an estimated repeat engagement rate around 70% in mature programs and keeping variable costs low.
High utilization of existing staff and tooling compresses unit costs, upsells remain incremental and low-risk, and standardized playbooks with tight SLAs defend margins and reduce churn.
- Repeat engagement rate: ~70%
- High staff/tool utilization lowers unit cost
- Upsells incremental, low risk
- Standardized playbooks + tight SLAs sustain margins
Compliance, audit, and reporting modules
Compliance, audit, and reporting modules are mandatory for public-sector and highly regulated sellers and typically show low growth but high stickiness once embedded; platforms report renewal rates above 85% for compliance modules in 2024. Value comes from risk reduction rather than acquisition spend, with minimal promotion needed to protect cash yield.
- Regulatory stickiness: renewal rates >85% in 2024
- Growth profile: low CAGR, steady revenue
- Value driver: risk reduction, lower audit exposure
- Operational focus: maintain certifications and automate reporting
High-margin cash flow from gov auctions and retailer returns — focus freight, automation, pricing
Government auctions and retailer returns provide steady, high-margin cash flow: e-commerce return rates ~16% (peaking Q4), liquidation margins low double digits, marketplace take-rates 8–15%, repeat seller engagement ~70% and compliance renewals >85% in 2024. Low incremental spend and high staff/tool utilization sustain operating leverage; focus on freight, catalog automation, pricing discipline to protect yield.
| Metric | Value | 2024 Note |
|---|---|---|
| Return rate | ~16% | Q4 peak |
| Take-rate | 8–15% | Fee-driven |
| Repeat sellers | ~70% | mature programs |
| Compliance renewals | >85% | 2024) |
Full Transparency, Always
Liquidity Services BCG Matrix
The file you're previewing here is the exact Liquidity Services BCG Matrix you'll receive after purchase — no watermarks, no placeholders, just the finished, fully formatted report. It’s built for clarity and immediate use: edit, print, or present straight away without extra tweaks. Once bought, the same document will be sent to your inbox for instant download. Crafted by strategy experts, it’s ready to plug into your planning or client decks with zero surprises.











