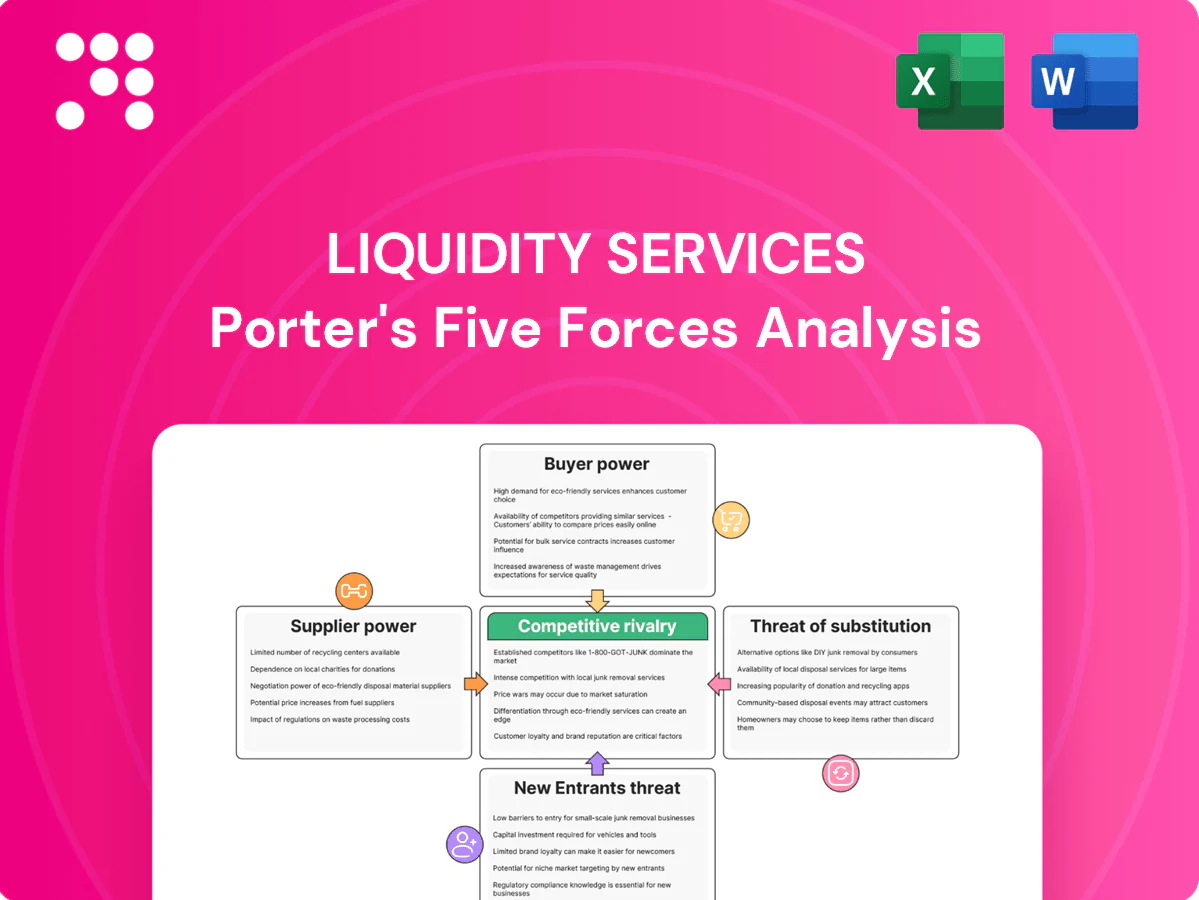
Liquidity Services Porter's Five Forces Analysis

Elevate Your Analysis with the Complete Porter's Five Forces Analysis
Liquidity Services faces concentrated buyer power, moderate supplier influence, and evolving substitute threats driven by digital marketplaces, while regulatory and entry barriers shape competitive intensity. This snapshot highlights strategic pressure points and potential growth levers. The full Porter's Five Forces Analysis dissects each force with ratings and implications. Unlock the complete report for a consultant-grade, actionable breakdown tailored to Liquidity Services.
Suppliers Bargaining Power

Concentrated enterprise and government sellers
Large corporations and government agencies control outsized volumes of surplus assets — the federal GSA program reported excess personal property sales exceeding $1 billion annually, and in 2024 LSI disclosed that its largest clients drove roughly 30% of supply, giving sellers leverage over pricing, service levels and auction cadence. Losing a few marquee accounts can materially narrow supply breadth, so LSI must continually demonstrate higher recovery rates to retain them.
Multi-homing across liquidation channels
Suppliers increasingly multi-home across auctioneers, brokers and direct-sale platforms, reducing reliance on any single marketplace and forcing take rates and payment terms downward in 2024. Contractual exclusivity is negotiated but remains uncommon, so platforms compete on fees and service. Performance-based SLAs became critical in 2024 to defend share of wallet and limit churn.

Switching costs anchored in data and workflows
Integration of asset catalogs, valuation models, compliance and reporting raises operational switching costs by embedding workflows into clients’ ERP and audit trails, often locking in multi-year contracts and driving vendor retention. Standardized CSV/API workflows, cited by 2024 surveys showing 68% of firms prioritize API portability, make migration feasible over quarters rather than years. Liquidity Services’ deep category expertise and recovery analytics can materially offset supplier power by improving time-to-cash; demonstrable auditability and faster cash conversion remain key retention levers.

Alternative disposition options
Suppliers can divert assets to OEM trade-ins, dealer buybacks, refurbishers, scrap yards, donations, or internal redeployment, each creating a reservation price that constrains auction clearing values.
When secondary or scrap markets strengthen, those alternatives raise the reservation price and increase supplier bargaining power, forcing LSI to exceed net proceeds after friction costs to capture volumes.
- Options: OEM trade-ins, dealer buybacks, refurbishers, scrap, donation, redeploy
- Effect: set reservation price for auctions
- Market impact: buoyant secondary/scrap raises alternatives
- LSI requirement: beat net proceeds after friction costs
Compliance and contractual demands
Public-sector sellers impose strict transparency, audit, and security requirements that vendors must absorb, raising compliance overhead and vendor pricing pressure.
Indemnities, data-privacy obligations and tight SLAs transfer legal and operational risk to the platform, increasing insurer and capital costs.
Custom reporting and chain-of-custody logistics raise delivery costs; with public procurement ≈14% of EU GDP (2024), this strengthens suppliers’ bargaining position.
Large buyers concentrate power; 30% top-client share, 68% API portability, EU procurement ~14%
Large buyers (LSI largest clients ≈30% supply; federal GSA excess sales >$1B) concentrate power, while multi-homing and 68% API-portability lower switching costs and compress fees. Strong secondary/scrap markets raise reservation prices, forcing platforms to beat net proceeds after friction. Public procurement ≈14% of EU GDP increases compliance-driven supplier leverage.
| Metric | 2024 | Impact |
|---|---|---|
| Top-client share | 30% | High pricing leverage |
| GSA excess sales | >$1B | Concentrated supply |
| API portability | 68% | Lower switching costs |
| Public procurement | ≈14% EU GDP | Compliance burden |
What is included in the product
 Detailed Word Document
Tailored Porter's Five Forces analysis of Liquidity Services, uncovering competitive drivers, buyer and supplier power, threat of substitutes and new entrants, and highlighting disruptive forces and strategic barriers that shape pricing, profitability, and market positioning.

 Customizable Excel Spreadsheet
Clear one-sheet Porter's Five Forces for Liquidity Services—instantly visualize competitive pressures and copy-ready for pitch decks to speed decision-making and relieve analysis bottlenecks.
Customers Bargaining Power

Price-sensitive, fragmented global buyers
Buyer base spans dealers, recyclers, SMBs and individuals and remains largely fragmented and price-driven, with the platform reporting over 1.2 million registered buyers as of 2024. Fragmentation limits coordinated leverage but increases auction price elasticity, compressing realized prices on low-demand lots. Visible fees and often substantial shipping costs cap bid ceilings, while transparent bidding tools and analytics partially mitigate buyer power by improving price discovery.
Low switching costs and multi-homing
Buyers routinely browse multiple marketplaces, classifieds and local auctions, with 62% of shoppers in 2024 comparing listings across platforms, making switching a click away and pressuring platforms to sustain broad inventory and fair fees. Features like alerts, saved searches and escrow/buyer protections cut churn by improving retention. However, scarcity or rarity of specific assets can temporarily shift bargaining power back to buyers who hold those items.

Information parity via listings and history
Detailed condition reports, high-resolution photos, and complete sale histories on Liquidity Services reduce information asymmetry, boosting buyer confidence while enabling tighter price discipline. Third-party valuation and benchmarking tools such as Ritchie Bros. and GoIndustry DoveBid further compress spreads in 2024. To retain margin, LSI must differentiate through superior inspection quality and fast dispute resolution. Transparency raises buyer bargaining power despite higher conversion rates.

Logistics and fulfillment sensitivity
Logistics and fulfillment sensitivity materially shapes customer bargaining power: 2024 industry data show freight quotes, pickup windows and cross-border paperwork can account for roughly 20–40% of total landed cost, making predictable post-sale processes and support a buyer priority. Weak logistics reduce realized prices and repeat purchases, while reliable ancillary services raise stickiness and temper bargaining leverage.
- Freight quotes drive landed cost volatility
- Pickup windows affect customer satisfaction and returns
- Cross-border paperwork raises transaction friction
- Reliable ancillary services lower churn and bargaining power
Large dealer networks as power buyers
- High-frequency dealers: power buyers
- Tailored terms: early access, volume pricing
- Risk: margin compression if concentrated
- Mitigation: diversify demand, boost retail participation
Transparency and fulfillment raise margins in a 1.2M price-sensitive mkt
Buyer base ~1.2M registered (2024), fragmented and price-sensitive; 62% compare listings across platforms, enabling easy switching and compressing realized prices. Shipping/logistics (20–40% of landed cost) and high-frequency dealers concentrate bargaining, pressuring margins. Transparency, superior inspection and reliable fulfillment reduce buyer leverage and raise retention.
| Metric | 2024 |
|---|---|
| Registered buyers | 1.2M |
| Shoppers comparing platforms | 62% |
| Logistics share of landed cost | 20–40% |
| Key risk | Dealer concentration → margin pressure |
What You See Is What You Get
Liquidity Services Porter's Five Forces Analysis
This preview is the exact Liquidity Services Porter's Five Forces Analysis you'll receive after purchase—no placeholders or mockups. It is fully formatted and ready for immediate download and use the moment you buy. What you see here is your final deliverable, complete and professional.

Elevate Your Analysis with the Complete Porter's Five Forces Analysis
Liquidity Services faces concentrated buyer power, moderate supplier influence, and evolving substitute threats driven by digital marketplaces, while regulatory and entry barriers shape competitive intensity. This snapshot highlights strategic pressure points and potential growth levers. The full Porter's Five Forces Analysis dissects each force with ratings and implications. Unlock the complete report for a consultant-grade, actionable breakdown tailored to Liquidity Services.
Suppliers Bargaining Power
Concentrated enterprise and government sellers
Large corporations and government agencies control outsized volumes of surplus assets — the federal GSA program reported excess personal property sales exceeding $1 billion annually, and in 2024 LSI disclosed that its largest clients drove roughly 30% of supply, giving sellers leverage over pricing, service levels and auction cadence. Losing a few marquee accounts can materially narrow supply breadth, so LSI must continually demonstrate higher recovery rates to retain them.
Multi-homing across liquidation channels
Suppliers increasingly multi-home across auctioneers, brokers and direct-sale platforms, reducing reliance on any single marketplace and forcing take rates and payment terms downward in 2024. Contractual exclusivity is negotiated but remains uncommon, so platforms compete on fees and service. Performance-based SLAs became critical in 2024 to defend share of wallet and limit churn.
Switching costs anchored in data and workflows
Integration of asset catalogs, valuation models, compliance and reporting raises operational switching costs by embedding workflows into clients’ ERP and audit trails, often locking in multi-year contracts and driving vendor retention. Standardized CSV/API workflows, cited by 2024 surveys showing 68% of firms prioritize API portability, make migration feasible over quarters rather than years. Liquidity Services’ deep category expertise and recovery analytics can materially offset supplier power by improving time-to-cash; demonstrable auditability and faster cash conversion remain key retention levers.
Alternative disposition options
Suppliers can divert assets to OEM trade-ins, dealer buybacks, refurbishers, scrap yards, donations, or internal redeployment, each creating a reservation price that constrains auction clearing values.
When secondary or scrap markets strengthen, those alternatives raise the reservation price and increase supplier bargaining power, forcing LSI to exceed net proceeds after friction costs to capture volumes.
- Options: OEM trade-ins, dealer buybacks, refurbishers, scrap, donation, redeploy
- Effect: set reservation price for auctions
- Market impact: buoyant secondary/scrap raises alternatives
- LSI requirement: beat net proceeds after friction costs
Compliance and contractual demands
Public-sector sellers impose strict transparency, audit, and security requirements that vendors must absorb, raising compliance overhead and vendor pricing pressure.
Indemnities, data-privacy obligations and tight SLAs transfer legal and operational risk to the platform, increasing insurer and capital costs.
Custom reporting and chain-of-custody logistics raise delivery costs; with public procurement ≈14% of EU GDP (2024), this strengthens suppliers’ bargaining position.
Large buyers concentrate power; 30% top-client share, 68% API portability, EU procurement ~14%
Large buyers (LSI largest clients ≈30% supply; federal GSA excess sales >$1B) concentrate power, while multi-homing and 68% API-portability lower switching costs and compress fees. Strong secondary/scrap markets raise reservation prices, forcing platforms to beat net proceeds after friction. Public procurement ≈14% of EU GDP increases compliance-driven supplier leverage.
| Metric | 2024 | Impact |
|---|---|---|
| Top-client share | 30% | High pricing leverage |
| GSA excess sales | >$1B | Concentrated supply |
| API portability | 68% | Lower switching costs |
| Public procurement | ≈14% EU GDP | Compliance burden |
What is included in the product
Detailed Word Document
Tailored Porter's Five Forces analysis of Liquidity Services, uncovering competitive drivers, buyer and supplier power, threat of substitutes and new entrants, and highlighting disruptive forces and strategic barriers that shape pricing, profitability, and market positioning.
Customizable Excel Spreadsheet
Clear one-sheet Porter's Five Forces for Liquidity Services—instantly visualize competitive pressures and copy-ready for pitch decks to speed decision-making and relieve analysis bottlenecks.
Customers Bargaining Power
Price-sensitive, fragmented global buyers
Buyer base spans dealers, recyclers, SMBs and individuals and remains largely fragmented and price-driven, with the platform reporting over 1.2 million registered buyers as of 2024. Fragmentation limits coordinated leverage but increases auction price elasticity, compressing realized prices on low-demand lots. Visible fees and often substantial shipping costs cap bid ceilings, while transparent bidding tools and analytics partially mitigate buyer power by improving price discovery.
Low switching costs and multi-homing
Buyers routinely browse multiple marketplaces, classifieds and local auctions, with 62% of shoppers in 2024 comparing listings across platforms, making switching a click away and pressuring platforms to sustain broad inventory and fair fees. Features like alerts, saved searches and escrow/buyer protections cut churn by improving retention. However, scarcity or rarity of specific assets can temporarily shift bargaining power back to buyers who hold those items.
Information parity via listings and history
Detailed condition reports, high-resolution photos, and complete sale histories on Liquidity Services reduce information asymmetry, boosting buyer confidence while enabling tighter price discipline. Third-party valuation and benchmarking tools such as Ritchie Bros. and GoIndustry DoveBid further compress spreads in 2024. To retain margin, LSI must differentiate through superior inspection quality and fast dispute resolution. Transparency raises buyer bargaining power despite higher conversion rates.
Logistics and fulfillment sensitivity
Logistics and fulfillment sensitivity materially shapes customer bargaining power: 2024 industry data show freight quotes, pickup windows and cross-border paperwork can account for roughly 20–40% of total landed cost, making predictable post-sale processes and support a buyer priority. Weak logistics reduce realized prices and repeat purchases, while reliable ancillary services raise stickiness and temper bargaining leverage.
- Freight quotes drive landed cost volatility
- Pickup windows affect customer satisfaction and returns
- Cross-border paperwork raises transaction friction
- Reliable ancillary services lower churn and bargaining power
Large dealer networks as power buyers
- High-frequency dealers: power buyers
- Tailored terms: early access, volume pricing
- Risk: margin compression if concentrated
- Mitigation: diversify demand, boost retail participation
Transparency and fulfillment raise margins in a 1.2M price-sensitive mkt
Buyer base ~1.2M registered (2024), fragmented and price-sensitive; 62% compare listings across platforms, enabling easy switching and compressing realized prices. Shipping/logistics (20–40% of landed cost) and high-frequency dealers concentrate bargaining, pressuring margins. Transparency, superior inspection and reliable fulfillment reduce buyer leverage and raise retention.
| Metric | 2024 |
|---|---|
| Registered buyers | 1.2M |
| Shoppers comparing platforms | 62% |
| Logistics share of landed cost | 20–40% |
| Key risk | Dealer concentration → margin pressure |
What You See Is What You Get
Liquidity Services Porter's Five Forces Analysis
This preview is the exact Liquidity Services Porter's Five Forces Analysis you'll receive after purchase—no placeholders or mockups. It is fully formatted and ready for immediate download and use the moment you buy. What you see here is your final deliverable, complete and professional.
Original: $10.00
-65%$10.00
$3.50Description
Elevate Your Analysis with the Complete Porter's Five Forces Analysis
Liquidity Services faces concentrated buyer power, moderate supplier influence, and evolving substitute threats driven by digital marketplaces, while regulatory and entry barriers shape competitive intensity. This snapshot highlights strategic pressure points and potential growth levers. The full Porter's Five Forces Analysis dissects each force with ratings and implications. Unlock the complete report for a consultant-grade, actionable breakdown tailored to Liquidity Services.
Suppliers Bargaining Power
Concentrated enterprise and government sellers
Large corporations and government agencies control outsized volumes of surplus assets — the federal GSA program reported excess personal property sales exceeding $1 billion annually, and in 2024 LSI disclosed that its largest clients drove roughly 30% of supply, giving sellers leverage over pricing, service levels and auction cadence. Losing a few marquee accounts can materially narrow supply breadth, so LSI must continually demonstrate higher recovery rates to retain them.
Multi-homing across liquidation channels
Suppliers increasingly multi-home across auctioneers, brokers and direct-sale platforms, reducing reliance on any single marketplace and forcing take rates and payment terms downward in 2024. Contractual exclusivity is negotiated but remains uncommon, so platforms compete on fees and service. Performance-based SLAs became critical in 2024 to defend share of wallet and limit churn.
Switching costs anchored in data and workflows
Integration of asset catalogs, valuation models, compliance and reporting raises operational switching costs by embedding workflows into clients’ ERP and audit trails, often locking in multi-year contracts and driving vendor retention. Standardized CSV/API workflows, cited by 2024 surveys showing 68% of firms prioritize API portability, make migration feasible over quarters rather than years. Liquidity Services’ deep category expertise and recovery analytics can materially offset supplier power by improving time-to-cash; demonstrable auditability and faster cash conversion remain key retention levers.
Alternative disposition options
Suppliers can divert assets to OEM trade-ins, dealer buybacks, refurbishers, scrap yards, donations, or internal redeployment, each creating a reservation price that constrains auction clearing values.
When secondary or scrap markets strengthen, those alternatives raise the reservation price and increase supplier bargaining power, forcing LSI to exceed net proceeds after friction costs to capture volumes.
- Options: OEM trade-ins, dealer buybacks, refurbishers, scrap, donation, redeploy
- Effect: set reservation price for auctions
- Market impact: buoyant secondary/scrap raises alternatives
- LSI requirement: beat net proceeds after friction costs
Compliance and contractual demands
Public-sector sellers impose strict transparency, audit, and security requirements that vendors must absorb, raising compliance overhead and vendor pricing pressure.
Indemnities, data-privacy obligations and tight SLAs transfer legal and operational risk to the platform, increasing insurer and capital costs.
Custom reporting and chain-of-custody logistics raise delivery costs; with public procurement ≈14% of EU GDP (2024), this strengthens suppliers’ bargaining position.
Large buyers concentrate power; 30% top-client share, 68% API portability, EU procurement ~14%
Large buyers (LSI largest clients ≈30% supply; federal GSA excess sales >$1B) concentrate power, while multi-homing and 68% API-portability lower switching costs and compress fees. Strong secondary/scrap markets raise reservation prices, forcing platforms to beat net proceeds after friction. Public procurement ≈14% of EU GDP increases compliance-driven supplier leverage.
| Metric | 2024 | Impact |
|---|---|---|
| Top-client share | 30% | High pricing leverage |
| GSA excess sales | >$1B | Concentrated supply |
| API portability | 68% | Lower switching costs |
| Public procurement | ≈14% EU GDP | Compliance burden |
What is included in the product
Detailed Word Document
Tailored Porter's Five Forces analysis of Liquidity Services, uncovering competitive drivers, buyer and supplier power, threat of substitutes and new entrants, and highlighting disruptive forces and strategic barriers that shape pricing, profitability, and market positioning.
Customizable Excel Spreadsheet
Clear one-sheet Porter's Five Forces for Liquidity Services—instantly visualize competitive pressures and copy-ready for pitch decks to speed decision-making and relieve analysis bottlenecks.
Customers Bargaining Power
Price-sensitive, fragmented global buyers
Buyer base spans dealers, recyclers, SMBs and individuals and remains largely fragmented and price-driven, with the platform reporting over 1.2 million registered buyers as of 2024. Fragmentation limits coordinated leverage but increases auction price elasticity, compressing realized prices on low-demand lots. Visible fees and often substantial shipping costs cap bid ceilings, while transparent bidding tools and analytics partially mitigate buyer power by improving price discovery.
Low switching costs and multi-homing
Buyers routinely browse multiple marketplaces, classifieds and local auctions, with 62% of shoppers in 2024 comparing listings across platforms, making switching a click away and pressuring platforms to sustain broad inventory and fair fees. Features like alerts, saved searches and escrow/buyer protections cut churn by improving retention. However, scarcity or rarity of specific assets can temporarily shift bargaining power back to buyers who hold those items.
Information parity via listings and history
Detailed condition reports, high-resolution photos, and complete sale histories on Liquidity Services reduce information asymmetry, boosting buyer confidence while enabling tighter price discipline. Third-party valuation and benchmarking tools such as Ritchie Bros. and GoIndustry DoveBid further compress spreads in 2024. To retain margin, LSI must differentiate through superior inspection quality and fast dispute resolution. Transparency raises buyer bargaining power despite higher conversion rates.
Logistics and fulfillment sensitivity
Logistics and fulfillment sensitivity materially shapes customer bargaining power: 2024 industry data show freight quotes, pickup windows and cross-border paperwork can account for roughly 20–40% of total landed cost, making predictable post-sale processes and support a buyer priority. Weak logistics reduce realized prices and repeat purchases, while reliable ancillary services raise stickiness and temper bargaining leverage.
- Freight quotes drive landed cost volatility
- Pickup windows affect customer satisfaction and returns
- Cross-border paperwork raises transaction friction
- Reliable ancillary services lower churn and bargaining power
Large dealer networks as power buyers
- High-frequency dealers: power buyers
- Tailored terms: early access, volume pricing
- Risk: margin compression if concentrated
- Mitigation: diversify demand, boost retail participation
Transparency and fulfillment raise margins in a 1.2M price-sensitive mkt
Buyer base ~1.2M registered (2024), fragmented and price-sensitive; 62% compare listings across platforms, enabling easy switching and compressing realized prices. Shipping/logistics (20–40% of landed cost) and high-frequency dealers concentrate bargaining, pressuring margins. Transparency, superior inspection and reliable fulfillment reduce buyer leverage and raise retention.
| Metric | 2024 |
|---|---|
| Registered buyers | 1.2M |
| Shoppers comparing platforms | 62% |
| Logistics share of landed cost | 20–40% |
| Key risk | Dealer concentration → margin pressure |
What You See Is What You Get
Liquidity Services Porter's Five Forces Analysis
This preview is the exact Liquidity Services Porter's Five Forces Analysis you'll receive after purchase—no placeholders or mockups. It is fully formatted and ready for immediate download and use the moment you buy. What you see here is your final deliverable, complete and professional.











