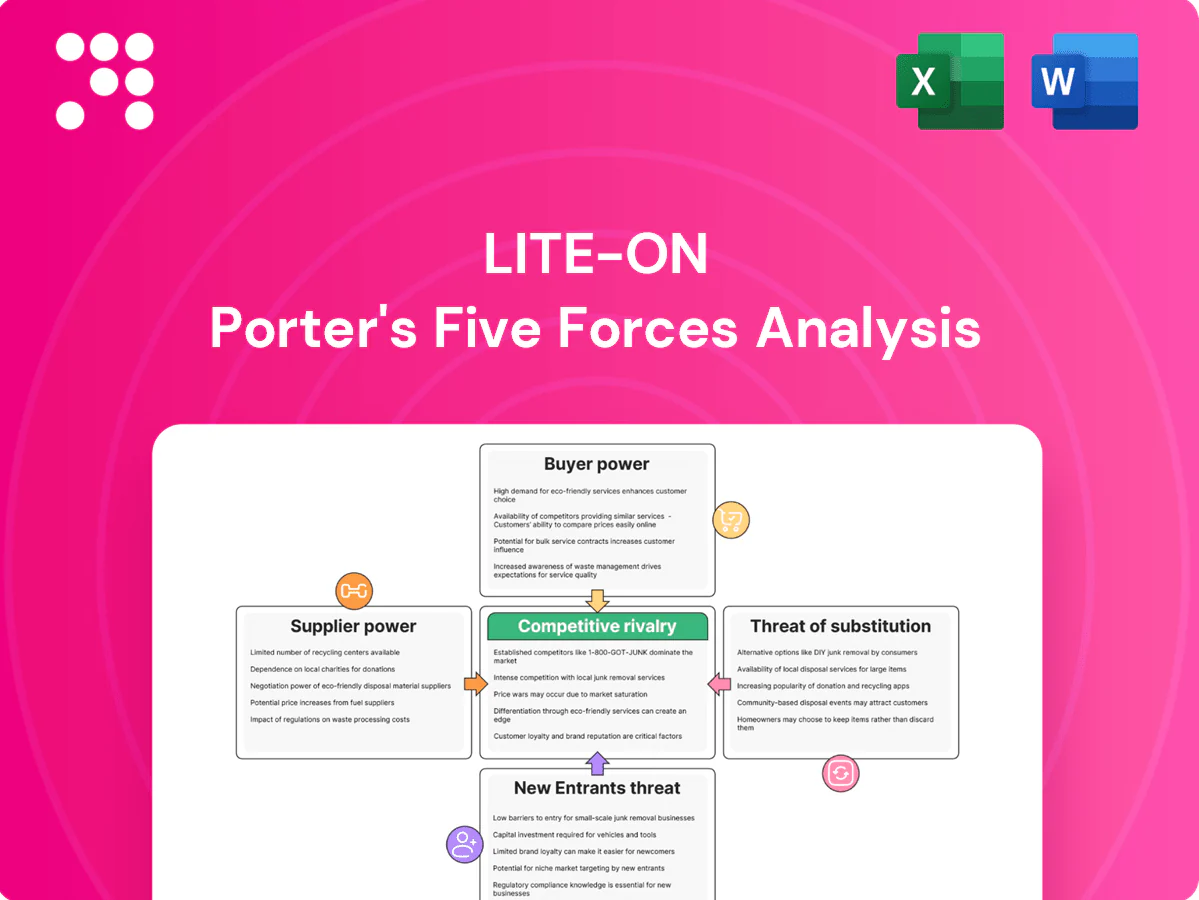
Lite-On Porter's Five Forces Analysis

Elevate Your Analysis with the Complete Porter's Five Forces Analysis
This concise Porter’s Five Forces snapshot outlines Lite‑On’s competitive intensity—supplier and buyer power, threat of entrants and substitutes, and industry rivalry—to help you gauge risk and opportunity. This preview only scratches the surface; unlock the full report for force-by-force ratings, visuals, and actionable strategy insights to inform investment or strategic decisions.
Suppliers Bargaining Power

Key component concentration
Lite-On relies on specialized inputs—LEDs, controllers, substrates and power semiconductors—where supply is concentrated among a handful of vendors; in 2024 GaN/SiC production remained dominated by roughly five major suppliers, keeping leverage high. Limited high-efficiency magnetics capacity and episodic lead-time spikes have driven input cost pressure and delivery risk. Strategic multi-sourcing and long-term agreements (LTAs) have partially mitigated but not eliminated supplier power.
Technology and IP dependency
Upstream innovations in GaN, SiC, advanced drivers and optics are largely supplier-led, and in 2024 leading vendors (Wolfspeed, Infineon, GaN Systems) continue to dominate IP and reference designs, creating meaningful switching costs. License terms and proprietary designs frequently lock Lite-On designs to specific vendors, raising dependency across multi-year product lifecycles. Co-development and long-term supply agreements share value but often entrench supplier influence and limit Lite-On’s bargaining leverage.

Quality and reliability requirements
Automotive IATF 16949 and medical ISO 13485/CE requirements sharply narrow qualified supplier pools, raising entry barriers for component vendors. Fewer qualified vendors increase supplier bargaining power, enabling firmer pricing and terms. Long qualification cycles, typically 6–12 months, reduce Lite-On’s sourcing flexibility. Regular supplier audits and VMI (which can cut inventory ~20%) mitigate risk but do not remove supplier leverage.

Commodity volatility exposure
Commodity volatility exposes Lite-On to metals, resins and rare-earth price swings that suppliers can pass through, while currency moves and freight-rate volatility further amplify upstream bargaining power. Hedging programs and indexed supply contracts introduced in 2023–2024 have reduced short-term P&L sensitivity, yet abrupt market tightness or supply disruptions still pressure margins and lead times. Supply concentration for key rare-earths sustains supplier leverage.
- Metals/resins/rare-earths: pass-through risk
- Currency & freight: amplifies upstream power
- Hedging/indexed contracts: cushions volatility
- Sudden tightness: can still compress margins
Geographic and geopolitical risk
Regional concentration in East Asia exposes Lite-On to disruptions and policy shifts; TSMC held ~54% of the global foundry market in 2024, highlighting supplier concentration. US export controls since 2022 limit access to advanced chip inputs and tariffs raise costs and lead times. Suppliers may reprioritize higher-margin clients; diversification and buffer stocks reduce but do not remove risk.
- East Asia concentration — TSMC ~54% foundry share (2024)
- Export controls since 2022 constrain advanced inputs
- Tariffs increase costs and delays
- Diversification/buffers mitigate but not eliminate risk
GaN/SiC supplier concentration tightens margins; foundry share 54%
High supplier concentration for GaN/SiC, power semis and optics kept leverage high in 2024 (Wolfspeed/Infineon/GaN Systems dominant); switching costs and proprietary IP raise dependency. Qualification requirements (IATF16949/ISO13485) and TSMC ~54% foundry share in 2024 further narrow pools and strengthen supplier pricing power. Hedging/LTAs lower volatility but sudden tightness still compresses margins.
| Metric | 2024 Value | Impact |
|---|---|---|
| Foundry concentration | TSMC ~54% | Higher supply risk |
| GaN/SiC suppliers | ~5 major | High leverage |
What is included in the product
 Detailed Word Document
Tailored Porter's Five Forces analysis for Lite‑On that uncovers key drivers of competition, supplier and buyer power, threat of substitutes and new entrants, and identifies disruptive forces and market entry risks impacting pricing and profitability.

 Customizable Excel Spreadsheet
A clear, one-sheet Porter’s Five Forces summary for Lite-On that instantly highlights competitive pain points and strategic priorities for quick decision-making. Customize pressure levels as market data evolves to test scenarios like supply shocks or new entrants without complex tools.
Customers Bargaining Power

Large OEM/ODM leverage
Major OEM/ODM customers in PC, cloud and automotive — with the top 5 PC vendors holding roughly 70% combined share in 2024 (IDC) and hyperscalers capturing over 60% of cloud infrastructure spend — buy at very high volumes and negotiate aggressively. Their scale enforces strict price, quality and service benchmarks, and they routinely demand engineering support and formal cost‑down roadmaps. For Lite-On this structural dynamic creates sustained pricing pressure on margins.
High switching but dual-sourcing
Qualification costs are high, so buyers mitigate supplier risk by dual-sourcing and keeping Lite-On on approved vendor lists that allow rapid share shifts when price or performance changes. That practice sharply limits Lite-On’s post-qualification pricing latitude despite the upfront barrier to entry. Maintaining long-term performance and supply continuity is therefore essential to retain and grow customer share in 2024.

Customization and design-in power
Customization and design-in wins embed Lite-On early but create NRE exposure often in the 10–20% range of initial contract value and milestone risks that can delay revenue recognition; in 2024 OEM customers exercised stronger leverage for IP transfer or cost transparency, with surveys showing >60% demanding open costing. Late design changes compress margins and schedules; robust project governance and milestone-linked contracts protect economics.

Service-level and lead-time demands
Enterprise and auto customers demand tight OTIF (commonly 95–99% in 2024) and full lifecycle support, shifting bargaining power to buyers. Penalties and scorecards—often impacting low-single-digit percent margins—sharpen that influence and force suppliers to absorb variability. Forecast volatility of 20–30% is frequently pushed upstream, so flexible capacity and mature S&OP are essential to defend commercial terms.
- OTIF targets: 95–99%
- Penalty impact: low-single-digit %
- Forecast volatility: ~20–30%
- Defense: flexible capacity + mature S&OP
Information symmetry
Buyers track component indices and benchmark quotes across suppliers, driving near-real-time price comparisons and shrinking information asymmetry in procurement. Transparency on yields, material costs, and FX exposures further reduces negotiating gaps, while widespread adoption of should-cost models standardizes cost expectations. To sustain pricing power, Lite-On must emphasize differentiated performance metrics tied to reliability, energy efficiency, and integrated services.
- Buyers benchmark across suppliers
- Transparency lowers asymmetry
- Should-cost models common
- Differentiation via performance metrics
Hyperscaler and OEM scale power squeezes margins; NRE, OTIF, dual‑sourcing drive costs
Large OEMs/hyperscalers (top5 PC ~70% share; cloud >60% infra spend in 2024) buy at scale and force price, quality and service terms, keeping Lite-On margin‑pressure high. Dual‑sourcing and high qualification cost limit post‑qualification pricing power; >60% of buyers demand open costing and NRE often 10–20% of initial contract value. OTIF targets 95–99%, penalties shave low‑single‑digit %; forecast volatility ~20–30%.
| Metric | 2024 Value |
|---|---|
| Top5 PC vendors share | ~70% |
| Cloud infra spend (hyperscalers) | >60% |
| Buyers demanding open costing | >60% |
| NRE exposure | 10–20% |
| OTIF targets | 95–99% |
| Forecast volatility | ~20–30% |
| Penalty impact | Low single‑digit % |
Full Version Awaits
Lite-On Porter's Five Forces Analysis
This preview shows the exact Lite-On Porter’s Five Forces analysis you’ll receive upon purchase—no placeholders or mockups. The document is fully formatted and ready for immediate download and use. What you see here is the final deliverable, delivered instantly after payment.

Elevate Your Analysis with the Complete Porter's Five Forces Analysis
This concise Porter’s Five Forces snapshot outlines Lite‑On’s competitive intensity—supplier and buyer power, threat of entrants and substitutes, and industry rivalry—to help you gauge risk and opportunity. This preview only scratches the surface; unlock the full report for force-by-force ratings, visuals, and actionable strategy insights to inform investment or strategic decisions.
Suppliers Bargaining Power
Key component concentration
Lite-On relies on specialized inputs—LEDs, controllers, substrates and power semiconductors—where supply is concentrated among a handful of vendors; in 2024 GaN/SiC production remained dominated by roughly five major suppliers, keeping leverage high. Limited high-efficiency magnetics capacity and episodic lead-time spikes have driven input cost pressure and delivery risk. Strategic multi-sourcing and long-term agreements (LTAs) have partially mitigated but not eliminated supplier power.
Technology and IP dependency
Upstream innovations in GaN, SiC, advanced drivers and optics are largely supplier-led, and in 2024 leading vendors (Wolfspeed, Infineon, GaN Systems) continue to dominate IP and reference designs, creating meaningful switching costs. License terms and proprietary designs frequently lock Lite-On designs to specific vendors, raising dependency across multi-year product lifecycles. Co-development and long-term supply agreements share value but often entrench supplier influence and limit Lite-On’s bargaining leverage.
Quality and reliability requirements
Automotive IATF 16949 and medical ISO 13485/CE requirements sharply narrow qualified supplier pools, raising entry barriers for component vendors. Fewer qualified vendors increase supplier bargaining power, enabling firmer pricing and terms. Long qualification cycles, typically 6–12 months, reduce Lite-On’s sourcing flexibility. Regular supplier audits and VMI (which can cut inventory ~20%) mitigate risk but do not remove supplier leverage.
Commodity volatility exposure
Commodity volatility exposes Lite-On to metals, resins and rare-earth price swings that suppliers can pass through, while currency moves and freight-rate volatility further amplify upstream bargaining power. Hedging programs and indexed supply contracts introduced in 2023–2024 have reduced short-term P&L sensitivity, yet abrupt market tightness or supply disruptions still pressure margins and lead times. Supply concentration for key rare-earths sustains supplier leverage.
- Metals/resins/rare-earths: pass-through risk
- Currency & freight: amplifies upstream power
- Hedging/indexed contracts: cushions volatility
- Sudden tightness: can still compress margins
Geographic and geopolitical risk
Regional concentration in East Asia exposes Lite-On to disruptions and policy shifts; TSMC held ~54% of the global foundry market in 2024, highlighting supplier concentration. US export controls since 2022 limit access to advanced chip inputs and tariffs raise costs and lead times. Suppliers may reprioritize higher-margin clients; diversification and buffer stocks reduce but do not remove risk.
- East Asia concentration — TSMC ~54% foundry share (2024)
- Export controls since 2022 constrain advanced inputs
- Tariffs increase costs and delays
- Diversification/buffers mitigate but not eliminate risk
GaN/SiC supplier concentration tightens margins; foundry share 54%
High supplier concentration for GaN/SiC, power semis and optics kept leverage high in 2024 (Wolfspeed/Infineon/GaN Systems dominant); switching costs and proprietary IP raise dependency. Qualification requirements (IATF16949/ISO13485) and TSMC ~54% foundry share in 2024 further narrow pools and strengthen supplier pricing power. Hedging/LTAs lower volatility but sudden tightness still compresses margins.
| Metric | 2024 Value | Impact |
|---|---|---|
| Foundry concentration | TSMC ~54% | Higher supply risk |
| GaN/SiC suppliers | ~5 major | High leverage |
What is included in the product
Detailed Word Document
Tailored Porter's Five Forces analysis for Lite‑On that uncovers key drivers of competition, supplier and buyer power, threat of substitutes and new entrants, and identifies disruptive forces and market entry risks impacting pricing and profitability.
Customizable Excel Spreadsheet
A clear, one-sheet Porter’s Five Forces summary for Lite-On that instantly highlights competitive pain points and strategic priorities for quick decision-making. Customize pressure levels as market data evolves to test scenarios like supply shocks or new entrants without complex tools.
Customers Bargaining Power
Large OEM/ODM leverage
Major OEM/ODM customers in PC, cloud and automotive — with the top 5 PC vendors holding roughly 70% combined share in 2024 (IDC) and hyperscalers capturing over 60% of cloud infrastructure spend — buy at very high volumes and negotiate aggressively. Their scale enforces strict price, quality and service benchmarks, and they routinely demand engineering support and formal cost‑down roadmaps. For Lite-On this structural dynamic creates sustained pricing pressure on margins.
High switching but dual-sourcing
Qualification costs are high, so buyers mitigate supplier risk by dual-sourcing and keeping Lite-On on approved vendor lists that allow rapid share shifts when price or performance changes. That practice sharply limits Lite-On’s post-qualification pricing latitude despite the upfront barrier to entry. Maintaining long-term performance and supply continuity is therefore essential to retain and grow customer share in 2024.
Customization and design-in power
Customization and design-in wins embed Lite-On early but create NRE exposure often in the 10–20% range of initial contract value and milestone risks that can delay revenue recognition; in 2024 OEM customers exercised stronger leverage for IP transfer or cost transparency, with surveys showing >60% demanding open costing. Late design changes compress margins and schedules; robust project governance and milestone-linked contracts protect economics.
Service-level and lead-time demands
Enterprise and auto customers demand tight OTIF (commonly 95–99% in 2024) and full lifecycle support, shifting bargaining power to buyers. Penalties and scorecards—often impacting low-single-digit percent margins—sharpen that influence and force suppliers to absorb variability. Forecast volatility of 20–30% is frequently pushed upstream, so flexible capacity and mature S&OP are essential to defend commercial terms.
- OTIF targets: 95–99%
- Penalty impact: low-single-digit %
- Forecast volatility: ~20–30%
- Defense: flexible capacity + mature S&OP
Information symmetry
Buyers track component indices and benchmark quotes across suppliers, driving near-real-time price comparisons and shrinking information asymmetry in procurement. Transparency on yields, material costs, and FX exposures further reduces negotiating gaps, while widespread adoption of should-cost models standardizes cost expectations. To sustain pricing power, Lite-On must emphasize differentiated performance metrics tied to reliability, energy efficiency, and integrated services.
- Buyers benchmark across suppliers
- Transparency lowers asymmetry
- Should-cost models common
- Differentiation via performance metrics
Hyperscaler and OEM scale power squeezes margins; NRE, OTIF, dual‑sourcing drive costs
Large OEMs/hyperscalers (top5 PC ~70% share; cloud >60% infra spend in 2024) buy at scale and force price, quality and service terms, keeping Lite-On margin‑pressure high. Dual‑sourcing and high qualification cost limit post‑qualification pricing power; >60% of buyers demand open costing and NRE often 10–20% of initial contract value. OTIF targets 95–99%, penalties shave low‑single‑digit %; forecast volatility ~20–30%.
| Metric | 2024 Value |
|---|---|
| Top5 PC vendors share | ~70% |
| Cloud infra spend (hyperscalers) | >60% |
| Buyers demanding open costing | >60% |
| NRE exposure | 10–20% |
| OTIF targets | 95–99% |
| Forecast volatility | ~20–30% |
| Penalty impact | Low single‑digit % |
Full Version Awaits
Lite-On Porter's Five Forces Analysis
This preview shows the exact Lite-On Porter’s Five Forces analysis you’ll receive upon purchase—no placeholders or mockups. The document is fully formatted and ready for immediate download and use. What you see here is the final deliverable, delivered instantly after payment.
Description
Elevate Your Analysis with the Complete Porter's Five Forces Analysis
This concise Porter’s Five Forces snapshot outlines Lite‑On’s competitive intensity—supplier and buyer power, threat of entrants and substitutes, and industry rivalry—to help you gauge risk and opportunity. This preview only scratches the surface; unlock the full report for force-by-force ratings, visuals, and actionable strategy insights to inform investment or strategic decisions.
Suppliers Bargaining Power
Key component concentration
Lite-On relies on specialized inputs—LEDs, controllers, substrates and power semiconductors—where supply is concentrated among a handful of vendors; in 2024 GaN/SiC production remained dominated by roughly five major suppliers, keeping leverage high. Limited high-efficiency magnetics capacity and episodic lead-time spikes have driven input cost pressure and delivery risk. Strategic multi-sourcing and long-term agreements (LTAs) have partially mitigated but not eliminated supplier power.
Technology and IP dependency
Upstream innovations in GaN, SiC, advanced drivers and optics are largely supplier-led, and in 2024 leading vendors (Wolfspeed, Infineon, GaN Systems) continue to dominate IP and reference designs, creating meaningful switching costs. License terms and proprietary designs frequently lock Lite-On designs to specific vendors, raising dependency across multi-year product lifecycles. Co-development and long-term supply agreements share value but often entrench supplier influence and limit Lite-On’s bargaining leverage.
Quality and reliability requirements
Automotive IATF 16949 and medical ISO 13485/CE requirements sharply narrow qualified supplier pools, raising entry barriers for component vendors. Fewer qualified vendors increase supplier bargaining power, enabling firmer pricing and terms. Long qualification cycles, typically 6–12 months, reduce Lite-On’s sourcing flexibility. Regular supplier audits and VMI (which can cut inventory ~20%) mitigate risk but do not remove supplier leverage.
Commodity volatility exposure
Commodity volatility exposes Lite-On to metals, resins and rare-earth price swings that suppliers can pass through, while currency moves and freight-rate volatility further amplify upstream bargaining power. Hedging programs and indexed supply contracts introduced in 2023–2024 have reduced short-term P&L sensitivity, yet abrupt market tightness or supply disruptions still pressure margins and lead times. Supply concentration for key rare-earths sustains supplier leverage.
- Metals/resins/rare-earths: pass-through risk
- Currency & freight: amplifies upstream power
- Hedging/indexed contracts: cushions volatility
- Sudden tightness: can still compress margins
Geographic and geopolitical risk
Regional concentration in East Asia exposes Lite-On to disruptions and policy shifts; TSMC held ~54% of the global foundry market in 2024, highlighting supplier concentration. US export controls since 2022 limit access to advanced chip inputs and tariffs raise costs and lead times. Suppliers may reprioritize higher-margin clients; diversification and buffer stocks reduce but do not remove risk.
- East Asia concentration — TSMC ~54% foundry share (2024)
- Export controls since 2022 constrain advanced inputs
- Tariffs increase costs and delays
- Diversification/buffers mitigate but not eliminate risk
GaN/SiC supplier concentration tightens margins; foundry share 54%
High supplier concentration for GaN/SiC, power semis and optics kept leverage high in 2024 (Wolfspeed/Infineon/GaN Systems dominant); switching costs and proprietary IP raise dependency. Qualification requirements (IATF16949/ISO13485) and TSMC ~54% foundry share in 2024 further narrow pools and strengthen supplier pricing power. Hedging/LTAs lower volatility but sudden tightness still compresses margins.
| Metric | 2024 Value | Impact |
|---|---|---|
| Foundry concentration | TSMC ~54% | Higher supply risk |
| GaN/SiC suppliers | ~5 major | High leverage |
What is included in the product
Detailed Word Document
Tailored Porter's Five Forces analysis for Lite‑On that uncovers key drivers of competition, supplier and buyer power, threat of substitutes and new entrants, and identifies disruptive forces and market entry risks impacting pricing and profitability.
Customizable Excel Spreadsheet
A clear, one-sheet Porter’s Five Forces summary for Lite-On that instantly highlights competitive pain points and strategic priorities for quick decision-making. Customize pressure levels as market data evolves to test scenarios like supply shocks or new entrants without complex tools.
Customers Bargaining Power
Large OEM/ODM leverage
Major OEM/ODM customers in PC, cloud and automotive — with the top 5 PC vendors holding roughly 70% combined share in 2024 (IDC) and hyperscalers capturing over 60% of cloud infrastructure spend — buy at very high volumes and negotiate aggressively. Their scale enforces strict price, quality and service benchmarks, and they routinely demand engineering support and formal cost‑down roadmaps. For Lite-On this structural dynamic creates sustained pricing pressure on margins.
High switching but dual-sourcing
Qualification costs are high, so buyers mitigate supplier risk by dual-sourcing and keeping Lite-On on approved vendor lists that allow rapid share shifts when price or performance changes. That practice sharply limits Lite-On’s post-qualification pricing latitude despite the upfront barrier to entry. Maintaining long-term performance and supply continuity is therefore essential to retain and grow customer share in 2024.
Customization and design-in power
Customization and design-in wins embed Lite-On early but create NRE exposure often in the 10–20% range of initial contract value and milestone risks that can delay revenue recognition; in 2024 OEM customers exercised stronger leverage for IP transfer or cost transparency, with surveys showing >60% demanding open costing. Late design changes compress margins and schedules; robust project governance and milestone-linked contracts protect economics.
Service-level and lead-time demands
Enterprise and auto customers demand tight OTIF (commonly 95–99% in 2024) and full lifecycle support, shifting bargaining power to buyers. Penalties and scorecards—often impacting low-single-digit percent margins—sharpen that influence and force suppliers to absorb variability. Forecast volatility of 20–30% is frequently pushed upstream, so flexible capacity and mature S&OP are essential to defend commercial terms.
- OTIF targets: 95–99%
- Penalty impact: low-single-digit %
- Forecast volatility: ~20–30%
- Defense: flexible capacity + mature S&OP
Information symmetry
Buyers track component indices and benchmark quotes across suppliers, driving near-real-time price comparisons and shrinking information asymmetry in procurement. Transparency on yields, material costs, and FX exposures further reduces negotiating gaps, while widespread adoption of should-cost models standardizes cost expectations. To sustain pricing power, Lite-On must emphasize differentiated performance metrics tied to reliability, energy efficiency, and integrated services.
- Buyers benchmark across suppliers
- Transparency lowers asymmetry
- Should-cost models common
- Differentiation via performance metrics
Hyperscaler and OEM scale power squeezes margins; NRE, OTIF, dual‑sourcing drive costs
Large OEMs/hyperscalers (top5 PC ~70% share; cloud >60% infra spend in 2024) buy at scale and force price, quality and service terms, keeping Lite-On margin‑pressure high. Dual‑sourcing and high qualification cost limit post‑qualification pricing power; >60% of buyers demand open costing and NRE often 10–20% of initial contract value. OTIF targets 95–99%, penalties shave low‑single‑digit %; forecast volatility ~20–30%.
| Metric | 2024 Value |
|---|---|
| Top5 PC vendors share | ~70% |
| Cloud infra spend (hyperscalers) | >60% |
| Buyers demanding open costing | >60% |
| NRE exposure | 10–20% |
| OTIF targets | 95–99% |
| Forecast volatility | ~20–30% |
| Penalty impact | Low single‑digit % |
Full Version Awaits
Lite-On Porter's Five Forces Analysis
This preview shows the exact Lite-On Porter’s Five Forces analysis you’ll receive upon purchase—no placeholders or mockups. The document is fully formatted and ready for immediate download and use. What you see here is the final deliverable, delivered instantly after payment.











