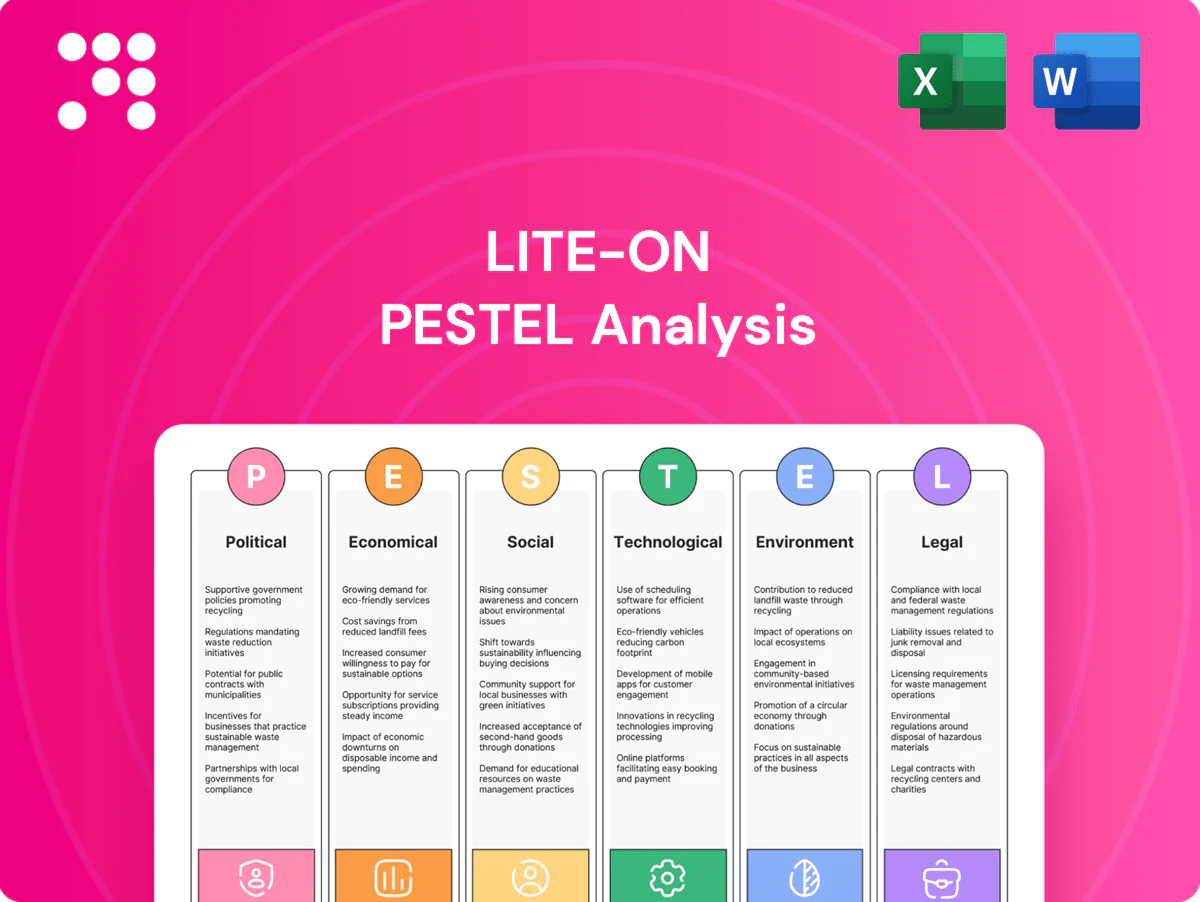
Lite-On PESTLE Analysis

Your Competitive Advantage Starts with This Report
Unlock strategic clarity with our Lite-On PESTLE Analysis—concise insights into political, economic, social, technological, legal, and environmental forces shaping the company. Ideal for investors and strategists seeking a competitive edge. See how risks and opportunities align with your goals. Purchase the full report for the complete, actionable breakdown and downloadable templates.
Political factors

US–China–Taiwan tensions
Geopolitical frictions among the US, China and Taiwan risk disrupting cross-strait logistics, component flows and customer demand planning; about 43% of Taiwan exports went to China and Hong Kong in 2023, concentrating supply-chain exposure. Lite-On must accelerate dual-sourcing and maintain inventory buffers, run maritime/air-route scenario planning, and use transparent stakeholder communications to lower perceived risk premiums.
Export controls and tech sanctions
Expanding US and allied export controls on advanced electronics and semiconductors since 2022–2024 constrain Lite-On product specs and eligible customers. Compliance often forces product reconfiguration and enhanced customer vetting, raising costs and time-to-market. Pipeline risk increases when end-use is ambiguous, leading to order delays. Proactive product classification and export licensing, which can take weeks to months, speeds fulfillment.

Industrial policy and subsidies
Incentives in Taiwan, the US (CHIPS Act ~$39 billion) and the EU (Chips Act mobilizing up to €43 billion) and ASEAN programs can offset capex for automation and new nodes, lowering effective investment costs. Aligning projects with local content and R&D mandates unlocks grants and tax credits; competition is intense with many programs seeing win rates below 25%, so strong ROI cases are required. Participation across jurisdictions diversifies geographic exposure and access to funding pools.

Trade policy and tariffs
Tariff volatility on components and finished goods alters Lite-On’s landed costs and pricing; US Section 301 tariffs covering roughly $370 billion of Chinese imports (still largely in force) increase margin risk and supply-chain premium. Country-of-origin planning and leveraging FTAs can preserve margins, while nearshoring to ASEAN reduces tariff exposure to key markets; contracts should include tariff pass-through clauses.
- Tariff volatility: raises landed costs
- Section 301: ~$370bn impact
- FTAs/COO planning: margin protection
- Nearshoring to ASEAN: lower tariff risk
- Contract: tariff pass-through required
Public health and national security rules
- Localization: plant footprint shifts for supply continuity
- Certifications: NIST/ISO/CMMC often bid prerequisites
- Audit readiness: required to maintain contract eligibility
Geopolitical risk: Taiwan exports 43% to China/HK; nearshoring rises
Geopolitical US–China–Taiwan tensions (43% of Taiwan exports to China/HK in 2023) raise logistics and demand risk; dual-sourcing and inventory buffers are essential. Export controls (US/EU 2022–24) and Section 301 tariffs (~$370bn scope) increase compliance costs and delays. Incentives (US CHIPS ~$39bn; EU ~€43bn) lower capex but competition is fierce; nearshoring to ASEAN reduces tariff exposure.
| Factor | Key metric |
|---|---|
| China/HK export share | 43% (Taiwan, 2023) |
| Section 301 scope | ~$370bn |
| CHIPS/ EU funds | US ~$39bn; EU ~€43bn |
What is included in the product
 Detailed Word Document
Explores how external macro-environmental factors uniquely affect Lite‑On across six dimensions—Political, Economic, Social, Technological, Environmental and Legal—each backed by current data and trend analysis to identify threats and opportunities for executives, consultants and investors.

 Customizable Excel Spreadsheet
A concise, visually segmented PESTLE summary for Lite‑On that’s easy to drop into presentations or share across teams, enabling quick alignment on external risks, market positioning, and region-specific notes during planning sessions.
Economic factors

Semiconductor and electronics cycles
Demand swings in PCs, servers and consumer devices drive wafer fab utilization and pricing volatility—historic cycles show utilization moves of roughly ±20%, pushing spot-price swings and revenue volatility for suppliers like Lite-On. Auto and industrial electronics, with ~USD 600 average semiconductor content per vehicle in 2024, provide partial counter-cyclicality and steadier orders. Flexible capacity and product-mix optimization have helped stabilize margins. Early indicators from customers’ capex plans and server orders guide inventory and working-capital decisions.
FX exposure and cost inflation
Movements in TWD, USD, CNY and EUR materially affect Lite-On revenue translation and input costs: USD/TWD ~31.0, USD/CNY ~7.2 and EUR/USD ~1.09 (July 2025) shift reported NT$ sales and imported BOM costs. Active hedging and currency-matched sourcing have reduced FX volatility on margins. Brent at ~85 USD/bbl and metal price spikes in 2024–25 elevated BOM, while dynamic pricing clauses help protect contribution margins.

Cloud and AI infrastructure spending
Hyperscaler capex exceeded 100 billion USD in 2024, boosting demand for power supplies and optoelectronic modules and driving Lite-On design wins that often translate into 3–5 year revenue visibility. Aligning component lead times with hyperscaler ramp schedules is critical as industry lead times in 2024 averaged roughly 12–16 weeks. Stringent reliability and efficiency specs (eg 80 PLUS Titanium/Platinum class) command premium pricing and higher margins.

Automotive electrification growth
EVs reached about 16% of global new car sales in 2024 and global EV stock surpassed 30 million, expanding addressable markets for Lite-On power and optical components used in EV and ADAS systems. Qualification cycles are long but sticky, creating multi-year revenue once customers approve parts. Zero-defect expectations raise CAPEX and process-control spending; geographic proximity to OEM hubs in China, Europe and North America supports just-in-time models and lower logistics costs.
- Market: EVs ~16% of new sales (2024); global EV stock >30M
- Revenue: qualification yields multi-year stickiness
- Costs: higher CAPEX for zero-defect processes
- Logistics: proximity to OEMs enables JIT and reduced freight
Supply chain diversification to ASEAN
- Resilience: diversify to VN/TH/MY
- Scale: VN 120B USD electronics (2023)
- Cost: tariffs/logistics risk down
- Investment: training + automation
- Support: tax incentives, subsidies
Geopolitical risk: Taiwan exports 43% to China/HK; nearshoring rises
Demand cycles drive ±20% fab utilization swings; hyperscaler capex >100B USD (2024) lifts power/opto demand; EVs 16% of new sales (2024) expand addressable market; FX and commodity moves (USD/TWD 31.0, USD/CNY 7.2, EUR/USD 1.09, Brent ~85 USD/bbl) pressure BOM and translate revenue.
| Metric | 2024/Jul-2025 |
|---|---|
| Fab util swing | ±20% |
| Hyperscaler capex | >100B USD (2024) |
| EV share | 16% |
| FX rates | USD/TWD 31.0; USD/CNY 7.2; EUR/USD 1.09 |
Preview Before You Purchase
Lite-On PESTLE Analysis
The preview shown here is the exact Lite-On PESTLE Analysis document you’ll receive after purchase—fully formatted and ready to use. This is the real file delivered exactly as shown, with complete content and professional structuring. No placeholders or teasers—what you see is what you’ll download immediately after payment.

Your Competitive Advantage Starts with This Report
Unlock strategic clarity with our Lite-On PESTLE Analysis—concise insights into political, economic, social, technological, legal, and environmental forces shaping the company. Ideal for investors and strategists seeking a competitive edge. See how risks and opportunities align with your goals. Purchase the full report for the complete, actionable breakdown and downloadable templates.
Political factors
US–China–Taiwan tensions
Geopolitical frictions among the US, China and Taiwan risk disrupting cross-strait logistics, component flows and customer demand planning; about 43% of Taiwan exports went to China and Hong Kong in 2023, concentrating supply-chain exposure. Lite-On must accelerate dual-sourcing and maintain inventory buffers, run maritime/air-route scenario planning, and use transparent stakeholder communications to lower perceived risk premiums.
Export controls and tech sanctions
Expanding US and allied export controls on advanced electronics and semiconductors since 2022–2024 constrain Lite-On product specs and eligible customers. Compliance often forces product reconfiguration and enhanced customer vetting, raising costs and time-to-market. Pipeline risk increases when end-use is ambiguous, leading to order delays. Proactive product classification and export licensing, which can take weeks to months, speeds fulfillment.
Industrial policy and subsidies
Incentives in Taiwan, the US (CHIPS Act ~$39 billion) and the EU (Chips Act mobilizing up to €43 billion) and ASEAN programs can offset capex for automation and new nodes, lowering effective investment costs. Aligning projects with local content and R&D mandates unlocks grants and tax credits; competition is intense with many programs seeing win rates below 25%, so strong ROI cases are required. Participation across jurisdictions diversifies geographic exposure and access to funding pools.
Trade policy and tariffs
Tariff volatility on components and finished goods alters Lite-On’s landed costs and pricing; US Section 301 tariffs covering roughly $370 billion of Chinese imports (still largely in force) increase margin risk and supply-chain premium. Country-of-origin planning and leveraging FTAs can preserve margins, while nearshoring to ASEAN reduces tariff exposure to key markets; contracts should include tariff pass-through clauses.
- Tariff volatility: raises landed costs
- Section 301: ~$370bn impact
- FTAs/COO planning: margin protection
- Nearshoring to ASEAN: lower tariff risk
- Contract: tariff pass-through required
Public health and national security rules
- Localization: plant footprint shifts for supply continuity
- Certifications: NIST/ISO/CMMC often bid prerequisites
- Audit readiness: required to maintain contract eligibility
Geopolitical risk: Taiwan exports 43% to China/HK; nearshoring rises
Geopolitical US–China–Taiwan tensions (43% of Taiwan exports to China/HK in 2023) raise logistics and demand risk; dual-sourcing and inventory buffers are essential. Export controls (US/EU 2022–24) and Section 301 tariffs (~$370bn scope) increase compliance costs and delays. Incentives (US CHIPS ~$39bn; EU ~€43bn) lower capex but competition is fierce; nearshoring to ASEAN reduces tariff exposure.
| Factor | Key metric |
|---|---|
| China/HK export share | 43% (Taiwan, 2023) |
| Section 301 scope | ~$370bn |
| CHIPS/ EU funds | US ~$39bn; EU ~€43bn |
What is included in the product
Detailed Word Document
Explores how external macro-environmental factors uniquely affect Lite‑On across six dimensions—Political, Economic, Social, Technological, Environmental and Legal—each backed by current data and trend analysis to identify threats and opportunities for executives, consultants and investors.
Customizable Excel Spreadsheet
A concise, visually segmented PESTLE summary for Lite‑On that’s easy to drop into presentations or share across teams, enabling quick alignment on external risks, market positioning, and region-specific notes during planning sessions.
Economic factors
Semiconductor and electronics cycles
Demand swings in PCs, servers and consumer devices drive wafer fab utilization and pricing volatility—historic cycles show utilization moves of roughly ±20%, pushing spot-price swings and revenue volatility for suppliers like Lite-On. Auto and industrial electronics, with ~USD 600 average semiconductor content per vehicle in 2024, provide partial counter-cyclicality and steadier orders. Flexible capacity and product-mix optimization have helped stabilize margins. Early indicators from customers’ capex plans and server orders guide inventory and working-capital decisions.
FX exposure and cost inflation
Movements in TWD, USD, CNY and EUR materially affect Lite-On revenue translation and input costs: USD/TWD ~31.0, USD/CNY ~7.2 and EUR/USD ~1.09 (July 2025) shift reported NT$ sales and imported BOM costs. Active hedging and currency-matched sourcing have reduced FX volatility on margins. Brent at ~85 USD/bbl and metal price spikes in 2024–25 elevated BOM, while dynamic pricing clauses help protect contribution margins.
Cloud and AI infrastructure spending
Hyperscaler capex exceeded 100 billion USD in 2024, boosting demand for power supplies and optoelectronic modules and driving Lite-On design wins that often translate into 3–5 year revenue visibility. Aligning component lead times with hyperscaler ramp schedules is critical as industry lead times in 2024 averaged roughly 12–16 weeks. Stringent reliability and efficiency specs (eg 80 PLUS Titanium/Platinum class) command premium pricing and higher margins.
Automotive electrification growth
EVs reached about 16% of global new car sales in 2024 and global EV stock surpassed 30 million, expanding addressable markets for Lite-On power and optical components used in EV and ADAS systems. Qualification cycles are long but sticky, creating multi-year revenue once customers approve parts. Zero-defect expectations raise CAPEX and process-control spending; geographic proximity to OEM hubs in China, Europe and North America supports just-in-time models and lower logistics costs.
- Market: EVs ~16% of new sales (2024); global EV stock >30M
- Revenue: qualification yields multi-year stickiness
- Costs: higher CAPEX for zero-defect processes
- Logistics: proximity to OEMs enables JIT and reduced freight
Supply chain diversification to ASEAN
- Resilience: diversify to VN/TH/MY
- Scale: VN 120B USD electronics (2023)
- Cost: tariffs/logistics risk down
- Investment: training + automation
- Support: tax incentives, subsidies
Geopolitical risk: Taiwan exports 43% to China/HK; nearshoring rises
Demand cycles drive ±20% fab utilization swings; hyperscaler capex >100B USD (2024) lifts power/opto demand; EVs 16% of new sales (2024) expand addressable market; FX and commodity moves (USD/TWD 31.0, USD/CNY 7.2, EUR/USD 1.09, Brent ~85 USD/bbl) pressure BOM and translate revenue.
| Metric | 2024/Jul-2025 |
|---|---|
| Fab util swing | ±20% |
| Hyperscaler capex | >100B USD (2024) |
| EV share | 16% |
| FX rates | USD/TWD 31.0; USD/CNY 7.2; EUR/USD 1.09 |
Preview Before You Purchase
Lite-On PESTLE Analysis
The preview shown here is the exact Lite-On PESTLE Analysis document you’ll receive after purchase—fully formatted and ready to use. This is the real file delivered exactly as shown, with complete content and professional structuring. No placeholders or teasers—what you see is what you’ll download immediately after payment.
Description
Your Competitive Advantage Starts with This Report
Unlock strategic clarity with our Lite-On PESTLE Analysis—concise insights into political, economic, social, technological, legal, and environmental forces shaping the company. Ideal for investors and strategists seeking a competitive edge. See how risks and opportunities align with your goals. Purchase the full report for the complete, actionable breakdown and downloadable templates.
Political factors
US–China–Taiwan tensions
Geopolitical frictions among the US, China and Taiwan risk disrupting cross-strait logistics, component flows and customer demand planning; about 43% of Taiwan exports went to China and Hong Kong in 2023, concentrating supply-chain exposure. Lite-On must accelerate dual-sourcing and maintain inventory buffers, run maritime/air-route scenario planning, and use transparent stakeholder communications to lower perceived risk premiums.
Export controls and tech sanctions
Expanding US and allied export controls on advanced electronics and semiconductors since 2022–2024 constrain Lite-On product specs and eligible customers. Compliance often forces product reconfiguration and enhanced customer vetting, raising costs and time-to-market. Pipeline risk increases when end-use is ambiguous, leading to order delays. Proactive product classification and export licensing, which can take weeks to months, speeds fulfillment.
Industrial policy and subsidies
Incentives in Taiwan, the US (CHIPS Act ~$39 billion) and the EU (Chips Act mobilizing up to €43 billion) and ASEAN programs can offset capex for automation and new nodes, lowering effective investment costs. Aligning projects with local content and R&D mandates unlocks grants and tax credits; competition is intense with many programs seeing win rates below 25%, so strong ROI cases are required. Participation across jurisdictions diversifies geographic exposure and access to funding pools.
Trade policy and tariffs
Tariff volatility on components and finished goods alters Lite-On’s landed costs and pricing; US Section 301 tariffs covering roughly $370 billion of Chinese imports (still largely in force) increase margin risk and supply-chain premium. Country-of-origin planning and leveraging FTAs can preserve margins, while nearshoring to ASEAN reduces tariff exposure to key markets; contracts should include tariff pass-through clauses.
- Tariff volatility: raises landed costs
- Section 301: ~$370bn impact
- FTAs/COO planning: margin protection
- Nearshoring to ASEAN: lower tariff risk
- Contract: tariff pass-through required
Public health and national security rules
- Localization: plant footprint shifts for supply continuity
- Certifications: NIST/ISO/CMMC often bid prerequisites
- Audit readiness: required to maintain contract eligibility
Geopolitical risk: Taiwan exports 43% to China/HK; nearshoring rises
Geopolitical US–China–Taiwan tensions (43% of Taiwan exports to China/HK in 2023) raise logistics and demand risk; dual-sourcing and inventory buffers are essential. Export controls (US/EU 2022–24) and Section 301 tariffs (~$370bn scope) increase compliance costs and delays. Incentives (US CHIPS ~$39bn; EU ~€43bn) lower capex but competition is fierce; nearshoring to ASEAN reduces tariff exposure.
| Factor | Key metric |
|---|---|
| China/HK export share | 43% (Taiwan, 2023) |
| Section 301 scope | ~$370bn |
| CHIPS/ EU funds | US ~$39bn; EU ~€43bn |
What is included in the product
Detailed Word Document
Explores how external macro-environmental factors uniquely affect Lite‑On across six dimensions—Political, Economic, Social, Technological, Environmental and Legal—each backed by current data and trend analysis to identify threats and opportunities for executives, consultants and investors.
Customizable Excel Spreadsheet
A concise, visually segmented PESTLE summary for Lite‑On that’s easy to drop into presentations or share across teams, enabling quick alignment on external risks, market positioning, and region-specific notes during planning sessions.
Economic factors
Semiconductor and electronics cycles
Demand swings in PCs, servers and consumer devices drive wafer fab utilization and pricing volatility—historic cycles show utilization moves of roughly ±20%, pushing spot-price swings and revenue volatility for suppliers like Lite-On. Auto and industrial electronics, with ~USD 600 average semiconductor content per vehicle in 2024, provide partial counter-cyclicality and steadier orders. Flexible capacity and product-mix optimization have helped stabilize margins. Early indicators from customers’ capex plans and server orders guide inventory and working-capital decisions.
FX exposure and cost inflation
Movements in TWD, USD, CNY and EUR materially affect Lite-On revenue translation and input costs: USD/TWD ~31.0, USD/CNY ~7.2 and EUR/USD ~1.09 (July 2025) shift reported NT$ sales and imported BOM costs. Active hedging and currency-matched sourcing have reduced FX volatility on margins. Brent at ~85 USD/bbl and metal price spikes in 2024–25 elevated BOM, while dynamic pricing clauses help protect contribution margins.
Cloud and AI infrastructure spending
Hyperscaler capex exceeded 100 billion USD in 2024, boosting demand for power supplies and optoelectronic modules and driving Lite-On design wins that often translate into 3–5 year revenue visibility. Aligning component lead times with hyperscaler ramp schedules is critical as industry lead times in 2024 averaged roughly 12–16 weeks. Stringent reliability and efficiency specs (eg 80 PLUS Titanium/Platinum class) command premium pricing and higher margins.
Automotive electrification growth
EVs reached about 16% of global new car sales in 2024 and global EV stock surpassed 30 million, expanding addressable markets for Lite-On power and optical components used in EV and ADAS systems. Qualification cycles are long but sticky, creating multi-year revenue once customers approve parts. Zero-defect expectations raise CAPEX and process-control spending; geographic proximity to OEM hubs in China, Europe and North America supports just-in-time models and lower logistics costs.
- Market: EVs ~16% of new sales (2024); global EV stock >30M
- Revenue: qualification yields multi-year stickiness
- Costs: higher CAPEX for zero-defect processes
- Logistics: proximity to OEMs enables JIT and reduced freight
Supply chain diversification to ASEAN
- Resilience: diversify to VN/TH/MY
- Scale: VN 120B USD electronics (2023)
- Cost: tariffs/logistics risk down
- Investment: training + automation
- Support: tax incentives, subsidies
Geopolitical risk: Taiwan exports 43% to China/HK; nearshoring rises
Demand cycles drive ±20% fab utilization swings; hyperscaler capex >100B USD (2024) lifts power/opto demand; EVs 16% of new sales (2024) expand addressable market; FX and commodity moves (USD/TWD 31.0, USD/CNY 7.2, EUR/USD 1.09, Brent ~85 USD/bbl) pressure BOM and translate revenue.
| Metric | 2024/Jul-2025 |
|---|---|
| Fab util swing | ±20% |
| Hyperscaler capex | >100B USD (2024) |
| EV share | 16% |
| FX rates | USD/TWD 31.0; USD/CNY 7.2; EUR/USD 1.09 |
Preview Before You Purchase
Lite-On PESTLE Analysis
The preview shown here is the exact Lite-On PESTLE Analysis document you’ll receive after purchase—fully formatted and ready to use. This is the real file delivered exactly as shown, with complete content and professional structuring. No placeholders or teasers—what you see is what you’ll download immediately after payment.











