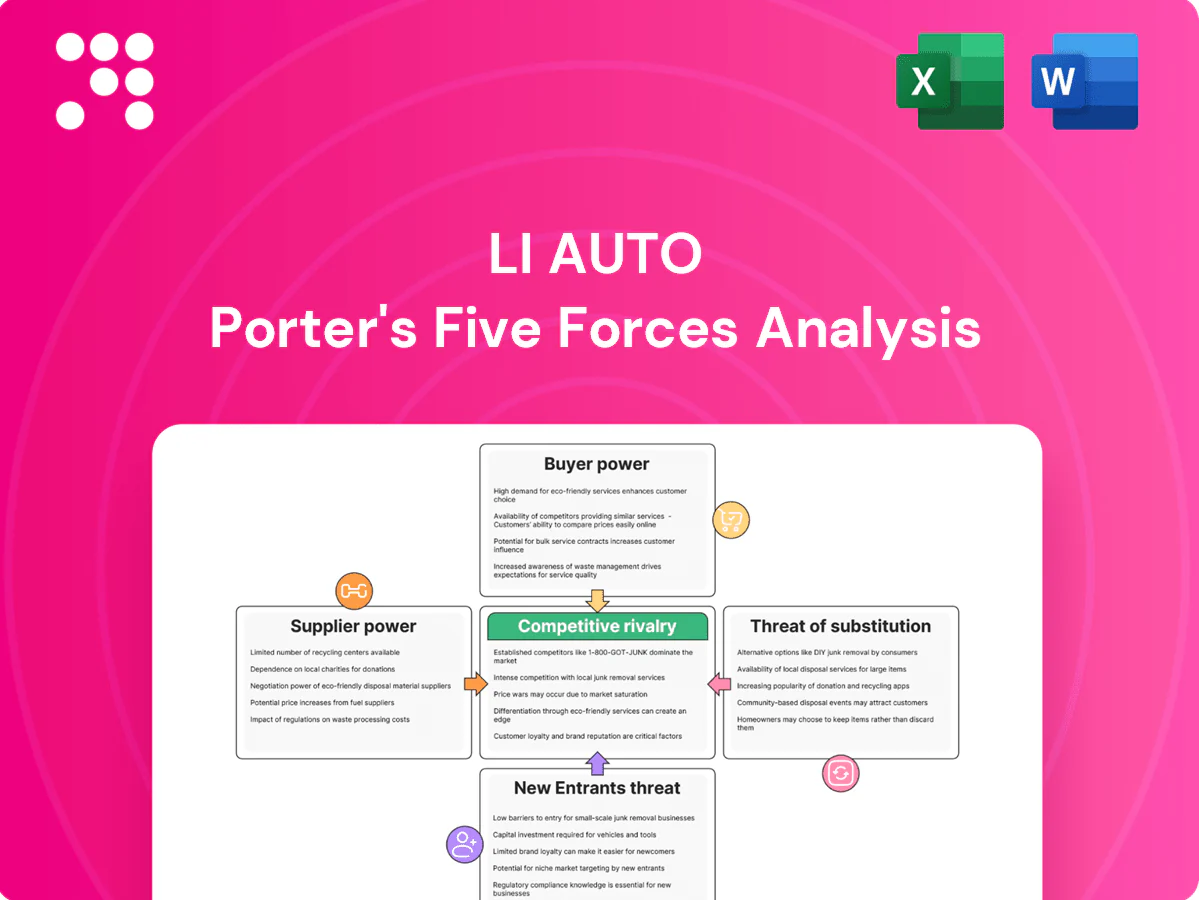
Li Auto Porter's Five Forces Analysis

A Must-Have Tool for Decision-Makers
Li Auto faces moderate supplier power, intense rivalry in China’s EV/PHEV market, rising buyer expectations, manageable substitute threats thanks to its range-extender tech, and notable barriers for new entrants. This snapshot highlights the competitive pressures shaping Li Auto’s strategy. Unlock the full Porter's Five Forces Analysis for force-by-force ratings, visuals, and actionable insights to inform investment or strategy decisions.
Suppliers Bargaining Power

Concentrated battery and chip suppliers
Power-dense cells and automotive-grade chips are concentrated: CATL held about 35% of global EV battery capacity in 2024 and the top five battery makers accounted for roughly 80% of supply, while the automotive semiconductor market was about USD 60B in 2024, limiting substitution for Li Auto’s EREV/BEV cells and ADAS SoCs. Volume contracts and co-development reduce price pressure, but allocation risk in tight cycles and any supplier disruption can delay production and squeeze margins.
Specialized EREV powertrain components
Range-extender engines, generators and high-voltage systems for EREV vehicles need niche expertise and national certifications such as China Compulsory Certification and GB/T electrical standards, constraining the approved supplier pool. The smaller pool raises switching costs and often extends procurement lead times by multiple months. Li Auto's co-engineering relationships deepen supplier dependence while improving integration and system performance. Dual-sourcing is feasible but materially increases cost and time to qualification.

Advanced sensors and software stacks
Lidar, radar, cameras and perception stacks are concentrated among a few tech leaders, giving those suppliers outsized leverage through proprietary interfaces and rapid product cycles. Li Auto’s growing in-house software stack reduces dependency on external perception algorithms but remains tied to hardware roadmaps for sensor capabilities and timelines. Licensing terms and update cadences from key sensor vendors can materially affect Li Auto’s feature rollout pace and incremental costs.

Raw materials and component volatility
Logistics and charging ecosystem partners
Supplier power concentrated: top-5 batteries ~80%, semis USD60B
Supplier power is high: CATL ~35% global EV battery capacity (top5 ~80%), automotive semiconductors market ~USD60B (2024), limiting substitution and raising allocation risk. Niche EREV components and certified HV systems concentrate approved vendors, increasing switching costs despite co-development. Input volatility (battery-grade Li2CO3 ~$35,000/t, LME nickel ~$19,000/t) and charger access (≈3.0M chargers) further tilt leverage to suppliers.
| Metric | 2024 Value |
|---|---|
| CATL share | ~35% |
| Top-5 battery makers | ~80% |
| Auto semiconductors | ~USD60B |
| Li2CO3 price | ~USD35,000/ton |
| LME nickel | ~USD19,000/ton |
| Chargers (China) | ~3.0M |
What is included in the product
 Detailed Word Document
Tailored Porter’s Five Forces analysis for Li Auto that uncovers key competitive drivers, buyer and supplier power, threat of substitutes and new entrants, and disruptive risks to market share. Ideal for investor decks, strategy reports, and editable Word documents to support decision-making and competitive positioning.

 Customizable Excel Spreadsheet
One-sheet Porter’s Five Forces for Li Auto—clean radar chart and editable pressure levels for quick strategic decisions, duplicate tabs for scenarios, no macros, and ready to drop into decks.
Customers Bargaining Power

Premium-segment price sensitivity
Affluent buyers compare total cost of ownership across premium EREVs, BEVs and ICEs, pressuring Li Auto to justify higher ASP through range, features and resale value; transparent pricing and frequent promotions amplify buyer leverage. China’s 1‑year LPR stood at 3.45% in 2024, and after central NEV subsidies were phased out buyers increasingly weight purchase incentives and financing in willingness to pay. Preserving margins depends on clear value-for-money against BEVs and ICE alternatives.
High information availability
Digital channels, owner forums and third-party reviews make Li Auto specs and reported issues highly visible, with over 80% of buyers relying on online information in 2024, raising transparency and scrutiny. Comparability across models and pricing increases buyers’ negotiating power and switching propensity. OTA features are closely compared against rivals’ ecosystems and update cadence. Reputation can swing rapidly after software or quality events, amplifying short-term sales volatility.

Ecosystem and switching costs
Connected services, charging solutions and lifecycle care create soft lock-in for Li Auto, with China NEV penetration about 40% in 2024 increasing competition that can erode exclusivity; trade-in programs and warranties lower perceived risk and buyer power. If rivals offer seamless migration and data portability, switching costs decline. Li Auto’s EREV range advantage remains a strong anchor for range-conscious buyers.

Customization and feature expectations
Buyers demand frequent OTA upgrades, steady ADAS improvements, and high-quality infotainment; when Li Auto misses expected feature cadence buyers can defer purchases or switch to competitors offering faster updates and tailored trims.
- High OTA/ADAS expectations increase buyer leverage
- Demand for tailored trims stresses production flexibility
- Strong product management limits concession risk
Fleet and corporate buyers
Fleet and corporate buyers concentrate volume and bargaining leverage, pushing Li Auto to negotiate on total uptime, charging access and strict service SLAs to secure contracts. Winning tenders often requires discounts or residual value guarantees, while positive fleet references from 2024 corporate pilots help amplify retail demand and partially offset margin concessions.
- Concentrated volumes boost bargaining power
- Uptime, charging and SLAs are key levers
- Discounts/residual guarantees common in tenders
- Fleet references can lift retail sales
TCO focus tightens as China 1-yr LPR 3.45% and ≈80% online buyers squeeze ASPs
Affluent buyers compare TCO across EREV/BEV/ICE, pressuring ASPs; China 1‑yr LPR 3.45% (2024) raises sensitivity to financing and incentives. Online research (≈80% buyers in 2024) amplifies transparency and switching. Fleet concentration forces discounts, SLAs and residual guarantees, while Li Auto’s EREV range remains a key retention lever.
| Metric | 2024 | Impact |
|---|---|---|
| 1-yr LPR | 3.45% | Higher financing sensitivity |
| Online influence | ≈80% | Greater transparency |
| NEV penetration | ≈40% | More competition |
Same Document Delivered
Li Auto Porter's Five Forces Analysis
This preview shows the exact Li Auto Porter’s Five Forces analysis you’ll receive—no placeholders or samples. It’s the final, professionally formatted document ready for immediate download after purchase. Use it as-is for decision-making, presentations, or further research. What you see here is what you get.

A Must-Have Tool for Decision-Makers
Li Auto faces moderate supplier power, intense rivalry in China’s EV/PHEV market, rising buyer expectations, manageable substitute threats thanks to its range-extender tech, and notable barriers for new entrants. This snapshot highlights the competitive pressures shaping Li Auto’s strategy. Unlock the full Porter's Five Forces Analysis for force-by-force ratings, visuals, and actionable insights to inform investment or strategy decisions.
Suppliers Bargaining Power
Concentrated battery and chip suppliers
Power-dense cells and automotive-grade chips are concentrated: CATL held about 35% of global EV battery capacity in 2024 and the top five battery makers accounted for roughly 80% of supply, while the automotive semiconductor market was about USD 60B in 2024, limiting substitution for Li Auto’s EREV/BEV cells and ADAS SoCs. Volume contracts and co-development reduce price pressure, but allocation risk in tight cycles and any supplier disruption can delay production and squeeze margins.
Specialized EREV powertrain components
Range-extender engines, generators and high-voltage systems for EREV vehicles need niche expertise and national certifications such as China Compulsory Certification and GB/T electrical standards, constraining the approved supplier pool. The smaller pool raises switching costs and often extends procurement lead times by multiple months. Li Auto's co-engineering relationships deepen supplier dependence while improving integration and system performance. Dual-sourcing is feasible but materially increases cost and time to qualification.
Advanced sensors and software stacks
Lidar, radar, cameras and perception stacks are concentrated among a few tech leaders, giving those suppliers outsized leverage through proprietary interfaces and rapid product cycles. Li Auto’s growing in-house software stack reduces dependency on external perception algorithms but remains tied to hardware roadmaps for sensor capabilities and timelines. Licensing terms and update cadences from key sensor vendors can materially affect Li Auto’s feature rollout pace and incremental costs.
Raw materials and component volatility
Logistics and charging ecosystem partners
Supplier power concentrated: top-5 batteries ~80%, semis USD60B
Supplier power is high: CATL ~35% global EV battery capacity (top5 ~80%), automotive semiconductors market ~USD60B (2024), limiting substitution and raising allocation risk. Niche EREV components and certified HV systems concentrate approved vendors, increasing switching costs despite co-development. Input volatility (battery-grade Li2CO3 ~$35,000/t, LME nickel ~$19,000/t) and charger access (≈3.0M chargers) further tilt leverage to suppliers.
| Metric | 2024 Value |
|---|---|
| CATL share | ~35% |
| Top-5 battery makers | ~80% |
| Auto semiconductors | ~USD60B |
| Li2CO3 price | ~USD35,000/ton |
| LME nickel | ~USD19,000/ton |
| Chargers (China) | ~3.0M |
What is included in the product
Detailed Word Document
Tailored Porter’s Five Forces analysis for Li Auto that uncovers key competitive drivers, buyer and supplier power, threat of substitutes and new entrants, and disruptive risks to market share. Ideal for investor decks, strategy reports, and editable Word documents to support decision-making and competitive positioning.
Customizable Excel Spreadsheet
One-sheet Porter’s Five Forces for Li Auto—clean radar chart and editable pressure levels for quick strategic decisions, duplicate tabs for scenarios, no macros, and ready to drop into decks.
Customers Bargaining Power
Premium-segment price sensitivity
Affluent buyers compare total cost of ownership across premium EREVs, BEVs and ICEs, pressuring Li Auto to justify higher ASP through range, features and resale value; transparent pricing and frequent promotions amplify buyer leverage. China’s 1‑year LPR stood at 3.45% in 2024, and after central NEV subsidies were phased out buyers increasingly weight purchase incentives and financing in willingness to pay. Preserving margins depends on clear value-for-money against BEVs and ICE alternatives.
High information availability
Digital channels, owner forums and third-party reviews make Li Auto specs and reported issues highly visible, with over 80% of buyers relying on online information in 2024, raising transparency and scrutiny. Comparability across models and pricing increases buyers’ negotiating power and switching propensity. OTA features are closely compared against rivals’ ecosystems and update cadence. Reputation can swing rapidly after software or quality events, amplifying short-term sales volatility.
Ecosystem and switching costs
Connected services, charging solutions and lifecycle care create soft lock-in for Li Auto, with China NEV penetration about 40% in 2024 increasing competition that can erode exclusivity; trade-in programs and warranties lower perceived risk and buyer power. If rivals offer seamless migration and data portability, switching costs decline. Li Auto’s EREV range advantage remains a strong anchor for range-conscious buyers.
Customization and feature expectations
Buyers demand frequent OTA upgrades, steady ADAS improvements, and high-quality infotainment; when Li Auto misses expected feature cadence buyers can defer purchases or switch to competitors offering faster updates and tailored trims.
- High OTA/ADAS expectations increase buyer leverage
- Demand for tailored trims stresses production flexibility
- Strong product management limits concession risk
Fleet and corporate buyers
Fleet and corporate buyers concentrate volume and bargaining leverage, pushing Li Auto to negotiate on total uptime, charging access and strict service SLAs to secure contracts. Winning tenders often requires discounts or residual value guarantees, while positive fleet references from 2024 corporate pilots help amplify retail demand and partially offset margin concessions.
- Concentrated volumes boost bargaining power
- Uptime, charging and SLAs are key levers
- Discounts/residual guarantees common in tenders
- Fleet references can lift retail sales
TCO focus tightens as China 1-yr LPR 3.45% and ≈80% online buyers squeeze ASPs
Affluent buyers compare TCO across EREV/BEV/ICE, pressuring ASPs; China 1‑yr LPR 3.45% (2024) raises sensitivity to financing and incentives. Online research (≈80% buyers in 2024) amplifies transparency and switching. Fleet concentration forces discounts, SLAs and residual guarantees, while Li Auto’s EREV range remains a key retention lever.
| Metric | 2024 | Impact |
|---|---|---|
| 1-yr LPR | 3.45% | Higher financing sensitivity |
| Online influence | ≈80% | Greater transparency |
| NEV penetration | ≈40% | More competition |
Same Document Delivered
Li Auto Porter's Five Forces Analysis
This preview shows the exact Li Auto Porter’s Five Forces analysis you’ll receive—no placeholders or samples. It’s the final, professionally formatted document ready for immediate download after purchase. Use it as-is for decision-making, presentations, or further research. What you see here is what you get.
Description
A Must-Have Tool for Decision-Makers
Li Auto faces moderate supplier power, intense rivalry in China’s EV/PHEV market, rising buyer expectations, manageable substitute threats thanks to its range-extender tech, and notable barriers for new entrants. This snapshot highlights the competitive pressures shaping Li Auto’s strategy. Unlock the full Porter's Five Forces Analysis for force-by-force ratings, visuals, and actionable insights to inform investment or strategy decisions.
Suppliers Bargaining Power
Concentrated battery and chip suppliers
Power-dense cells and automotive-grade chips are concentrated: CATL held about 35% of global EV battery capacity in 2024 and the top five battery makers accounted for roughly 80% of supply, while the automotive semiconductor market was about USD 60B in 2024, limiting substitution for Li Auto’s EREV/BEV cells and ADAS SoCs. Volume contracts and co-development reduce price pressure, but allocation risk in tight cycles and any supplier disruption can delay production and squeeze margins.
Specialized EREV powertrain components
Range-extender engines, generators and high-voltage systems for EREV vehicles need niche expertise and national certifications such as China Compulsory Certification and GB/T electrical standards, constraining the approved supplier pool. The smaller pool raises switching costs and often extends procurement lead times by multiple months. Li Auto's co-engineering relationships deepen supplier dependence while improving integration and system performance. Dual-sourcing is feasible but materially increases cost and time to qualification.
Advanced sensors and software stacks
Lidar, radar, cameras and perception stacks are concentrated among a few tech leaders, giving those suppliers outsized leverage through proprietary interfaces and rapid product cycles. Li Auto’s growing in-house software stack reduces dependency on external perception algorithms but remains tied to hardware roadmaps for sensor capabilities and timelines. Licensing terms and update cadences from key sensor vendors can materially affect Li Auto’s feature rollout pace and incremental costs.
Raw materials and component volatility
Logistics and charging ecosystem partners
Supplier power concentrated: top-5 batteries ~80%, semis USD60B
Supplier power is high: CATL ~35% global EV battery capacity (top5 ~80%), automotive semiconductors market ~USD60B (2024), limiting substitution and raising allocation risk. Niche EREV components and certified HV systems concentrate approved vendors, increasing switching costs despite co-development. Input volatility (battery-grade Li2CO3 ~$35,000/t, LME nickel ~$19,000/t) and charger access (≈3.0M chargers) further tilt leverage to suppliers.
| Metric | 2024 Value |
|---|---|
| CATL share | ~35% |
| Top-5 battery makers | ~80% |
| Auto semiconductors | ~USD60B |
| Li2CO3 price | ~USD35,000/ton |
| LME nickel | ~USD19,000/ton |
| Chargers (China) | ~3.0M |
What is included in the product
Detailed Word Document
Tailored Porter’s Five Forces analysis for Li Auto that uncovers key competitive drivers, buyer and supplier power, threat of substitutes and new entrants, and disruptive risks to market share. Ideal for investor decks, strategy reports, and editable Word documents to support decision-making and competitive positioning.
Customizable Excel Spreadsheet
One-sheet Porter’s Five Forces for Li Auto—clean radar chart and editable pressure levels for quick strategic decisions, duplicate tabs for scenarios, no macros, and ready to drop into decks.
Customers Bargaining Power
Premium-segment price sensitivity
Affluent buyers compare total cost of ownership across premium EREVs, BEVs and ICEs, pressuring Li Auto to justify higher ASP through range, features and resale value; transparent pricing and frequent promotions amplify buyer leverage. China’s 1‑year LPR stood at 3.45% in 2024, and after central NEV subsidies were phased out buyers increasingly weight purchase incentives and financing in willingness to pay. Preserving margins depends on clear value-for-money against BEVs and ICE alternatives.
High information availability
Digital channels, owner forums and third-party reviews make Li Auto specs and reported issues highly visible, with over 80% of buyers relying on online information in 2024, raising transparency and scrutiny. Comparability across models and pricing increases buyers’ negotiating power and switching propensity. OTA features are closely compared against rivals’ ecosystems and update cadence. Reputation can swing rapidly after software or quality events, amplifying short-term sales volatility.
Ecosystem and switching costs
Connected services, charging solutions and lifecycle care create soft lock-in for Li Auto, with China NEV penetration about 40% in 2024 increasing competition that can erode exclusivity; trade-in programs and warranties lower perceived risk and buyer power. If rivals offer seamless migration and data portability, switching costs decline. Li Auto’s EREV range advantage remains a strong anchor for range-conscious buyers.
Customization and feature expectations
Buyers demand frequent OTA upgrades, steady ADAS improvements, and high-quality infotainment; when Li Auto misses expected feature cadence buyers can defer purchases or switch to competitors offering faster updates and tailored trims.
- High OTA/ADAS expectations increase buyer leverage
- Demand for tailored trims stresses production flexibility
- Strong product management limits concession risk
Fleet and corporate buyers
Fleet and corporate buyers concentrate volume and bargaining leverage, pushing Li Auto to negotiate on total uptime, charging access and strict service SLAs to secure contracts. Winning tenders often requires discounts or residual value guarantees, while positive fleet references from 2024 corporate pilots help amplify retail demand and partially offset margin concessions.
- Concentrated volumes boost bargaining power
- Uptime, charging and SLAs are key levers
- Discounts/residual guarantees common in tenders
- Fleet references can lift retail sales
TCO focus tightens as China 1-yr LPR 3.45% and ≈80% online buyers squeeze ASPs
Affluent buyers compare TCO across EREV/BEV/ICE, pressuring ASPs; China 1‑yr LPR 3.45% (2024) raises sensitivity to financing and incentives. Online research (≈80% buyers in 2024) amplifies transparency and switching. Fleet concentration forces discounts, SLAs and residual guarantees, while Li Auto’s EREV range remains a key retention lever.
| Metric | 2024 | Impact |
|---|---|---|
| 1-yr LPR | 3.45% | Higher financing sensitivity |
| Online influence | ≈80% | Greater transparency |
| NEV penetration | ≈40% | More competition |
Same Document Delivered
Li Auto Porter's Five Forces Analysis
This preview shows the exact Li Auto Porter’s Five Forces analysis you’ll receive—no placeholders or samples. It’s the final, professionally formatted document ready for immediate download after purchase. Use it as-is for decision-making, presentations, or further research. What you see here is what you get.











