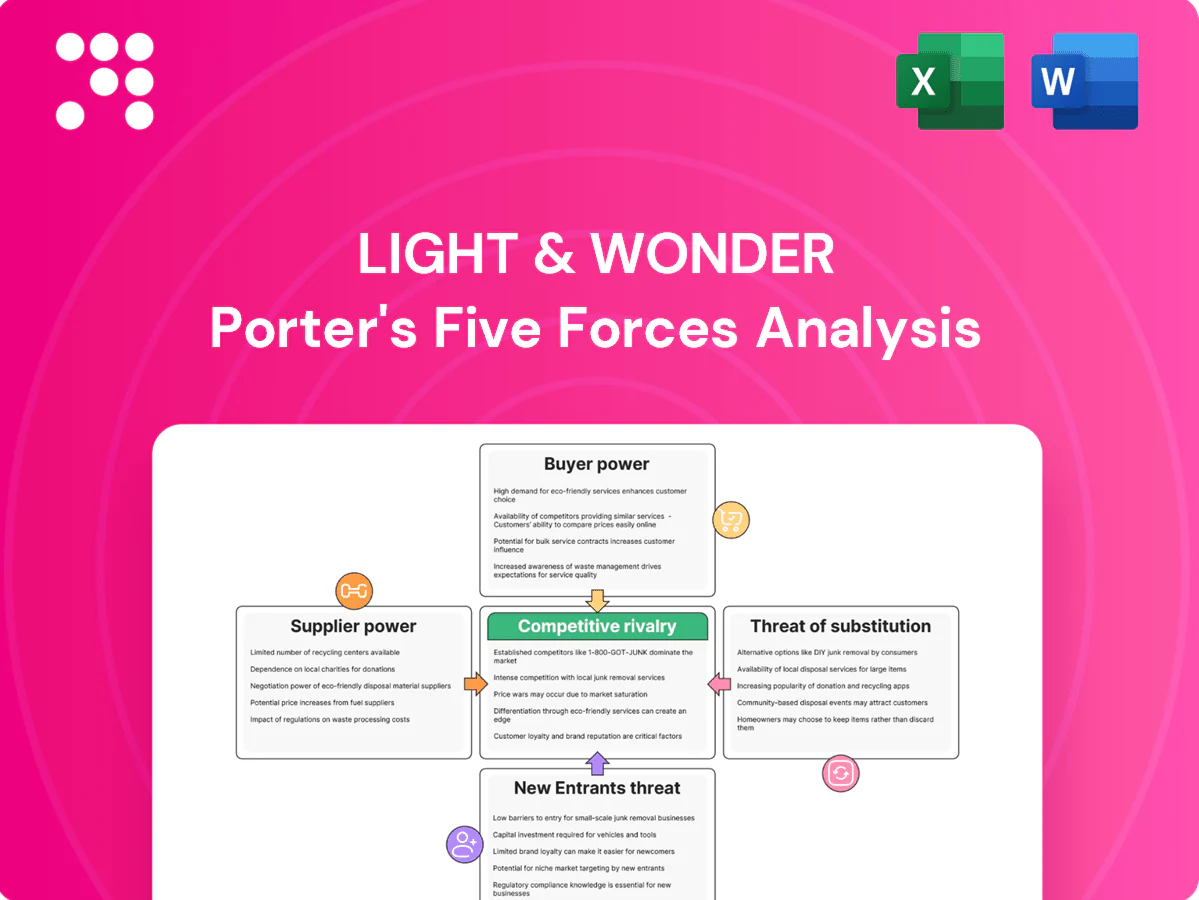
Light & Wonder Porter's Five Forces Analysis

Go Beyond the Preview—Access the Full Strategic Report
Light & Wonder’s Porter's Five Forces snapshot highlights supplier leverage, buyer dynamics, competitive rivalry, entry barriers and substitutes—revealing where strategic risk and opportunity lie; this brief only scratches the surface, unlock the full report for force-by-force ratings, visuals and actionable insights to inform investment or strategy.
Suppliers Bargaining Power

Concentrated hardware component vendors
Light & Wonder depends on specialized suppliers for cabinets, displays, secure controllers and gaming CPUs/GPUs; NVIDIA held about 80% of the discrete GPU market in 2024 while AMD supplied most of the remainder, concentrating leverage with a few certified makers. Lead-time volatility and silicon cycles heighten pricing power; multi-sourcing and strategic inventory reduce but do not remove exposure.
Content/IP and math model licensors
Branded IP, licensed themes and scarce math-model licensors raise supplier power, with industry licensing royalty rates commonly in the 10–20% range and large franchises often requiring upfront fees that compress operator margins. Popular franchises can shift economics via guaranteed minimums and tiered royalties. Light & Wonder’s in‑house studios and a broad portfolio reduce reliance on external IP, enabling trade-offs and stronger negotiation leverage across titles and channels.

Platform and middleware dependencies
Game engines, compliance toolkits and aggregation layers create strong lock-in; Unity and Unreal together powered over 70% of commercial game titles in 2024, amplifying supplier leverage. Vendors controlling critical APIs or certification paths can dictate timelines and terms, with re-certification and cross-jurisdiction QA often adding 3–9 months to launches. High switching costs push operators toward long-term framework agreements, which in practice cap annual cost escalators and stabilize multi-year budgets.

Payments, cloud, and data infrastructure
Payments, cloud, and data infrastructure exert notable supplier power for Light & Wonder: real-money and social ops rely on gateways, fraud/AML tools, and cloud compute (global public cloud spend ~$600B in 2024), with payment fees typically 1.5–3.5% and chargebacks averaging ~$100 each, giving providers leverage via fees, chargebacks, and compliance obligations.
Outages or policy shifts can dent uptime and revenue-share economics (major 2024 cloud outages caused multi-day disruptions and material revenue impacts), so diversification across providers and selective in-house tooling are key mitigants.
- Dependency: gateways, fraud/AML, cloud
- Costs: fees 1.5–3.5%, chargeback ~$100
- Risk: 2024 outages → revenue hit
- Mitigation: multi-vendor + in-house tools
Regulatory testing labs and certifiers
Independent regulatory testing labs act as gatekeepers for market access; 2024 industry reports note queue times up to 12 weeks, directly impacting product roadmaps and holding development costs for Light & Wonder.
Limited alternatives in some jurisdictions increase supplier bargaining power, raising certification premiums and scheduling leverage; proactive compliance design and early engagement can shorten cycles and reduce rework.
- Queue times: up to 12 weeks (2024)
- High supplier leverage in restricted jurisdictions
- Early engagement cuts rework and time-to-market
Supplier concentration: NVIDIA ~80%, Unity+Unreal >70%, raising costs & delays
Light & Wonder faces concentrated hardware and IP suppliers: NVIDIA ~80% discrete GPU share (2024) and licensing royalties typically 10–20%, giving suppliers pricing leverage.
Core engines Unity+Unreal powered >70% of titles (2024), raising switching costs and timeline risk (re-certification adds 3–9 months).
Payments/cloud fees (payments 1.5–3.5%; global cloud spend ~$600B in 2024) and testing queues (~12 weeks) create operational exposure; multi-vendor and selective insourcing mitigate.
| Factor | 2024 Metric |
|---|---|
| GPU share | ~80% NVIDIA |
| Engines | >70% Unity+Unreal |
| Licensing | 10–20% royalties |
| Payments | 1.5–3.5% fees |
| Cloud spend | ~$600B |
| Cert queues | ~12 weeks |
What is included in the product
 Detailed Word Document
Concise Porter's Five Forces assessment tailored to Light & Wonder, revealing competitive intensity, buyer and supplier leverage, substitution risks, and barriers to entry to inform strategic positioning and valuation.

 Customizable Excel Spreadsheet
A clear one-sheet Porter's Five Forces analysis tailored to Light & Wonder—perfect for quick strategic decisions and investor decks. Editable pressure levels and an instant spider chart let you run scenarios and present insights fast, no macros or complex code required.
Customers Bargaining Power

Consolidated casino and iGaming operators
Consolidated casino and iGaming operators exert strong buyer power: scale lets groups secure volume discounts, custom terms and run RFPs and vendor bake-offs. In the US FanDuel held roughly 40% share of online sports betting in 2024 and the top four operators captured over 80% of online sports betting revenue, enabling demands for performance‑based pricing and SLAs. Deep supplier relationships and exclusive content reduce pure price pressure.
High switching costs vs. multi-sourcing
Integration, staff training, and regulatory re-certification create significant switching costs for operators dealing with Light & Wonder, reinforcing vendor lock-in even as the global gaming market exceeded $500 billion in 2024. Many buyers still dual-source to preserve leverage and mitigate supplier risk, which tempers lock-in and forces continuous innovation and support. Strong account management and data-driven ROI metrics are critical to retain share.

Revenue-share and floor performance scrutiny
Operators closely track coin-in, hold and unit yield to justify rev-share deals, and titles that underperform on those metrics are rapidly rotated off floors or lobbies, enabling buyers to reallocate wallet to top-performing content. This dynamic gives customers leverage in contract terms and placement, but Light & Wonder’s consistent hit rates and real-time analytics strengthen its negotiating position. Operators’ ability to shift spend toward proven hits forces L&W to demonstrate sustained unit yield and engagement.

Digital distribution gatekeepers
Digital distribution gatekeepers (app stores, aggregators, regulated platforms) control access and fees—typical commission tiers range 15–30% (Apple/Google programs). Feature placement and certification windows materially affect conversion and ARPDAU. Buyers can request bespoke features and promotional support. Strong platform relationships and cross-promotions reduce single-platform dependency.
- App stores: 15–30% commission tiers
- Feature placement drives conversion/ARPDAU
- Buyers demand bespoke features/promos
- Platform partnerships cut dependency
Global reach with local requirements
Global operators demand localization, responsible gaming and jurisdictional compliance, shifting bargaining power to buyers as custom roadmaps and integrations raise supplier effort. Meeting local content preferences is now a negotiable commercial term. Modular architecture and reusable components limit cost-to-serve, aiding scale; global online gambling GGR reached about $68 billion in 2024.
- Localization increases buyer leverage
- Custom integrations raise supplier effort
- Modularity controls cost-to-serve
Top-four US sportsbooks control >80% market; leader ~40% enforces performance pricing
Large consolidated operators hold strong leverage—top-four US online sportsbooks >80% share, FanDuel ~40% in 2024—driving performance‑based pricing and placement demands. Switching costs (integration, recertification) reinforce lock‑in, but dual‑sourcing and ROI metrics limit pricing power. App store fees (15–30%) and localization needs shift negotiation to buyers.
| Metric | 2024 |
|---|---|
| Global gaming market | >$500bn |
| Online GGR | $68bn |
| Top4 US share | >80% |
| FanDuel share | ~40% |
| App store fees | 15–30% |
Preview the Actual Deliverable
Light & Wonder Porter's Five Forces Analysis
This preview shows the exact Light & Wonder Porter's Five Forces Analysis you'll receive immediately after purchase—no surprises, no placeholders. The document displayed here is fully formatted, professionally written and ready for download and use the moment you buy. You're looking at the actual deliverable; once payment is complete you’ll get instant access to this identical file.

Go Beyond the Preview—Access the Full Strategic Report
Light & Wonder’s Porter's Five Forces snapshot highlights supplier leverage, buyer dynamics, competitive rivalry, entry barriers and substitutes—revealing where strategic risk and opportunity lie; this brief only scratches the surface, unlock the full report for force-by-force ratings, visuals and actionable insights to inform investment or strategy.
Suppliers Bargaining Power
Concentrated hardware component vendors
Light & Wonder depends on specialized suppliers for cabinets, displays, secure controllers and gaming CPUs/GPUs; NVIDIA held about 80% of the discrete GPU market in 2024 while AMD supplied most of the remainder, concentrating leverage with a few certified makers. Lead-time volatility and silicon cycles heighten pricing power; multi-sourcing and strategic inventory reduce but do not remove exposure.
Content/IP and math model licensors
Branded IP, licensed themes and scarce math-model licensors raise supplier power, with industry licensing royalty rates commonly in the 10–20% range and large franchises often requiring upfront fees that compress operator margins. Popular franchises can shift economics via guaranteed minimums and tiered royalties. Light & Wonder’s in‑house studios and a broad portfolio reduce reliance on external IP, enabling trade-offs and stronger negotiation leverage across titles and channels.
Platform and middleware dependencies
Game engines, compliance toolkits and aggregation layers create strong lock-in; Unity and Unreal together powered over 70% of commercial game titles in 2024, amplifying supplier leverage. Vendors controlling critical APIs or certification paths can dictate timelines and terms, with re-certification and cross-jurisdiction QA often adding 3–9 months to launches. High switching costs push operators toward long-term framework agreements, which in practice cap annual cost escalators and stabilize multi-year budgets.
Payments, cloud, and data infrastructure
Payments, cloud, and data infrastructure exert notable supplier power for Light & Wonder: real-money and social ops rely on gateways, fraud/AML tools, and cloud compute (global public cloud spend ~$600B in 2024), with payment fees typically 1.5–3.5% and chargebacks averaging ~$100 each, giving providers leverage via fees, chargebacks, and compliance obligations.
Outages or policy shifts can dent uptime and revenue-share economics (major 2024 cloud outages caused multi-day disruptions and material revenue impacts), so diversification across providers and selective in-house tooling are key mitigants.
- Dependency: gateways, fraud/AML, cloud
- Costs: fees 1.5–3.5%, chargeback ~$100
- Risk: 2024 outages → revenue hit
- Mitigation: multi-vendor + in-house tools
Regulatory testing labs and certifiers
Independent regulatory testing labs act as gatekeepers for market access; 2024 industry reports note queue times up to 12 weeks, directly impacting product roadmaps and holding development costs for Light & Wonder.
Limited alternatives in some jurisdictions increase supplier bargaining power, raising certification premiums and scheduling leverage; proactive compliance design and early engagement can shorten cycles and reduce rework.
- Queue times: up to 12 weeks (2024)
- High supplier leverage in restricted jurisdictions
- Early engagement cuts rework and time-to-market
Supplier concentration: NVIDIA ~80%, Unity+Unreal >70%, raising costs & delays
Light & Wonder faces concentrated hardware and IP suppliers: NVIDIA ~80% discrete GPU share (2024) and licensing royalties typically 10–20%, giving suppliers pricing leverage.
Core engines Unity+Unreal powered >70% of titles (2024), raising switching costs and timeline risk (re-certification adds 3–9 months).
Payments/cloud fees (payments 1.5–3.5%; global cloud spend ~$600B in 2024) and testing queues (~12 weeks) create operational exposure; multi-vendor and selective insourcing mitigate.
| Factor | 2024 Metric |
|---|---|
| GPU share | ~80% NVIDIA |
| Engines | >70% Unity+Unreal |
| Licensing | 10–20% royalties |
| Payments | 1.5–3.5% fees |
| Cloud spend | ~$600B |
| Cert queues | ~12 weeks |
What is included in the product
Detailed Word Document
Concise Porter's Five Forces assessment tailored to Light & Wonder, revealing competitive intensity, buyer and supplier leverage, substitution risks, and barriers to entry to inform strategic positioning and valuation.
Customizable Excel Spreadsheet
A clear one-sheet Porter's Five Forces analysis tailored to Light & Wonder—perfect for quick strategic decisions and investor decks. Editable pressure levels and an instant spider chart let you run scenarios and present insights fast, no macros or complex code required.
Customers Bargaining Power
Consolidated casino and iGaming operators
Consolidated casino and iGaming operators exert strong buyer power: scale lets groups secure volume discounts, custom terms and run RFPs and vendor bake-offs. In the US FanDuel held roughly 40% share of online sports betting in 2024 and the top four operators captured over 80% of online sports betting revenue, enabling demands for performance‑based pricing and SLAs. Deep supplier relationships and exclusive content reduce pure price pressure.
High switching costs vs. multi-sourcing
Integration, staff training, and regulatory re-certification create significant switching costs for operators dealing with Light & Wonder, reinforcing vendor lock-in even as the global gaming market exceeded $500 billion in 2024. Many buyers still dual-source to preserve leverage and mitigate supplier risk, which tempers lock-in and forces continuous innovation and support. Strong account management and data-driven ROI metrics are critical to retain share.
Revenue-share and floor performance scrutiny
Operators closely track coin-in, hold and unit yield to justify rev-share deals, and titles that underperform on those metrics are rapidly rotated off floors or lobbies, enabling buyers to reallocate wallet to top-performing content. This dynamic gives customers leverage in contract terms and placement, but Light & Wonder’s consistent hit rates and real-time analytics strengthen its negotiating position. Operators’ ability to shift spend toward proven hits forces L&W to demonstrate sustained unit yield and engagement.
Digital distribution gatekeepers
Digital distribution gatekeepers (app stores, aggregators, regulated platforms) control access and fees—typical commission tiers range 15–30% (Apple/Google programs). Feature placement and certification windows materially affect conversion and ARPDAU. Buyers can request bespoke features and promotional support. Strong platform relationships and cross-promotions reduce single-platform dependency.
- App stores: 15–30% commission tiers
- Feature placement drives conversion/ARPDAU
- Buyers demand bespoke features/promos
- Platform partnerships cut dependency
Global reach with local requirements
Global operators demand localization, responsible gaming and jurisdictional compliance, shifting bargaining power to buyers as custom roadmaps and integrations raise supplier effort. Meeting local content preferences is now a negotiable commercial term. Modular architecture and reusable components limit cost-to-serve, aiding scale; global online gambling GGR reached about $68 billion in 2024.
- Localization increases buyer leverage
- Custom integrations raise supplier effort
- Modularity controls cost-to-serve
Top-four US sportsbooks control >80% market; leader ~40% enforces performance pricing
Large consolidated operators hold strong leverage—top-four US online sportsbooks >80% share, FanDuel ~40% in 2024—driving performance‑based pricing and placement demands. Switching costs (integration, recertification) reinforce lock‑in, but dual‑sourcing and ROI metrics limit pricing power. App store fees (15–30%) and localization needs shift negotiation to buyers.
| Metric | 2024 |
|---|---|
| Global gaming market | >$500bn |
| Online GGR | $68bn |
| Top4 US share | >80% |
| FanDuel share | ~40% |
| App store fees | 15–30% |
Preview the Actual Deliverable
Light & Wonder Porter's Five Forces Analysis
This preview shows the exact Light & Wonder Porter's Five Forces Analysis you'll receive immediately after purchase—no surprises, no placeholders. The document displayed here is fully formatted, professionally written and ready for download and use the moment you buy. You're looking at the actual deliverable; once payment is complete you’ll get instant access to this identical file.
Original: $10.00
-65%$10.00
$3.50Description
Go Beyond the Preview—Access the Full Strategic Report
Light & Wonder’s Porter's Five Forces snapshot highlights supplier leverage, buyer dynamics, competitive rivalry, entry barriers and substitutes—revealing where strategic risk and opportunity lie; this brief only scratches the surface, unlock the full report for force-by-force ratings, visuals and actionable insights to inform investment or strategy.
Suppliers Bargaining Power
Concentrated hardware component vendors
Light & Wonder depends on specialized suppliers for cabinets, displays, secure controllers and gaming CPUs/GPUs; NVIDIA held about 80% of the discrete GPU market in 2024 while AMD supplied most of the remainder, concentrating leverage with a few certified makers. Lead-time volatility and silicon cycles heighten pricing power; multi-sourcing and strategic inventory reduce but do not remove exposure.
Content/IP and math model licensors
Branded IP, licensed themes and scarce math-model licensors raise supplier power, with industry licensing royalty rates commonly in the 10–20% range and large franchises often requiring upfront fees that compress operator margins. Popular franchises can shift economics via guaranteed minimums and tiered royalties. Light & Wonder’s in‑house studios and a broad portfolio reduce reliance on external IP, enabling trade-offs and stronger negotiation leverage across titles and channels.
Platform and middleware dependencies
Game engines, compliance toolkits and aggregation layers create strong lock-in; Unity and Unreal together powered over 70% of commercial game titles in 2024, amplifying supplier leverage. Vendors controlling critical APIs or certification paths can dictate timelines and terms, with re-certification and cross-jurisdiction QA often adding 3–9 months to launches. High switching costs push operators toward long-term framework agreements, which in practice cap annual cost escalators and stabilize multi-year budgets.
Payments, cloud, and data infrastructure
Payments, cloud, and data infrastructure exert notable supplier power for Light & Wonder: real-money and social ops rely on gateways, fraud/AML tools, and cloud compute (global public cloud spend ~$600B in 2024), with payment fees typically 1.5–3.5% and chargebacks averaging ~$100 each, giving providers leverage via fees, chargebacks, and compliance obligations.
Outages or policy shifts can dent uptime and revenue-share economics (major 2024 cloud outages caused multi-day disruptions and material revenue impacts), so diversification across providers and selective in-house tooling are key mitigants.
- Dependency: gateways, fraud/AML, cloud
- Costs: fees 1.5–3.5%, chargeback ~$100
- Risk: 2024 outages → revenue hit
- Mitigation: multi-vendor + in-house tools
Regulatory testing labs and certifiers
Independent regulatory testing labs act as gatekeepers for market access; 2024 industry reports note queue times up to 12 weeks, directly impacting product roadmaps and holding development costs for Light & Wonder.
Limited alternatives in some jurisdictions increase supplier bargaining power, raising certification premiums and scheduling leverage; proactive compliance design and early engagement can shorten cycles and reduce rework.
- Queue times: up to 12 weeks (2024)
- High supplier leverage in restricted jurisdictions
- Early engagement cuts rework and time-to-market
Supplier concentration: NVIDIA ~80%, Unity+Unreal >70%, raising costs & delays
Light & Wonder faces concentrated hardware and IP suppliers: NVIDIA ~80% discrete GPU share (2024) and licensing royalties typically 10–20%, giving suppliers pricing leverage.
Core engines Unity+Unreal powered >70% of titles (2024), raising switching costs and timeline risk (re-certification adds 3–9 months).
Payments/cloud fees (payments 1.5–3.5%; global cloud spend ~$600B in 2024) and testing queues (~12 weeks) create operational exposure; multi-vendor and selective insourcing mitigate.
| Factor | 2024 Metric |
|---|---|
| GPU share | ~80% NVIDIA |
| Engines | >70% Unity+Unreal |
| Licensing | 10–20% royalties |
| Payments | 1.5–3.5% fees |
| Cloud spend | ~$600B |
| Cert queues | ~12 weeks |
What is included in the product
Detailed Word Document
Concise Porter's Five Forces assessment tailored to Light & Wonder, revealing competitive intensity, buyer and supplier leverage, substitution risks, and barriers to entry to inform strategic positioning and valuation.
Customizable Excel Spreadsheet
A clear one-sheet Porter's Five Forces analysis tailored to Light & Wonder—perfect for quick strategic decisions and investor decks. Editable pressure levels and an instant spider chart let you run scenarios and present insights fast, no macros or complex code required.
Customers Bargaining Power
Consolidated casino and iGaming operators
Consolidated casino and iGaming operators exert strong buyer power: scale lets groups secure volume discounts, custom terms and run RFPs and vendor bake-offs. In the US FanDuel held roughly 40% share of online sports betting in 2024 and the top four operators captured over 80% of online sports betting revenue, enabling demands for performance‑based pricing and SLAs. Deep supplier relationships and exclusive content reduce pure price pressure.
High switching costs vs. multi-sourcing
Integration, staff training, and regulatory re-certification create significant switching costs for operators dealing with Light & Wonder, reinforcing vendor lock-in even as the global gaming market exceeded $500 billion in 2024. Many buyers still dual-source to preserve leverage and mitigate supplier risk, which tempers lock-in and forces continuous innovation and support. Strong account management and data-driven ROI metrics are critical to retain share.
Revenue-share and floor performance scrutiny
Operators closely track coin-in, hold and unit yield to justify rev-share deals, and titles that underperform on those metrics are rapidly rotated off floors or lobbies, enabling buyers to reallocate wallet to top-performing content. This dynamic gives customers leverage in contract terms and placement, but Light & Wonder’s consistent hit rates and real-time analytics strengthen its negotiating position. Operators’ ability to shift spend toward proven hits forces L&W to demonstrate sustained unit yield and engagement.
Digital distribution gatekeepers
Digital distribution gatekeepers (app stores, aggregators, regulated platforms) control access and fees—typical commission tiers range 15–30% (Apple/Google programs). Feature placement and certification windows materially affect conversion and ARPDAU. Buyers can request bespoke features and promotional support. Strong platform relationships and cross-promotions reduce single-platform dependency.
- App stores: 15–30% commission tiers
- Feature placement drives conversion/ARPDAU
- Buyers demand bespoke features/promos
- Platform partnerships cut dependency
Global reach with local requirements
Global operators demand localization, responsible gaming and jurisdictional compliance, shifting bargaining power to buyers as custom roadmaps and integrations raise supplier effort. Meeting local content preferences is now a negotiable commercial term. Modular architecture and reusable components limit cost-to-serve, aiding scale; global online gambling GGR reached about $68 billion in 2024.
- Localization increases buyer leverage
- Custom integrations raise supplier effort
- Modularity controls cost-to-serve
Top-four US sportsbooks control >80% market; leader ~40% enforces performance pricing
Large consolidated operators hold strong leverage—top-four US online sportsbooks >80% share, FanDuel ~40% in 2024—driving performance‑based pricing and placement demands. Switching costs (integration, recertification) reinforce lock‑in, but dual‑sourcing and ROI metrics limit pricing power. App store fees (15–30%) and localization needs shift negotiation to buyers.
| Metric | 2024 |
|---|---|
| Global gaming market | >$500bn |
| Online GGR | $68bn |
| Top4 US share | >80% |
| FanDuel share | ~40% |
| App store fees | 15–30% |
Preview the Actual Deliverable
Light & Wonder Porter's Five Forces Analysis
This preview shows the exact Light & Wonder Porter's Five Forces Analysis you'll receive immediately after purchase—no surprises, no placeholders. The document displayed here is fully formatted, professionally written and ready for download and use the moment you buy. You're looking at the actual deliverable; once payment is complete you’ll get instant access to this identical file.











