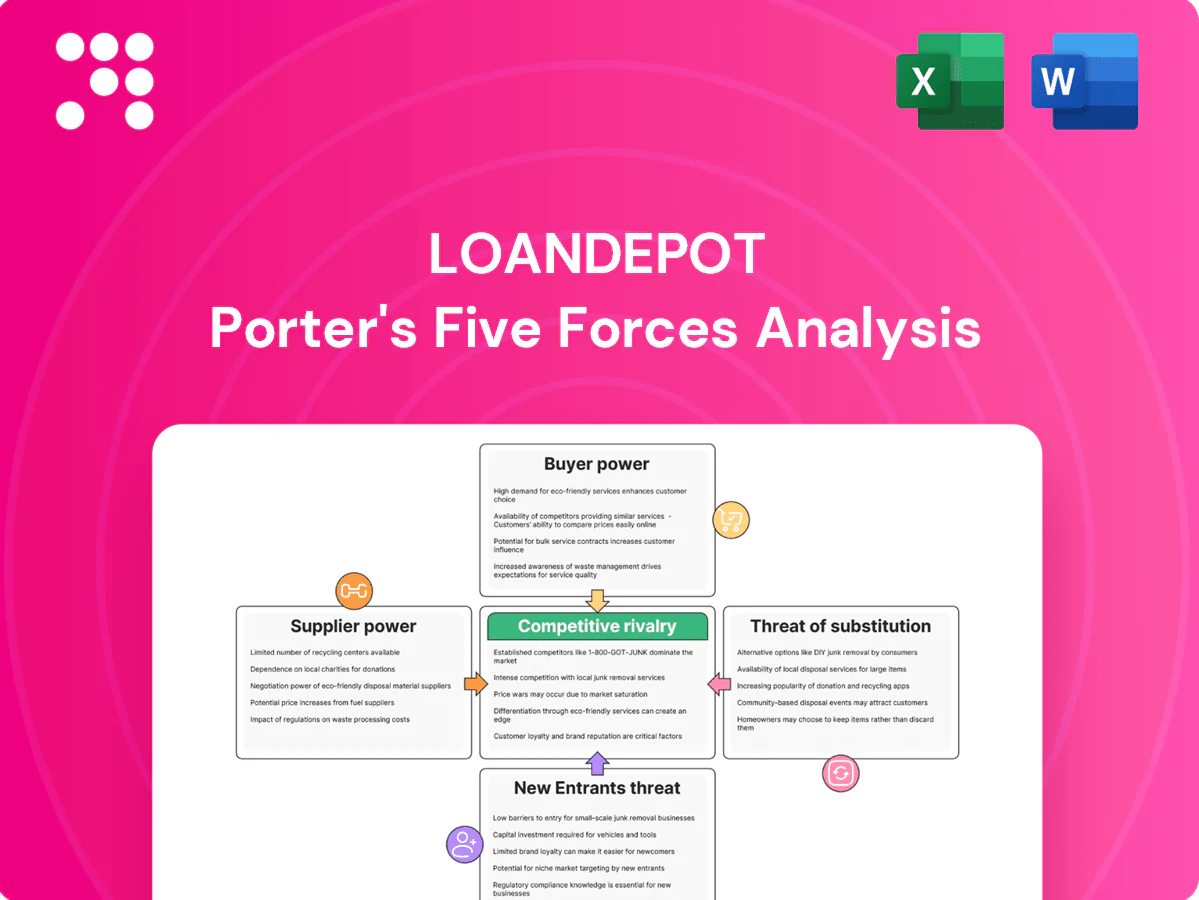
loanDepot Porter's Five Forces Analysis

From Overview to Strategy Blueprint
loanDepot faces strong buyer power, rising digital competitors, regulatory scrutiny, and margin pressure from funding costs—this snapshot highlights the most consequential forces shaping its strategy and profitability. Our brief flags strategic levers and risks but only scratches the surface. Unlock the full Porter's Five Forces Analysis for force-by-force ratings, visuals, and actionable insights to guide investment or strategic decisions.
Suppliers Bargaining Power

Concentration of capital providers
loanDepot depends on warehouse lenders and GSE take-out channels to fund and sell loans, with Fannie Mae and Freddie Mac still buying more than 50% of conforming mortgage volume in 2024. A limited pool of large banks and warehouse facilities can impose tighter covenants and wider spreads. When liquidity tightens, those terms worsen and funding costs rise, increasing supplier power in rate-stressed markets.
Dependence on GSEs and aggregators
LoanDepot’s product eligibility and margins are heavily shaped by Fannie Mae, Freddie Mac and Ginnie Mae eligibility rules and lender overlays; in 2024 Ginnie Mae’s MBS portfolio exceeded $2 trillion, underscoring GSE scale and influence. Aggregators and buyers routinely tweak purchase pricing and stipulations, directly compressing gain-on-sale on originated loans. Rapid changes to LLPAs or buyback policies can swing economics within weeks, giving secondary-market buyers clear leverage over originators.

Critical tech and data vendors
Loan origination systems, pricing engines and verification providers are highly concentrated, with the top three LOS and pricing vendors accounting for over 60% of U.S. digital mortgage originations as of 2024, creating few alternatives for loanDepot. Switching costs are high—migration projects often take months and incur seven- to eight-figure costs—so vendor lock-in is common. Service outages or fee hikes can cut throughput and push unit origination costs materially higher, with industry reports showing single-day outages reducing daily closings by 20–40%. Vendor bargaining power increases with deeper API and data integration into loanDepot’s workflow, raising exposure to price and service changes.

Third-party services: appraisal, title, AMC
Third-party appraisal capacity and turn times fluctuate, with 2024 peak-month appraisal turn times rising to roughly 15 days, increasing pipeline risk; title/settlement providers often bundle services regionally, tightening substitution and enabling 3–5% year-over-year fee pressure; regulatory constraints slow switching, letting service partners push timing and fees.
- Appraisal: peak turn ~15 days (2024)
- Title: regional bundling, limited substitutes
- Fee pressure: ~3–5% YoY (2024)
Lead and referral sources
Digital lead marketplaces, major real estate portals and builder partnerships concentrate high-intent traffic and therefore wield supplier bargaining power over mortgage originators like loanDepot. NAR found 97% of home buyers used the internet in their search (2023) and Google held ~92% search share (StatCounter 2024), so platform algorithm or referral-term changes can sharply reduce volumes. Lead pricing and exclusivity terms can materially raise CAC and compress origination margins.
- Concentration: portals/marketplaces capture majority of intent
- Traffic risk: platform algorithms (Google/portals) can throttle volumes
- Cost impact: pricing/exclusivity directly increases CAC
Concentrated supplier power squeezes mortgage margins: GSEs, LOS vendors, appraisals, portals
loanDepot faces high supplier power: GSEs (Fannie/Freddie) bought >50% of conforming volume in 2024, warehouse lenders are concentrated, and secondary-market pricing quickly compresses gain-on-sale. Core LOS/pricing vendors top-three share >60% (2024), making switching costly; appraisal turn times peaked ~15 days and title fees rose ~3–5% YoY. Portals/Google (~92% search share) concentrate buyer traffic, raising CAC when terms shift.
| Supplier | 2024 metric | Impact |
|---|---|---|
| GSEs | >50% conforming buy | Pricing/eligibility control |
| LOS/pricing vendors | >60% market share | High switching cost |
| Appraisals | ~15 day peak turn | Pipeline risk |
| Title | 3–5% YoY fee rise | Higher unit costs |
| Search/portals | Google ~92% share | Traffic concentration |
What is included in the product
 Detailed Word Document
Concise Porter's Five Forces review tailored to loanDepot, highlighting competitive rivalry, buyer/supplier power, entry threats, substitutes, and strategic implications for market positioning.

 Customizable Excel Spreadsheet
Clear one-sheet Porter’s Five Forces for loanDepot—instantly visualize competitive pressures with a radar chart, customize force levels for new regulations or market shifts, and drop into pitch decks or Excel dashboards without macros.
Customers Bargaining Power

High price transparency
In 2024 rate-comparison sites and daily APR feeds let borrowers shop instantly, shrinking search frictions and elevating price sensitivity. Small basis-point differences now routinely sway decisions in commoditized mortgages, compressing lender margins and forcing concessions on fees and buy-downs. Buyer power spikes in refinance-heavy cycles, amplifying pressure on loanDepot to match visible APRs and lower origination economics.
Low switching costs
Pre-approval portability and standardized TILA-RESPA disclosures make lender switching easier, and e-sign/e-close adoption, which exceeded 50% industry-wide by 2024, lowers frictions further. Borrowers abandon applications mid-funnel at roughly 35%, so service or pricing lapses quickly cost originations. This compels loanDepot to enforce tight SLAs (24–48 hours response) and maintain competitive pricing to retain volume.

Broker and Realtor influence
Referral partners such as brokers and realtors steer borrower choices at point-of-sale, negotiating credits, faster turn times, and special handling that channel business to preferred lenders. NAR reported in 2024 that about 87% of buyers used an agent, underscoring agents’ leverage; loss of a key referral can materially reduce local purchase share. This amplifies effective buyer power versus loanDepot.

Credit profile segmentation
Prime borrowers (FICO ~720+) command the best rates and shop aggressively, pulling pricing down as retail 30-year fixed averages hovered near 7% in 2024 (Freddie Mac weekly range ~6.8–7.3%).
Non-QM and lower-FICO cohorts face fewer lenders, require risk-priced spreads, and a shift toward higher non-prime mix reduces overall leverage; loanDepot must trade margin for higher win rates by segment.
- Prime: high competition, tight spreads
- Non-QM/low-FICO: wider spreads, limited options
- Mix shifts change negotiating power
- Trade-off: margins vs win rates
Demand cyclicality and urgency
Purchase borrowers value contract certainty and speed, reducing price sensitivity, while 2024 refinance upticks—driven by a 30-year fixed rate average near 6.7%—spiked rate-driven churn. Macro rate moves and housing inventory cycles swing buyer leverage sharply. Strong service differentiation (faster closings, digital tools) partially offsets pure price-driven customer power.
- Purchase: lower price sensitivity
- Refi: higher churn, rate-sensitive
- Macro/inventory: swing leverage
- Service: mitigates price power
Buyers wield leverage — cut APRs, speed turns: > 50% e-sign, 35% abandon
Buyers have strong price leverage in 2024 as instant APR comparison and >50% e-sign adoption cut frictions, with ~35% app abandonment raising sensitivity to service and speed. Agents (used by ~87% of buyers) and refinance cycles (30y avg ~6.7%) amplify switching pressure; prime borrowers push rates down while non-QM limits lender options. loanDepot must trade margin for wins via faster turns and competitive APRs.
| Metric | 2024 |
|---|---|
| e-sign/e-close adoption | >50% |
| Agent-guided buyers | ~87% |
| Application abandonment | ~35% |
| 30y fixed avg | ~6.7% |
Preview Before You Purchase
loanDepot Porter's Five Forces Analysis
This preview shows the exact loanDepot Porter's Five Forces Analysis you'll receive immediately after purchase—no surprises or placeholders. The analysis is the complete, professionally formatted document, ready for download and use the moment you buy. It delivers the full strategic assessment of competitive rivalry, buyer and supplier power, threat of substitutes, and barriers to entry.

From Overview to Strategy Blueprint
loanDepot faces strong buyer power, rising digital competitors, regulatory scrutiny, and margin pressure from funding costs—this snapshot highlights the most consequential forces shaping its strategy and profitability. Our brief flags strategic levers and risks but only scratches the surface. Unlock the full Porter's Five Forces Analysis for force-by-force ratings, visuals, and actionable insights to guide investment or strategic decisions.
Suppliers Bargaining Power
Concentration of capital providers
loanDepot depends on warehouse lenders and GSE take-out channels to fund and sell loans, with Fannie Mae and Freddie Mac still buying more than 50% of conforming mortgage volume in 2024. A limited pool of large banks and warehouse facilities can impose tighter covenants and wider spreads. When liquidity tightens, those terms worsen and funding costs rise, increasing supplier power in rate-stressed markets.
Dependence on GSEs and aggregators
LoanDepot’s product eligibility and margins are heavily shaped by Fannie Mae, Freddie Mac and Ginnie Mae eligibility rules and lender overlays; in 2024 Ginnie Mae’s MBS portfolio exceeded $2 trillion, underscoring GSE scale and influence. Aggregators and buyers routinely tweak purchase pricing and stipulations, directly compressing gain-on-sale on originated loans. Rapid changes to LLPAs or buyback policies can swing economics within weeks, giving secondary-market buyers clear leverage over originators.
Critical tech and data vendors
Loan origination systems, pricing engines and verification providers are highly concentrated, with the top three LOS and pricing vendors accounting for over 60% of U.S. digital mortgage originations as of 2024, creating few alternatives for loanDepot. Switching costs are high—migration projects often take months and incur seven- to eight-figure costs—so vendor lock-in is common. Service outages or fee hikes can cut throughput and push unit origination costs materially higher, with industry reports showing single-day outages reducing daily closings by 20–40%. Vendor bargaining power increases with deeper API and data integration into loanDepot’s workflow, raising exposure to price and service changes.
Third-party services: appraisal, title, AMC
Third-party appraisal capacity and turn times fluctuate, with 2024 peak-month appraisal turn times rising to roughly 15 days, increasing pipeline risk; title/settlement providers often bundle services regionally, tightening substitution and enabling 3–5% year-over-year fee pressure; regulatory constraints slow switching, letting service partners push timing and fees.
- Appraisal: peak turn ~15 days (2024)
- Title: regional bundling, limited substitutes
- Fee pressure: ~3–5% YoY (2024)
Lead and referral sources
Digital lead marketplaces, major real estate portals and builder partnerships concentrate high-intent traffic and therefore wield supplier bargaining power over mortgage originators like loanDepot. NAR found 97% of home buyers used the internet in their search (2023) and Google held ~92% search share (StatCounter 2024), so platform algorithm or referral-term changes can sharply reduce volumes. Lead pricing and exclusivity terms can materially raise CAC and compress origination margins.
- Concentration: portals/marketplaces capture majority of intent
- Traffic risk: platform algorithms (Google/portals) can throttle volumes
- Cost impact: pricing/exclusivity directly increases CAC
Concentrated supplier power squeezes mortgage margins: GSEs, LOS vendors, appraisals, portals
loanDepot faces high supplier power: GSEs (Fannie/Freddie) bought >50% of conforming volume in 2024, warehouse lenders are concentrated, and secondary-market pricing quickly compresses gain-on-sale. Core LOS/pricing vendors top-three share >60% (2024), making switching costly; appraisal turn times peaked ~15 days and title fees rose ~3–5% YoY. Portals/Google (~92% search share) concentrate buyer traffic, raising CAC when terms shift.
| Supplier | 2024 metric | Impact |
|---|---|---|
| GSEs | >50% conforming buy | Pricing/eligibility control |
| LOS/pricing vendors | >60% market share | High switching cost |
| Appraisals | ~15 day peak turn | Pipeline risk |
| Title | 3–5% YoY fee rise | Higher unit costs |
| Search/portals | Google ~92% share | Traffic concentration |
What is included in the product
Detailed Word Document
Concise Porter's Five Forces review tailored to loanDepot, highlighting competitive rivalry, buyer/supplier power, entry threats, substitutes, and strategic implications for market positioning.
Customizable Excel Spreadsheet
Clear one-sheet Porter’s Five Forces for loanDepot—instantly visualize competitive pressures with a radar chart, customize force levels for new regulations or market shifts, and drop into pitch decks or Excel dashboards without macros.
Customers Bargaining Power
High price transparency
In 2024 rate-comparison sites and daily APR feeds let borrowers shop instantly, shrinking search frictions and elevating price sensitivity. Small basis-point differences now routinely sway decisions in commoditized mortgages, compressing lender margins and forcing concessions on fees and buy-downs. Buyer power spikes in refinance-heavy cycles, amplifying pressure on loanDepot to match visible APRs and lower origination economics.
Low switching costs
Pre-approval portability and standardized TILA-RESPA disclosures make lender switching easier, and e-sign/e-close adoption, which exceeded 50% industry-wide by 2024, lowers frictions further. Borrowers abandon applications mid-funnel at roughly 35%, so service or pricing lapses quickly cost originations. This compels loanDepot to enforce tight SLAs (24–48 hours response) and maintain competitive pricing to retain volume.
Broker and Realtor influence
Referral partners such as brokers and realtors steer borrower choices at point-of-sale, negotiating credits, faster turn times, and special handling that channel business to preferred lenders. NAR reported in 2024 that about 87% of buyers used an agent, underscoring agents’ leverage; loss of a key referral can materially reduce local purchase share. This amplifies effective buyer power versus loanDepot.
Credit profile segmentation
Prime borrowers (FICO ~720+) command the best rates and shop aggressively, pulling pricing down as retail 30-year fixed averages hovered near 7% in 2024 (Freddie Mac weekly range ~6.8–7.3%).
Non-QM and lower-FICO cohorts face fewer lenders, require risk-priced spreads, and a shift toward higher non-prime mix reduces overall leverage; loanDepot must trade margin for higher win rates by segment.
- Prime: high competition, tight spreads
- Non-QM/low-FICO: wider spreads, limited options
- Mix shifts change negotiating power
- Trade-off: margins vs win rates
Demand cyclicality and urgency
Purchase borrowers value contract certainty and speed, reducing price sensitivity, while 2024 refinance upticks—driven by a 30-year fixed rate average near 6.7%—spiked rate-driven churn. Macro rate moves and housing inventory cycles swing buyer leverage sharply. Strong service differentiation (faster closings, digital tools) partially offsets pure price-driven customer power.
- Purchase: lower price sensitivity
- Refi: higher churn, rate-sensitive
- Macro/inventory: swing leverage
- Service: mitigates price power
Buyers wield leverage — cut APRs, speed turns: > 50% e-sign, 35% abandon
Buyers have strong price leverage in 2024 as instant APR comparison and >50% e-sign adoption cut frictions, with ~35% app abandonment raising sensitivity to service and speed. Agents (used by ~87% of buyers) and refinance cycles (30y avg ~6.7%) amplify switching pressure; prime borrowers push rates down while non-QM limits lender options. loanDepot must trade margin for wins via faster turns and competitive APRs.
| Metric | 2024 |
|---|---|
| e-sign/e-close adoption | >50% |
| Agent-guided buyers | ~87% |
| Application abandonment | ~35% |
| 30y fixed avg | ~6.7% |
Preview Before You Purchase
loanDepot Porter's Five Forces Analysis
This preview shows the exact loanDepot Porter's Five Forces Analysis you'll receive immediately after purchase—no surprises or placeholders. The analysis is the complete, professionally formatted document, ready for download and use the moment you buy. It delivers the full strategic assessment of competitive rivalry, buyer and supplier power, threat of substitutes, and barriers to entry.
Original: $10.00
-65%$10.00
$3.50Description
From Overview to Strategy Blueprint
loanDepot faces strong buyer power, rising digital competitors, regulatory scrutiny, and margin pressure from funding costs—this snapshot highlights the most consequential forces shaping its strategy and profitability. Our brief flags strategic levers and risks but only scratches the surface. Unlock the full Porter's Five Forces Analysis for force-by-force ratings, visuals, and actionable insights to guide investment or strategic decisions.
Suppliers Bargaining Power
Concentration of capital providers
loanDepot depends on warehouse lenders and GSE take-out channels to fund and sell loans, with Fannie Mae and Freddie Mac still buying more than 50% of conforming mortgage volume in 2024. A limited pool of large banks and warehouse facilities can impose tighter covenants and wider spreads. When liquidity tightens, those terms worsen and funding costs rise, increasing supplier power in rate-stressed markets.
Dependence on GSEs and aggregators
LoanDepot’s product eligibility and margins are heavily shaped by Fannie Mae, Freddie Mac and Ginnie Mae eligibility rules and lender overlays; in 2024 Ginnie Mae’s MBS portfolio exceeded $2 trillion, underscoring GSE scale and influence. Aggregators and buyers routinely tweak purchase pricing and stipulations, directly compressing gain-on-sale on originated loans. Rapid changes to LLPAs or buyback policies can swing economics within weeks, giving secondary-market buyers clear leverage over originators.
Critical tech and data vendors
Loan origination systems, pricing engines and verification providers are highly concentrated, with the top three LOS and pricing vendors accounting for over 60% of U.S. digital mortgage originations as of 2024, creating few alternatives for loanDepot. Switching costs are high—migration projects often take months and incur seven- to eight-figure costs—so vendor lock-in is common. Service outages or fee hikes can cut throughput and push unit origination costs materially higher, with industry reports showing single-day outages reducing daily closings by 20–40%. Vendor bargaining power increases with deeper API and data integration into loanDepot’s workflow, raising exposure to price and service changes.
Third-party services: appraisal, title, AMC
Third-party appraisal capacity and turn times fluctuate, with 2024 peak-month appraisal turn times rising to roughly 15 days, increasing pipeline risk; title/settlement providers often bundle services regionally, tightening substitution and enabling 3–5% year-over-year fee pressure; regulatory constraints slow switching, letting service partners push timing and fees.
- Appraisal: peak turn ~15 days (2024)
- Title: regional bundling, limited substitutes
- Fee pressure: ~3–5% YoY (2024)
Lead and referral sources
Digital lead marketplaces, major real estate portals and builder partnerships concentrate high-intent traffic and therefore wield supplier bargaining power over mortgage originators like loanDepot. NAR found 97% of home buyers used the internet in their search (2023) and Google held ~92% search share (StatCounter 2024), so platform algorithm or referral-term changes can sharply reduce volumes. Lead pricing and exclusivity terms can materially raise CAC and compress origination margins.
- Concentration: portals/marketplaces capture majority of intent
- Traffic risk: platform algorithms (Google/portals) can throttle volumes
- Cost impact: pricing/exclusivity directly increases CAC
Concentrated supplier power squeezes mortgage margins: GSEs, LOS vendors, appraisals, portals
loanDepot faces high supplier power: GSEs (Fannie/Freddie) bought >50% of conforming volume in 2024, warehouse lenders are concentrated, and secondary-market pricing quickly compresses gain-on-sale. Core LOS/pricing vendors top-three share >60% (2024), making switching costly; appraisal turn times peaked ~15 days and title fees rose ~3–5% YoY. Portals/Google (~92% search share) concentrate buyer traffic, raising CAC when terms shift.
| Supplier | 2024 metric | Impact |
|---|---|---|
| GSEs | >50% conforming buy | Pricing/eligibility control |
| LOS/pricing vendors | >60% market share | High switching cost |
| Appraisals | ~15 day peak turn | Pipeline risk |
| Title | 3–5% YoY fee rise | Higher unit costs |
| Search/portals | Google ~92% share | Traffic concentration |
What is included in the product
Detailed Word Document
Concise Porter's Five Forces review tailored to loanDepot, highlighting competitive rivalry, buyer/supplier power, entry threats, substitutes, and strategic implications for market positioning.
Customizable Excel Spreadsheet
Clear one-sheet Porter’s Five Forces for loanDepot—instantly visualize competitive pressures with a radar chart, customize force levels for new regulations or market shifts, and drop into pitch decks or Excel dashboards without macros.
Customers Bargaining Power
High price transparency
In 2024 rate-comparison sites and daily APR feeds let borrowers shop instantly, shrinking search frictions and elevating price sensitivity. Small basis-point differences now routinely sway decisions in commoditized mortgages, compressing lender margins and forcing concessions on fees and buy-downs. Buyer power spikes in refinance-heavy cycles, amplifying pressure on loanDepot to match visible APRs and lower origination economics.
Low switching costs
Pre-approval portability and standardized TILA-RESPA disclosures make lender switching easier, and e-sign/e-close adoption, which exceeded 50% industry-wide by 2024, lowers frictions further. Borrowers abandon applications mid-funnel at roughly 35%, so service or pricing lapses quickly cost originations. This compels loanDepot to enforce tight SLAs (24–48 hours response) and maintain competitive pricing to retain volume.
Broker and Realtor influence
Referral partners such as brokers and realtors steer borrower choices at point-of-sale, negotiating credits, faster turn times, and special handling that channel business to preferred lenders. NAR reported in 2024 that about 87% of buyers used an agent, underscoring agents’ leverage; loss of a key referral can materially reduce local purchase share. This amplifies effective buyer power versus loanDepot.
Credit profile segmentation
Prime borrowers (FICO ~720+) command the best rates and shop aggressively, pulling pricing down as retail 30-year fixed averages hovered near 7% in 2024 (Freddie Mac weekly range ~6.8–7.3%).
Non-QM and lower-FICO cohorts face fewer lenders, require risk-priced spreads, and a shift toward higher non-prime mix reduces overall leverage; loanDepot must trade margin for higher win rates by segment.
- Prime: high competition, tight spreads
- Non-QM/low-FICO: wider spreads, limited options
- Mix shifts change negotiating power
- Trade-off: margins vs win rates
Demand cyclicality and urgency
Purchase borrowers value contract certainty and speed, reducing price sensitivity, while 2024 refinance upticks—driven by a 30-year fixed rate average near 6.7%—spiked rate-driven churn. Macro rate moves and housing inventory cycles swing buyer leverage sharply. Strong service differentiation (faster closings, digital tools) partially offsets pure price-driven customer power.
- Purchase: lower price sensitivity
- Refi: higher churn, rate-sensitive
- Macro/inventory: swing leverage
- Service: mitigates price power
Buyers wield leverage — cut APRs, speed turns: > 50% e-sign, 35% abandon
Buyers have strong price leverage in 2024 as instant APR comparison and >50% e-sign adoption cut frictions, with ~35% app abandonment raising sensitivity to service and speed. Agents (used by ~87% of buyers) and refinance cycles (30y avg ~6.7%) amplify switching pressure; prime borrowers push rates down while non-QM limits lender options. loanDepot must trade margin for wins via faster turns and competitive APRs.
| Metric | 2024 |
|---|---|
| e-sign/e-close adoption | >50% |
| Agent-guided buyers | ~87% |
| Application abandonment | ~35% |
| 30y fixed avg | ~6.7% |
Preview Before You Purchase
loanDepot Porter's Five Forces Analysis
This preview shows the exact loanDepot Porter's Five Forces Analysis you'll receive immediately after purchase—no surprises or placeholders. The analysis is the complete, professionally formatted document, ready for download and use the moment you buy. It delivers the full strategic assessment of competitive rivalry, buyer and supplier power, threat of substitutes, and barriers to entry.











