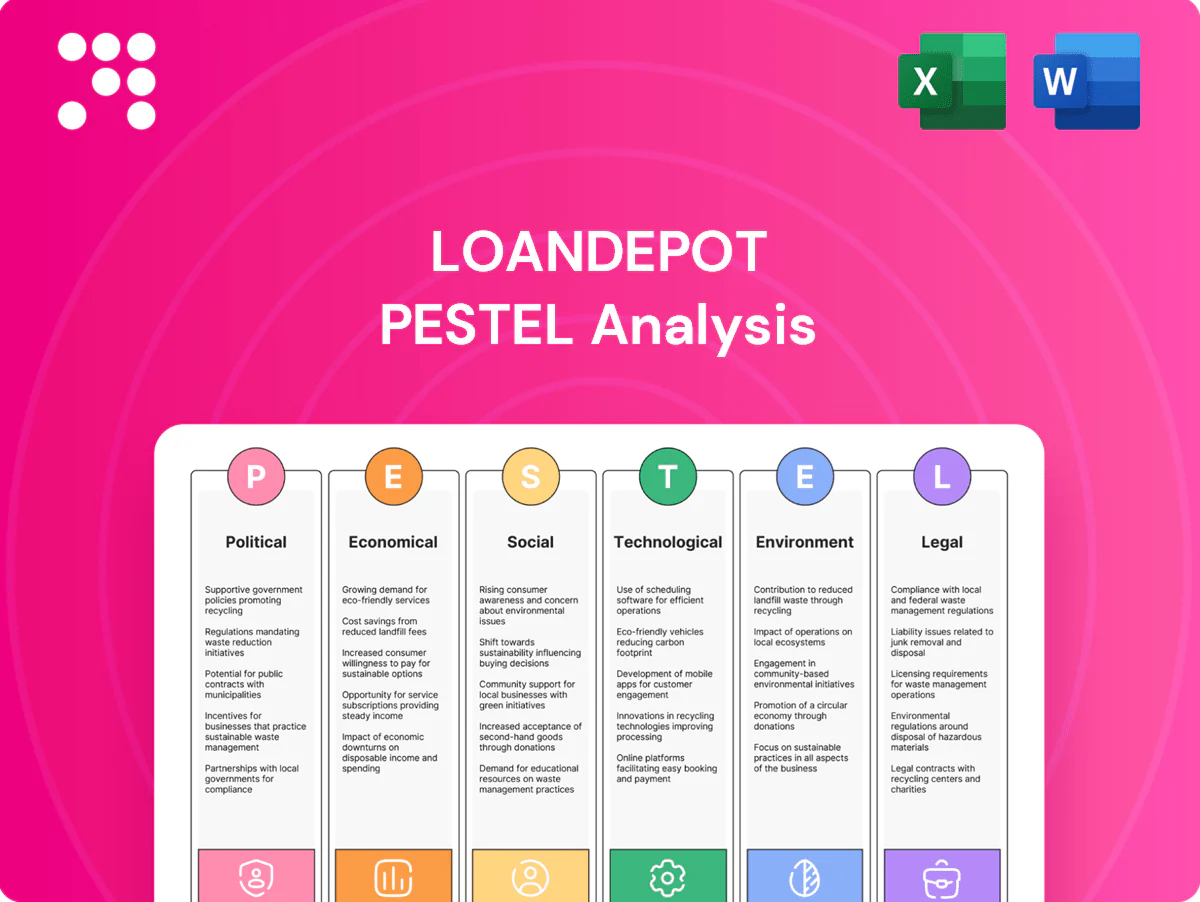
loanDepot PESTLE Analysis

Make Smarter Strategic Decisions with a Complete PESTEL View
Discover how macro forces—from regulatory shifts and housing cycles to fintech innovation—are reshaping loanDepot’s outlook in our concise PESTLE overview. This snapshot highlights key risks and opportunities for investors and strategists. Purchase the full PESTLE to access detailed, actionable intelligence and ready-to-use findings.
Political factors

Housing policy direction
Federal housing priorities shape demand, pricing power, and access to credit; first-time buyers made about 33% of U.S. purchases in 2024 (NAR), and Freddie Mac reported a 30-year fixed average near 6.9% in 2024, tightening margins. Shifts in support for down-payment assistance or GSE reform—still under congressional debate through mid-2025—can quickly alter loanDepot’s origination mix and margin profile. loanDepot must pivot pricing and product mix to policy swings across administrations.
GSE and FHA oversight
FHFA and HUD policies directly shape loanDepot underwriting, fee structures and buyback risk, with FHFA set 2024 conforming loan limits at $766,550 affecting product mix. Changes to LLPA schedules, conforming limits and FHA mortgage insurance rules alter pricing and competitiveness across retail and correspondent channels. Tighter GSE/FHA oversight raises compliance costs but can stabilize secondary-market liquidity by reducing credit uncertainty.

Monetary stance signaling
Political sentiment around inflation and growth pressures amplifies central bank signaling; the Fed funds target near 5.25% (July 2025) and 30-year mortgage rates ~7.0% (Freddie Mac mid-2025) show expectations moving markets ahead of policy. Such rate swings can whipsaw loan pipelines and lock activity. loanDepot requires nimble pricing and dynamic hedging to manage margin and pipeline fallout.

State-level housing initiatives
State legislatures across 50 states and DC shape licensing, consumer-protection rules and housing-supply incentives that directly affect loanDepot’s origination and compliance costs. Non-uniform statutes increase complexity for multi-state operations, raising compliance staffing and system-expense needs. Local zoning reforms, when adopted, can gradually expand loanDepot’s addressable markets by enabling denser multifamily and infill construction.
- State scope: 50 states + DC
- Impact areas: licensing, consumer protection, incentives
- Operational burden: higher compliance staffing/costs
- Growth leverage: zoning reform expands addressable market
Trade and cybersecurity posture
National security and data-sovereignty rules constrain cloud vendors and cross-border data flows, increasing compliance scope for loanDepot and partners; IBM Security 2024 reports the average data breach cost at $4.45 million, illustrating financial risk.
Tighter localization and vendor-due-diligence requirements raise IT and third-party-review costs, and complicate scaling of cloud-native lending platforms.
Clear, stable policy reduces operational risk, improves resilience and boosts customer trust in digital lending.
Policy shifts squeeze margins: 33% first-time buyers, 30y ~7%
Federal and GSE policy shifts (first-time buyers 33% 2024; conforming limit $766,550) directly change originations and margins; 30-year ~7.0% and Fed funds ~5.25% (mid-2025) tighten demand and hedging needs.
State licensing and consumer-protection divergence raises compliance staffing/costs for multi-state scale.
Data-sovereignty/vendor rules increase IT costs; avg breach cost $4.45M (IBM 2024) raises operational risk.
| Factor | Metric | Impact |
|---|---|---|
| Buyer mix | 33% first-time (2024) | Origination mix shift |
| Conforming limit | $766,550 (2024) | Product pricing |
| Rates | 30y ~7.0% / Fed 5.25% (mid-2025) | Demand/hedge volatility |
| Cyber risk | $4.45M breach cost (2024) | IT/vendor spend |
What is included in the product
 Detailed Word Document
Explores how macro-environmental factors uniquely affect loanDepot across Political, Economic, Social, Technological, Environmental, and Legal dimensions, highlighting regulatory shifts, interest-rate sensitivity, digital mortgage disruption, and climate-related lending risks. Every section is data-backed, forward-looking, and tailored to support executives, investors, and strategists in scenario planning and risk/opportunity identification.

 Customizable Excel Spreadsheet
Concise, visually segmented PESTLE summary for loanDepot that clarifies regulatory, economic, and technological risks at a glance, easily dropped into presentations or tailored with notes for regional or product-specific planning.
Economic factors

Interest rate volatility
Interest rate volatility drives refi booms and busts—MBA refinance share fell from roughly 70% in 2020 to about 10% by 2023–24, forcing originations and capacity swings at loanDepot. Higher rates have shifted mix toward purchase and HELOCs, compressing net interest margins as 30-year mortgage rates averaged near 7% in 2023 and eased to ~6.5% in H1 2025. Active hedging and dynamic capacity management are critical to stabilise earnings and liquidity.
Housing supply-demand
Low inventory — sub-3 months' supply through early 2025 — sustains prices and constrains purchase originations; tight supply kept median prices near record levels in 2024–25. New construction and seller activity (permits/starts volatility in 2024) directly affect lead flow. loanDepot must prioritize markets with higher turnover and formal builder partnerships to restore purchase volume and diversify lead sources.

Labor and wage trends
Strong income growth and average hourly earnings up about 4.0% year‑over‑year (BLS, mid‑2025) support home affordability and loan qualification for loanDepot. Conversely, wage stagnation or layoffs push delinquencies higher and prompt lenders to tighten credit boxes. Regional unemployment remains uneven—national jobless ~3.7%—so employment dispersion guides branch placement and targeted marketing.

Credit cycle and risk appetite
Lender overlays expand and contract with macro uncertainty; with the Fed funds target at 5.25–5.50% (2024–mid‑2025) and 30‑yr fixed mortgage rates near 7% in 2024, loss expectations are higher, pushing tighter pricing, narrower buyboxes and more conservative secondary execution. Prudent risk management at loanDepot must balance originations growth against repurchase and default exposure to limit capital strain.
- Fed funds 5.25–5.50% (2024–mid‑2025)
- 30‑yr mortgage ~7% (2024)
- Tighter overlays → narrower buybox
- Focus on repurchase/default risk control
Capital markets liquidity
Capital markets liquidity shapes loanDepot execution: TBA market depth and RMBS investor appetite determine hedge costs and lock strategies, with TBA daily notional often exceeding $50 billion in active periods (2024–25), compressing execution windows. Wider MBS spreads directly lift borrower rates and lower pull-through; conversely, strong investor demand improves gain-on-sale margins and widens product breadth.
- Market depth: TBA notional >$50bn/day (2024–25)
- Wider spreads → higher borrower rates, lower pull-through
- Strong demand → better gain-on-sale, more products
Policy shifts squeeze margins: 33% first-time buyers, 30y ~7%
Interest rate volatility drove refinance share from ~70% (2020) to ~10% (2023–24), shifting mix to purchase/HELOCs and compressing margins; 30yr ~7% (2024) eased to ~6.5% H1 2025. Fed funds 5.25–5.50% and national unemployment ~3.7% (mid‑2025) shape credit and demand. Capital markets (TBA >$50bn/day) affect spreads, pull‑through and GOS; overlays tighten with macro risk.
| Metric | Value |
|---|---|
| Fed funds | 5.25–5.50% |
| 30yr | ~7% (2024), ~6.5% H1 2025 |
| Unemployment | ~3.7% |
| TBA daily | >$50bn |
Full Version Awaits
loanDepot PESTLE Analysis
This preview of the loanDepot PESTLE Analysis is the exact document you’ll receive after purchase—fully formatted and ready to use. It contains the complete political, economic, social, technological, legal, and environmental assessment with charts, citations, and actionable insights. No placeholders or teasers—what you see is the final, downloadable file.

Make Smarter Strategic Decisions with a Complete PESTEL View
Discover how macro forces—from regulatory shifts and housing cycles to fintech innovation—are reshaping loanDepot’s outlook in our concise PESTLE overview. This snapshot highlights key risks and opportunities for investors and strategists. Purchase the full PESTLE to access detailed, actionable intelligence and ready-to-use findings.
Political factors
Housing policy direction
Federal housing priorities shape demand, pricing power, and access to credit; first-time buyers made about 33% of U.S. purchases in 2024 (NAR), and Freddie Mac reported a 30-year fixed average near 6.9% in 2024, tightening margins. Shifts in support for down-payment assistance or GSE reform—still under congressional debate through mid-2025—can quickly alter loanDepot’s origination mix and margin profile. loanDepot must pivot pricing and product mix to policy swings across administrations.
GSE and FHA oversight
FHFA and HUD policies directly shape loanDepot underwriting, fee structures and buyback risk, with FHFA set 2024 conforming loan limits at $766,550 affecting product mix. Changes to LLPA schedules, conforming limits and FHA mortgage insurance rules alter pricing and competitiveness across retail and correspondent channels. Tighter GSE/FHA oversight raises compliance costs but can stabilize secondary-market liquidity by reducing credit uncertainty.
Monetary stance signaling
Political sentiment around inflation and growth pressures amplifies central bank signaling; the Fed funds target near 5.25% (July 2025) and 30-year mortgage rates ~7.0% (Freddie Mac mid-2025) show expectations moving markets ahead of policy. Such rate swings can whipsaw loan pipelines and lock activity. loanDepot requires nimble pricing and dynamic hedging to manage margin and pipeline fallout.
State-level housing initiatives
State legislatures across 50 states and DC shape licensing, consumer-protection rules and housing-supply incentives that directly affect loanDepot’s origination and compliance costs. Non-uniform statutes increase complexity for multi-state operations, raising compliance staffing and system-expense needs. Local zoning reforms, when adopted, can gradually expand loanDepot’s addressable markets by enabling denser multifamily and infill construction.
- State scope: 50 states + DC
- Impact areas: licensing, consumer protection, incentives
- Operational burden: higher compliance staffing/costs
- Growth leverage: zoning reform expands addressable market
Trade and cybersecurity posture
National security and data-sovereignty rules constrain cloud vendors and cross-border data flows, increasing compliance scope for loanDepot and partners; IBM Security 2024 reports the average data breach cost at $4.45 million, illustrating financial risk.
Tighter localization and vendor-due-diligence requirements raise IT and third-party-review costs, and complicate scaling of cloud-native lending platforms.
Clear, stable policy reduces operational risk, improves resilience and boosts customer trust in digital lending.
Policy shifts squeeze margins: 33% first-time buyers, 30y ~7%
Federal and GSE policy shifts (first-time buyers 33% 2024; conforming limit $766,550) directly change originations and margins; 30-year ~7.0% and Fed funds ~5.25% (mid-2025) tighten demand and hedging needs.
State licensing and consumer-protection divergence raises compliance staffing/costs for multi-state scale.
Data-sovereignty/vendor rules increase IT costs; avg breach cost $4.45M (IBM 2024) raises operational risk.
| Factor | Metric | Impact |
|---|---|---|
| Buyer mix | 33% first-time (2024) | Origination mix shift |
| Conforming limit | $766,550 (2024) | Product pricing |
| Rates | 30y ~7.0% / Fed 5.25% (mid-2025) | Demand/hedge volatility |
| Cyber risk | $4.45M breach cost (2024) | IT/vendor spend |
What is included in the product
Detailed Word Document
Explores how macro-environmental factors uniquely affect loanDepot across Political, Economic, Social, Technological, Environmental, and Legal dimensions, highlighting regulatory shifts, interest-rate sensitivity, digital mortgage disruption, and climate-related lending risks. Every section is data-backed, forward-looking, and tailored to support executives, investors, and strategists in scenario planning and risk/opportunity identification.
Customizable Excel Spreadsheet
Concise, visually segmented PESTLE summary for loanDepot that clarifies regulatory, economic, and technological risks at a glance, easily dropped into presentations or tailored with notes for regional or product-specific planning.
Economic factors
Interest rate volatility
Interest rate volatility drives refi booms and busts—MBA refinance share fell from roughly 70% in 2020 to about 10% by 2023–24, forcing originations and capacity swings at loanDepot. Higher rates have shifted mix toward purchase and HELOCs, compressing net interest margins as 30-year mortgage rates averaged near 7% in 2023 and eased to ~6.5% in H1 2025. Active hedging and dynamic capacity management are critical to stabilise earnings and liquidity.
Housing supply-demand
Low inventory — sub-3 months' supply through early 2025 — sustains prices and constrains purchase originations; tight supply kept median prices near record levels in 2024–25. New construction and seller activity (permits/starts volatility in 2024) directly affect lead flow. loanDepot must prioritize markets with higher turnover and formal builder partnerships to restore purchase volume and diversify lead sources.
Labor and wage trends
Strong income growth and average hourly earnings up about 4.0% year‑over‑year (BLS, mid‑2025) support home affordability and loan qualification for loanDepot. Conversely, wage stagnation or layoffs push delinquencies higher and prompt lenders to tighten credit boxes. Regional unemployment remains uneven—national jobless ~3.7%—so employment dispersion guides branch placement and targeted marketing.
Credit cycle and risk appetite
Lender overlays expand and contract with macro uncertainty; with the Fed funds target at 5.25–5.50% (2024–mid‑2025) and 30‑yr fixed mortgage rates near 7% in 2024, loss expectations are higher, pushing tighter pricing, narrower buyboxes and more conservative secondary execution. Prudent risk management at loanDepot must balance originations growth against repurchase and default exposure to limit capital strain.
- Fed funds 5.25–5.50% (2024–mid‑2025)
- 30‑yr mortgage ~7% (2024)
- Tighter overlays → narrower buybox
- Focus on repurchase/default risk control
Capital markets liquidity
Capital markets liquidity shapes loanDepot execution: TBA market depth and RMBS investor appetite determine hedge costs and lock strategies, with TBA daily notional often exceeding $50 billion in active periods (2024–25), compressing execution windows. Wider MBS spreads directly lift borrower rates and lower pull-through; conversely, strong investor demand improves gain-on-sale margins and widens product breadth.
- Market depth: TBA notional >$50bn/day (2024–25)
- Wider spreads → higher borrower rates, lower pull-through
- Strong demand → better gain-on-sale, more products
Policy shifts squeeze margins: 33% first-time buyers, 30y ~7%
Interest rate volatility drove refinance share from ~70% (2020) to ~10% (2023–24), shifting mix to purchase/HELOCs and compressing margins; 30yr ~7% (2024) eased to ~6.5% H1 2025. Fed funds 5.25–5.50% and national unemployment ~3.7% (mid‑2025) shape credit and demand. Capital markets (TBA >$50bn/day) affect spreads, pull‑through and GOS; overlays tighten with macro risk.
| Metric | Value |
|---|---|
| Fed funds | 5.25–5.50% |
| 30yr | ~7% (2024), ~6.5% H1 2025 |
| Unemployment | ~3.7% |
| TBA daily | >$50bn |
Full Version Awaits
loanDepot PESTLE Analysis
This preview of the loanDepot PESTLE Analysis is the exact document you’ll receive after purchase—fully formatted and ready to use. It contains the complete political, economic, social, technological, legal, and environmental assessment with charts, citations, and actionable insights. No placeholders or teasers—what you see is the final, downloadable file.
Description
Make Smarter Strategic Decisions with a Complete PESTEL View
Discover how macro forces—from regulatory shifts and housing cycles to fintech innovation—are reshaping loanDepot’s outlook in our concise PESTLE overview. This snapshot highlights key risks and opportunities for investors and strategists. Purchase the full PESTLE to access detailed, actionable intelligence and ready-to-use findings.
Political factors
Housing policy direction
Federal housing priorities shape demand, pricing power, and access to credit; first-time buyers made about 33% of U.S. purchases in 2024 (NAR), and Freddie Mac reported a 30-year fixed average near 6.9% in 2024, tightening margins. Shifts in support for down-payment assistance or GSE reform—still under congressional debate through mid-2025—can quickly alter loanDepot’s origination mix and margin profile. loanDepot must pivot pricing and product mix to policy swings across administrations.
GSE and FHA oversight
FHFA and HUD policies directly shape loanDepot underwriting, fee structures and buyback risk, with FHFA set 2024 conforming loan limits at $766,550 affecting product mix. Changes to LLPA schedules, conforming limits and FHA mortgage insurance rules alter pricing and competitiveness across retail and correspondent channels. Tighter GSE/FHA oversight raises compliance costs but can stabilize secondary-market liquidity by reducing credit uncertainty.
Monetary stance signaling
Political sentiment around inflation and growth pressures amplifies central bank signaling; the Fed funds target near 5.25% (July 2025) and 30-year mortgage rates ~7.0% (Freddie Mac mid-2025) show expectations moving markets ahead of policy. Such rate swings can whipsaw loan pipelines and lock activity. loanDepot requires nimble pricing and dynamic hedging to manage margin and pipeline fallout.
State-level housing initiatives
State legislatures across 50 states and DC shape licensing, consumer-protection rules and housing-supply incentives that directly affect loanDepot’s origination and compliance costs. Non-uniform statutes increase complexity for multi-state operations, raising compliance staffing and system-expense needs. Local zoning reforms, when adopted, can gradually expand loanDepot’s addressable markets by enabling denser multifamily and infill construction.
- State scope: 50 states + DC
- Impact areas: licensing, consumer protection, incentives
- Operational burden: higher compliance staffing/costs
- Growth leverage: zoning reform expands addressable market
Trade and cybersecurity posture
National security and data-sovereignty rules constrain cloud vendors and cross-border data flows, increasing compliance scope for loanDepot and partners; IBM Security 2024 reports the average data breach cost at $4.45 million, illustrating financial risk.
Tighter localization and vendor-due-diligence requirements raise IT and third-party-review costs, and complicate scaling of cloud-native lending platforms.
Clear, stable policy reduces operational risk, improves resilience and boosts customer trust in digital lending.
Policy shifts squeeze margins: 33% first-time buyers, 30y ~7%
Federal and GSE policy shifts (first-time buyers 33% 2024; conforming limit $766,550) directly change originations and margins; 30-year ~7.0% and Fed funds ~5.25% (mid-2025) tighten demand and hedging needs.
State licensing and consumer-protection divergence raises compliance staffing/costs for multi-state scale.
Data-sovereignty/vendor rules increase IT costs; avg breach cost $4.45M (IBM 2024) raises operational risk.
| Factor | Metric | Impact |
|---|---|---|
| Buyer mix | 33% first-time (2024) | Origination mix shift |
| Conforming limit | $766,550 (2024) | Product pricing |
| Rates | 30y ~7.0% / Fed 5.25% (mid-2025) | Demand/hedge volatility |
| Cyber risk | $4.45M breach cost (2024) | IT/vendor spend |
What is included in the product
Detailed Word Document
Explores how macro-environmental factors uniquely affect loanDepot across Political, Economic, Social, Technological, Environmental, and Legal dimensions, highlighting regulatory shifts, interest-rate sensitivity, digital mortgage disruption, and climate-related lending risks. Every section is data-backed, forward-looking, and tailored to support executives, investors, and strategists in scenario planning and risk/opportunity identification.
Customizable Excel Spreadsheet
Concise, visually segmented PESTLE summary for loanDepot that clarifies regulatory, economic, and technological risks at a glance, easily dropped into presentations or tailored with notes for regional or product-specific planning.
Economic factors
Interest rate volatility
Interest rate volatility drives refi booms and busts—MBA refinance share fell from roughly 70% in 2020 to about 10% by 2023–24, forcing originations and capacity swings at loanDepot. Higher rates have shifted mix toward purchase and HELOCs, compressing net interest margins as 30-year mortgage rates averaged near 7% in 2023 and eased to ~6.5% in H1 2025. Active hedging and dynamic capacity management are critical to stabilise earnings and liquidity.
Housing supply-demand
Low inventory — sub-3 months' supply through early 2025 — sustains prices and constrains purchase originations; tight supply kept median prices near record levels in 2024–25. New construction and seller activity (permits/starts volatility in 2024) directly affect lead flow. loanDepot must prioritize markets with higher turnover and formal builder partnerships to restore purchase volume and diversify lead sources.
Labor and wage trends
Strong income growth and average hourly earnings up about 4.0% year‑over‑year (BLS, mid‑2025) support home affordability and loan qualification for loanDepot. Conversely, wage stagnation or layoffs push delinquencies higher and prompt lenders to tighten credit boxes. Regional unemployment remains uneven—national jobless ~3.7%—so employment dispersion guides branch placement and targeted marketing.
Credit cycle and risk appetite
Lender overlays expand and contract with macro uncertainty; with the Fed funds target at 5.25–5.50% (2024–mid‑2025) and 30‑yr fixed mortgage rates near 7% in 2024, loss expectations are higher, pushing tighter pricing, narrower buyboxes and more conservative secondary execution. Prudent risk management at loanDepot must balance originations growth against repurchase and default exposure to limit capital strain.
- Fed funds 5.25–5.50% (2024–mid‑2025)
- 30‑yr mortgage ~7% (2024)
- Tighter overlays → narrower buybox
- Focus on repurchase/default risk control
Capital markets liquidity
Capital markets liquidity shapes loanDepot execution: TBA market depth and RMBS investor appetite determine hedge costs and lock strategies, with TBA daily notional often exceeding $50 billion in active periods (2024–25), compressing execution windows. Wider MBS spreads directly lift borrower rates and lower pull-through; conversely, strong investor demand improves gain-on-sale margins and widens product breadth.
- Market depth: TBA notional >$50bn/day (2024–25)
- Wider spreads → higher borrower rates, lower pull-through
- Strong demand → better gain-on-sale, more products
Policy shifts squeeze margins: 33% first-time buyers, 30y ~7%
Interest rate volatility drove refinance share from ~70% (2020) to ~10% (2023–24), shifting mix to purchase/HELOCs and compressing margins; 30yr ~7% (2024) eased to ~6.5% H1 2025. Fed funds 5.25–5.50% and national unemployment ~3.7% (mid‑2025) shape credit and demand. Capital markets (TBA >$50bn/day) affect spreads, pull‑through and GOS; overlays tighten with macro risk.
| Metric | Value |
|---|---|
| Fed funds | 5.25–5.50% |
| 30yr | ~7% (2024), ~6.5% H1 2025 |
| Unemployment | ~3.7% |
| TBA daily | >$50bn |
Full Version Awaits
loanDepot PESTLE Analysis
This preview of the loanDepot PESTLE Analysis is the exact document you’ll receive after purchase—fully formatted and ready to use. It contains the complete political, economic, social, technological, legal, and environmental assessment with charts, citations, and actionable insights. No placeholders or teasers—what you see is the final, downloadable file.











