Logan Property Holdings Porter's Five Forces Analysis

Don't Miss the Bigger Picture
Logan Property Holdings faces moderate buyer power, rising supplier consolidation, and intense local competition that together shape margins and growth prospects. Our Porter's Five Forces snapshot flags threats from new entrants, substitutes, and regulatory shifts that could alter strategic positioning. This brief only scratches the surface—unlock the full Porter's Five Forces Analysis for force-by-force ratings, visuals, and actionable recommendations.
Suppliers Bargaining Power

Land access concentration
Urban land in the Greater Bay Area is allocated exclusively via local-government auctions, concentrating supply power and driving up reserve prices and conditional clauses in core cities; this forces Logan to match government timetables to replenish land banks and align with policy direction. Long-term cooperation agreements and urban-renewal pipelines mitigate some supplier leverage by securing phased land supply and joint-development rights.
Materials price volatility
Materials price volatility in 2024 elevated supplier power for Logan Property Holdings as steel, cement, glass and fittings—while fragmented—experienced commodity cycles with steel price swings of about 20%, compressing margins on fixed-price pre-sale projects.

Contractor and labor dependence
GCs, MEP firms and specialty contractors materially shape timelines and finish quality, with an AGC 2024 survey showing 79% of firms reporting difficulty finding qualified workers, tightening bargaining power. Safety compliance and tight labor markets have driven subcontractor rate increases of roughly 3–5% in 2024, strengthening supplier leverage. Logan’s multi-vendor rosters, performance-linked contracts and in-house PMO oversight mitigate slippage and rebalance negotiation power.

Financing and capital providers
Banks, trust companies and bondholders shape Logan Property Holdings cost of capital and covenant terms; sector deleveraging since 2021 has made lenders more selective, tightening financing availability. Strong presales and efficient cash collection enhance Logan’s negotiating leverage, while diversified onshore/offshore funding and multiple channels moderate supplier power.
- Financing concentration risk
- Presales improve terms
- Diversified funding lowers pressure
Design and tech vendors
Design and tech vendors (architects, BIM, smart-building providers) add differentiation for Logan but are largely replaceable; signature firms can command premiums on flagship projects. Competitive RFPs and Logan’s internal design standards (expanded in 2024) keep supplier pricing disciplined, limiting supplier leverage even as smart-building uptake rises—global smart-building market ~USD 92bn in 2024.
- Replaceability: high
- Premiums: signature firms win flagship bids
- Pricing: maintained by RFPs
- Risk mitigation: internal design standards
Urban auctions and 2024 materials volatility squeeze developer leverage amid selective financing
Urban land auctions concentrate supplier power, forcing Logan to follow government timetables and rely on long-term cooperation to secure sites. Materials volatility in 2024 raised supplier leverage—steel swung ~20%—while subcontractor rates rose ~3–5% amid tight labor. Financing remains selective post-2021; strong presales and diversified funding partly restore negotiation leverage.
| Factor | 2024 Data |
|---|---|
| Steel price swings | ~20% |
| Subcontractor rate increases | ~3–5% |
| Smart-building market | ~USD 92bn |
What is included in the product
 Detailed Word Document
Uncovers key drivers of competition, buyer and supplier power, entry threats and substitutes specific to Logan Property Holdings, highlighting strategic vulnerabilities and defensive advantages within China's property market.

 Customizable Excel Spreadsheet
A concise Porter's Five Forces one-sheet for Logan Property Holdings that visualizes competitive pressure with a spider chart, lets you tweak force levels for new data, and drops straight into pitch decks.
Customers Bargaining Power

Price-sensitive first-time buyers
Price-sensitive first-time buyers in the GBA are highly mortgage-dependent, often using LTVs up to 90% for entry purchases, and they compare per-sqm prices and discounts across districts to the nearest CNY/HKD figure. Promotional campaigns, short-term price cuts and 2–5 year installment plans materially sway purchase timing. Developers must trade off deeper discounts to capture volume against protecting margins and presales cashflow.
Upgraders demand quality
Move-up buyers prioritize layout, amenities, schools and community services and at Logan Property this cohort drove 45% of 2024 contracted sales, pushing demand for upgraded specifications. They routinely negotiate extras and after-sales commitments, increasing warranty and service costs by an estimated 3–5% of unit price. Strong brand reputation and consistent delivered quality in 2024 supported higher willingness to pay, while value-added property management reduced churn and price haggling by improving renewal rates.

High transparency and comparison
Online listings, forums and live-stream sales have driven market transparency for Logan Property, with buyers benchmarking launches in real time and shrinking willingness to accept premiums. Recent industry trends in 2024 show over 70% of mainland Chinese homebuyers consult online listings before purchase, compressing pricing power without clear differentiation. Data-driven pricing and micro-segmentation enable Logan to align prices with local demand pockets and preserve margins.

Financing availability impact
- Mortgage rate: 5-year LPR 3.65% (2024)
- Typical mortgage ~4.2% (2024)
- Flexible payments raise conversion
- Bank partnerships cut approval risk
Switching and refund policies
- Pre-sale share ~75% (2024)
- Refund/change policies increase conversions
- Timely handover & defect fixes reduce complaints
- Strong CRM lowers cancellation rates
Buyers hold pricing power as online transparency and low mortgages compress premiums
Buyers wield strong bargaining power: price-sensitive first-timers compare per-sqm deals and respond to promos; move-up buyers (45% of contracted sales in 2024) demand upgrades and after‑sales concessions; online transparency (>70% consult listings) compresses premiums; mortgage conditions (5yr LPR 3.65%, typical mortgage ~4.2%) shape affordability.
| Metric | 2024 |
|---|---|
| Move-up share | 45% |
| Pre-sale share | 75% |
| 5yr LPR | 3.65% |
| Typical mortgage | ~4.2% |
| Online consult | >70% |
Preview Before You Purchase
Logan Property Holdings Porter's Five Forces Analysis
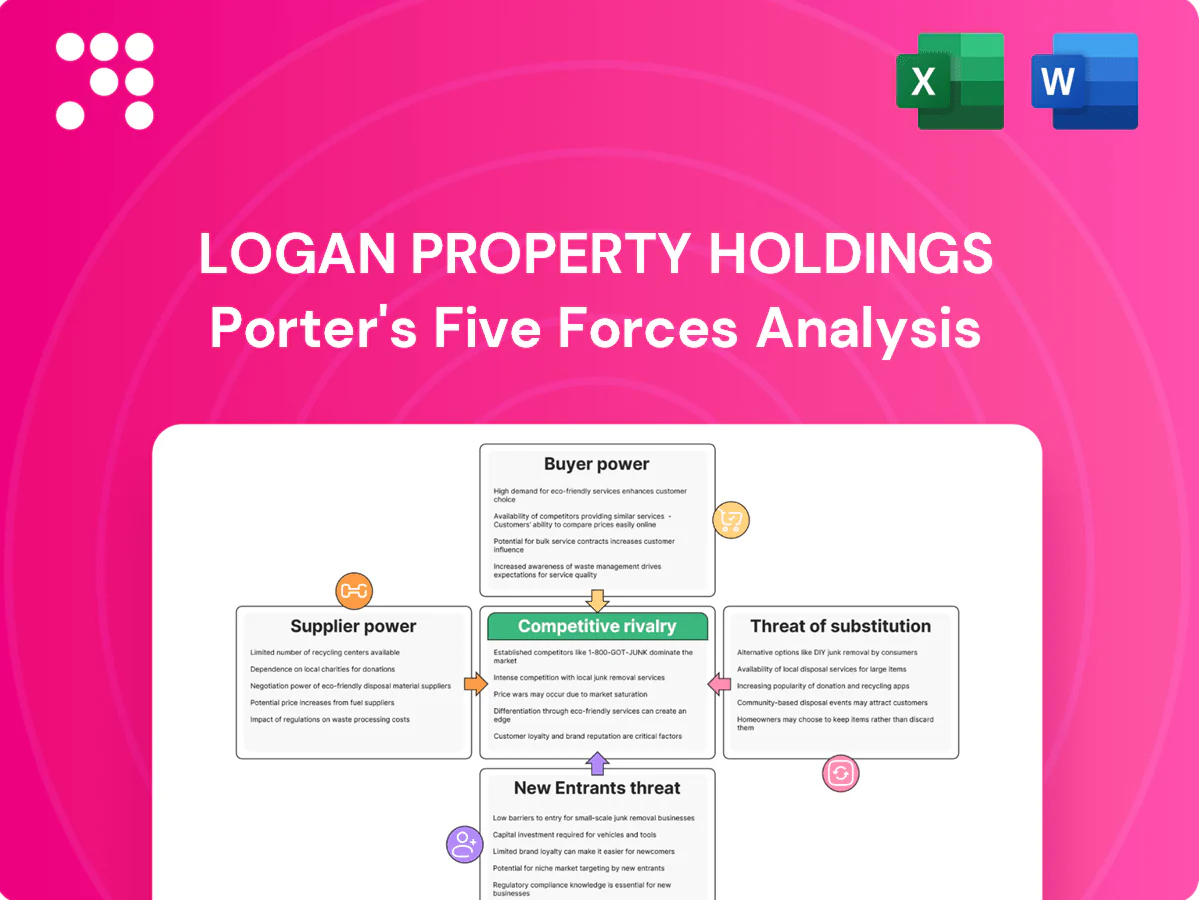
This Logan Property Holdings Porter's Five Forces Analysis preview is the exact, fully formatted document you will receive immediately after purchase. It contains the complete competitive assessment—threat of new entrants, bargaining power of suppliers and buyers, threat of substitutes, and industry rivalry—ready for download and use. No placeholders, no mockups: the file shown is your final deliverable.

Don't Miss the Bigger Picture
Logan Property Holdings faces moderate buyer power, rising supplier consolidation, and intense local competition that together shape margins and growth prospects. Our Porter's Five Forces snapshot flags threats from new entrants, substitutes, and regulatory shifts that could alter strategic positioning. This brief only scratches the surface—unlock the full Porter's Five Forces Analysis for force-by-force ratings, visuals, and actionable recommendations.
Suppliers Bargaining Power
Land access concentration
Urban land in the Greater Bay Area is allocated exclusively via local-government auctions, concentrating supply power and driving up reserve prices and conditional clauses in core cities; this forces Logan to match government timetables to replenish land banks and align with policy direction. Long-term cooperation agreements and urban-renewal pipelines mitigate some supplier leverage by securing phased land supply and joint-development rights.
Materials price volatility
Materials price volatility in 2024 elevated supplier power for Logan Property Holdings as steel, cement, glass and fittings—while fragmented—experienced commodity cycles with steel price swings of about 20%, compressing margins on fixed-price pre-sale projects.
Contractor and labor dependence
GCs, MEP firms and specialty contractors materially shape timelines and finish quality, with an AGC 2024 survey showing 79% of firms reporting difficulty finding qualified workers, tightening bargaining power. Safety compliance and tight labor markets have driven subcontractor rate increases of roughly 3–5% in 2024, strengthening supplier leverage. Logan’s multi-vendor rosters, performance-linked contracts and in-house PMO oversight mitigate slippage and rebalance negotiation power.
Financing and capital providers
Banks, trust companies and bondholders shape Logan Property Holdings cost of capital and covenant terms; sector deleveraging since 2021 has made lenders more selective, tightening financing availability. Strong presales and efficient cash collection enhance Logan’s negotiating leverage, while diversified onshore/offshore funding and multiple channels moderate supplier power.
- Financing concentration risk
- Presales improve terms
- Diversified funding lowers pressure
Design and tech vendors
Design and tech vendors (architects, BIM, smart-building providers) add differentiation for Logan but are largely replaceable; signature firms can command premiums on flagship projects. Competitive RFPs and Logan’s internal design standards (expanded in 2024) keep supplier pricing disciplined, limiting supplier leverage even as smart-building uptake rises—global smart-building market ~USD 92bn in 2024.
- Replaceability: high
- Premiums: signature firms win flagship bids
- Pricing: maintained by RFPs
- Risk mitigation: internal design standards
Urban auctions and 2024 materials volatility squeeze developer leverage amid selective financing
Urban land auctions concentrate supplier power, forcing Logan to follow government timetables and rely on long-term cooperation to secure sites. Materials volatility in 2024 raised supplier leverage—steel swung ~20%—while subcontractor rates rose ~3–5% amid tight labor. Financing remains selective post-2021; strong presales and diversified funding partly restore negotiation leverage.
| Factor | 2024 Data |
|---|---|
| Steel price swings | ~20% |
| Subcontractor rate increases | ~3–5% |
| Smart-building market | ~USD 92bn |
What is included in the product
Detailed Word Document
Uncovers key drivers of competition, buyer and supplier power, entry threats and substitutes specific to Logan Property Holdings, highlighting strategic vulnerabilities and defensive advantages within China's property market.
Customizable Excel Spreadsheet
A concise Porter's Five Forces one-sheet for Logan Property Holdings that visualizes competitive pressure with a spider chart, lets you tweak force levels for new data, and drops straight into pitch decks.
Customers Bargaining Power
Price-sensitive first-time buyers
Price-sensitive first-time buyers in the GBA are highly mortgage-dependent, often using LTVs up to 90% for entry purchases, and they compare per-sqm prices and discounts across districts to the nearest CNY/HKD figure. Promotional campaigns, short-term price cuts and 2–5 year installment plans materially sway purchase timing. Developers must trade off deeper discounts to capture volume against protecting margins and presales cashflow.
Upgraders demand quality
Move-up buyers prioritize layout, amenities, schools and community services and at Logan Property this cohort drove 45% of 2024 contracted sales, pushing demand for upgraded specifications. They routinely negotiate extras and after-sales commitments, increasing warranty and service costs by an estimated 3–5% of unit price. Strong brand reputation and consistent delivered quality in 2024 supported higher willingness to pay, while value-added property management reduced churn and price haggling by improving renewal rates.
High transparency and comparison
Online listings, forums and live-stream sales have driven market transparency for Logan Property, with buyers benchmarking launches in real time and shrinking willingness to accept premiums. Recent industry trends in 2024 show over 70% of mainland Chinese homebuyers consult online listings before purchase, compressing pricing power without clear differentiation. Data-driven pricing and micro-segmentation enable Logan to align prices with local demand pockets and preserve margins.
Financing availability impact
- Mortgage rate: 5-year LPR 3.65% (2024)
- Typical mortgage ~4.2% (2024)
- Flexible payments raise conversion
- Bank partnerships cut approval risk
Switching and refund policies
- Pre-sale share ~75% (2024)
- Refund/change policies increase conversions
- Timely handover & defect fixes reduce complaints
- Strong CRM lowers cancellation rates
Buyers hold pricing power as online transparency and low mortgages compress premiums
Buyers wield strong bargaining power: price-sensitive first-timers compare per-sqm deals and respond to promos; move-up buyers (45% of contracted sales in 2024) demand upgrades and after‑sales concessions; online transparency (>70% consult listings) compresses premiums; mortgage conditions (5yr LPR 3.65%, typical mortgage ~4.2%) shape affordability.
| Metric | 2024 |
|---|---|
| Move-up share | 45% |
| Pre-sale share | 75% |
| 5yr LPR | 3.65% |
| Typical mortgage | ~4.2% |
| Online consult | >70% |
Preview Before You Purchase
Logan Property Holdings Porter's Five Forces Analysis
This Logan Property Holdings Porter's Five Forces Analysis preview is the exact, fully formatted document you will receive immediately after purchase. It contains the complete competitive assessment—threat of new entrants, bargaining power of suppliers and buyers, threat of substitutes, and industry rivalry—ready for download and use. No placeholders, no mockups: the file shown is your final deliverable.
Description
Don't Miss the Bigger Picture
Logan Property Holdings faces moderate buyer power, rising supplier consolidation, and intense local competition that together shape margins and growth prospects. Our Porter's Five Forces snapshot flags threats from new entrants, substitutes, and regulatory shifts that could alter strategic positioning. This brief only scratches the surface—unlock the full Porter's Five Forces Analysis for force-by-force ratings, visuals, and actionable recommendations.
Suppliers Bargaining Power
Land access concentration
Urban land in the Greater Bay Area is allocated exclusively via local-government auctions, concentrating supply power and driving up reserve prices and conditional clauses in core cities; this forces Logan to match government timetables to replenish land banks and align with policy direction. Long-term cooperation agreements and urban-renewal pipelines mitigate some supplier leverage by securing phased land supply and joint-development rights.
Materials price volatility
Materials price volatility in 2024 elevated supplier power for Logan Property Holdings as steel, cement, glass and fittings—while fragmented—experienced commodity cycles with steel price swings of about 20%, compressing margins on fixed-price pre-sale projects.
Contractor and labor dependence
GCs, MEP firms and specialty contractors materially shape timelines and finish quality, with an AGC 2024 survey showing 79% of firms reporting difficulty finding qualified workers, tightening bargaining power. Safety compliance and tight labor markets have driven subcontractor rate increases of roughly 3–5% in 2024, strengthening supplier leverage. Logan’s multi-vendor rosters, performance-linked contracts and in-house PMO oversight mitigate slippage and rebalance negotiation power.
Financing and capital providers
Banks, trust companies and bondholders shape Logan Property Holdings cost of capital and covenant terms; sector deleveraging since 2021 has made lenders more selective, tightening financing availability. Strong presales and efficient cash collection enhance Logan’s negotiating leverage, while diversified onshore/offshore funding and multiple channels moderate supplier power.
- Financing concentration risk
- Presales improve terms
- Diversified funding lowers pressure
Design and tech vendors
Design and tech vendors (architects, BIM, smart-building providers) add differentiation for Logan but are largely replaceable; signature firms can command premiums on flagship projects. Competitive RFPs and Logan’s internal design standards (expanded in 2024) keep supplier pricing disciplined, limiting supplier leverage even as smart-building uptake rises—global smart-building market ~USD 92bn in 2024.
- Replaceability: high
- Premiums: signature firms win flagship bids
- Pricing: maintained by RFPs
- Risk mitigation: internal design standards
Urban auctions and 2024 materials volatility squeeze developer leverage amid selective financing
Urban land auctions concentrate supplier power, forcing Logan to follow government timetables and rely on long-term cooperation to secure sites. Materials volatility in 2024 raised supplier leverage—steel swung ~20%—while subcontractor rates rose ~3–5% amid tight labor. Financing remains selective post-2021; strong presales and diversified funding partly restore negotiation leverage.
| Factor | 2024 Data |
|---|---|
| Steel price swings | ~20% |
| Subcontractor rate increases | ~3–5% |
| Smart-building market | ~USD 92bn |
What is included in the product
Detailed Word Document
Uncovers key drivers of competition, buyer and supplier power, entry threats and substitutes specific to Logan Property Holdings, highlighting strategic vulnerabilities and defensive advantages within China's property market.
Customizable Excel Spreadsheet
A concise Porter's Five Forces one-sheet for Logan Property Holdings that visualizes competitive pressure with a spider chart, lets you tweak force levels for new data, and drops straight into pitch decks.
Customers Bargaining Power
Price-sensitive first-time buyers
Price-sensitive first-time buyers in the GBA are highly mortgage-dependent, often using LTVs up to 90% for entry purchases, and they compare per-sqm prices and discounts across districts to the nearest CNY/HKD figure. Promotional campaigns, short-term price cuts and 2–5 year installment plans materially sway purchase timing. Developers must trade off deeper discounts to capture volume against protecting margins and presales cashflow.
Upgraders demand quality
Move-up buyers prioritize layout, amenities, schools and community services and at Logan Property this cohort drove 45% of 2024 contracted sales, pushing demand for upgraded specifications. They routinely negotiate extras and after-sales commitments, increasing warranty and service costs by an estimated 3–5% of unit price. Strong brand reputation and consistent delivered quality in 2024 supported higher willingness to pay, while value-added property management reduced churn and price haggling by improving renewal rates.
High transparency and comparison
Online listings, forums and live-stream sales have driven market transparency for Logan Property, with buyers benchmarking launches in real time and shrinking willingness to accept premiums. Recent industry trends in 2024 show over 70% of mainland Chinese homebuyers consult online listings before purchase, compressing pricing power without clear differentiation. Data-driven pricing and micro-segmentation enable Logan to align prices with local demand pockets and preserve margins.
Financing availability impact
- Mortgage rate: 5-year LPR 3.65% (2024)
- Typical mortgage ~4.2% (2024)
- Flexible payments raise conversion
- Bank partnerships cut approval risk
Switching and refund policies
- Pre-sale share ~75% (2024)
- Refund/change policies increase conversions
- Timely handover & defect fixes reduce complaints
- Strong CRM lowers cancellation rates
Buyers hold pricing power as online transparency and low mortgages compress premiums
Buyers wield strong bargaining power: price-sensitive first-timers compare per-sqm deals and respond to promos; move-up buyers (45% of contracted sales in 2024) demand upgrades and after‑sales concessions; online transparency (>70% consult listings) compresses premiums; mortgage conditions (5yr LPR 3.65%, typical mortgage ~4.2%) shape affordability.
| Metric | 2024 |
|---|---|
| Move-up share | 45% |
| Pre-sale share | 75% |
| 5yr LPR | 3.65% |
| Typical mortgage | ~4.2% |
| Online consult | >70% |
Preview Before You Purchase
Logan Property Holdings Porter's Five Forces Analysis
This Logan Property Holdings Porter's Five Forces Analysis preview is the exact, fully formatted document you will receive immediately after purchase. It contains the complete competitive assessment—threat of new entrants, bargaining power of suppliers and buyers, threat of substitutes, and industry rivalry—ready for download and use. No placeholders, no mockups: the file shown is your final deliverable.











